VODCA 2004 Preliminary Version
On the Use of Singular Value Decomposition for a Fast Intrusion Detection System Sanjay Rawat 1,3 Dept. of Computer & Information Sciences University of Hyderabad, Hyderabad, India & IDRBT Castle Hills, Masab Tank, Hyderabad, India
Arun K. Pujari 2,4 Dept. of Computer & Information Sciences University of Hyderabad, Hyderabad, India
V. P. Gulati 5 IDRBT Castle Hills, Masab Tank, Hyderabad, India
Abstract Traditionally, the application of data mining in intrusion detection systems (IDS) concentrates on the construction of operational IDSs. The main emphasis is on data mining steps, and other KDD (Knowledge Discovery in Databases) are largely ignored. The present study investigates the applicability of Spectral Analysis technique - singular value decomposition (SVD) as a preprocessing step to reduce the dimensionality of the data. This reduction highlights the most prominent features in the data by removing the noise. This preprocessing step not only makes the data noise-free, but also reduces the dimensionality of the data, thereby minimizing computational time. The proposed technique can be applied to other existing methods to improve their performance. We perform experiments on various data sets like DARPA’98, UNM sendmail, inetd, and login-ps data sets to show that reduction in the dimension of the data does not degrade the performance of the IDS. In fact, in case of single application monitoring like sendmail, by applying reduction techniques we get very encouraging results. Key words: Intrusion Detection, Anomaly, System Calls, Process, Singular Value Decomposition (SVD)
This is a preliminary version. The final version will be published in Electronic Notes in Theoretical Computer Science URL: www.elsevier.nl/locate/entcs
Rawat, Pujari, and Gulati
1
Introduction
With the widespread use of networked computers for critical systems, computer security is attracting increasing attention and intrusions have become a significant threat in recent years. Intrusion detection is the process of monitoring the events in a computer or network and analyzing them for signs of intrusions. The number of intrusions is dramatically increasing and so are the costs associated with them. The increasing frequency and complexity of Internet attacks has raised the level of knowledge required by systems administrators to effectively detect the intrusions. Therefore, intrusion detection systems (IDS), which are software or hardware products that automate this monitoring and analysis process [2], have become a critical component of Security Architecture. ID systems collect information from network activities and system activities. Network-based systems look for specific patterns in the network traffic and host-based systems look for those patterns in the audit files generated by the system or some other device. On the basis of this collected information, ID system takes decision about the activity as either normal or intrusive. We can group ID systems into two classes: misuse based systems and anomaly detection systems. Misuse detection refers to intrusions that follow well-defined patterns of attacks that exploit weaknesses in the system. Misuse detection techniques have high detection rate for already known attacks but show poor performance in the presence of a new attack or even a variant of previously known attack. Anomaly detection systems attempt to model (learn) usual or normal behavior, defined by the security policy of the organization. Any significant deviation from this established behavior is flagged as potential intrusion. This class of ID systems has the capability to detect new attacks and variants of previously known attacks, but the rate of false positives is very high due to the lack of knowledge of the nature of attacks. Anomaly based systems also face a problem of getting clean normal data for its learning. Often in live network, it is very difficult to claim to have clean normal data. Normally the data contain some background activities, termed as noise, which some times degrades the overall performance of the ID system. Also, as mentioned earlier, a good amount of knowledge is required to detect the presence of the attack. In other words, we should collect as much information as possible so that attack can be manifested in this, but larger the amount of data to process, higher will be the cost in terms of time and space, associated with it. This leads to a delay in identifying the presence of attack and thus defeats the main purpose of having IDS i.e. on time detection of the attack. Present breed of networks works on the speed of mbps 1
Thanks to anonymous reviewers for their useful comments and VODCA OC for the grant to present this paper. 2 Thanks to MIT, India for its financial support. 3 Email:
[email protected] 4 Email:
[email protected] 5 Email:
[email protected]
2
Rawat, Pujari, and Gulati
and gbps, thereby producing a huge amount of data in seconds. This imposes a challenge for modern ID systems to process data at this speed. Also, our experience with DARPA data shows that it is very difficult to extract normal and significant process-level information without getting some other unnecessary information as, temporally, data is located very dense. Thus we may get some information, which is not useful in distinguishing normal processes from abnormal ones. In the view of above discussion, practically it is desirable to process as less data as possible which adequately captures all the information required for the manifestation of attacks. Also it has been observed [10] that Data Mining based research in IDS concentrates on the construction of operational IDSs, rather than on the discovery of new and fundamental insights into the nature of data, attacks and false positives. The main emphasis is on data mining steps, and other KDD (Knowledge Discovery in Databases) are largely ignored. In the present work, we focus on preprocessing of the data to be analyzed for intrusion detection and investigate a method of reducing the dimensionality of the data being fed into the host-based system without degrading the performance of the system, by showing rigorous experimental analysis. This work borrows ideas from one of the methods of information retrieval - Latent Semantic Indexing (LSI) [4,3]. We make use of Spectral Analysis to reduce the size of the vectors (explained later) derived from the sequence of system calls by using singular value decomposition (SVD) [8]. We show the effectiveness of our approach by testing it with different data sets - DARPA’98 and UNM sendmail data - inetd data, ps data and login data. We also compare our experimental results on DARPA’98 data with one of the recent proposals by Liao and Vemuri [13]. The major contributions of this study are: •
It is established that dimensionality of the data can be reduced without degrading the performance of intrusion detection system, by using a technique called SVD.
•
To show the effectiveness of the approach, we provide results of rigorous experiments, performed on various data sets - DARPA’98 BSM logs and UNM sendmail, login, ps data sets.
The rest of the paper is organized as follows: Section 2 briefly introduces some of the related work in this area. In section 3, we cover some of the topics as background work like LSI and SVD. The proposed scheme is explained in detail in section 4. All of the experimental analysis and results are provided in the section 5, which is followed by the section 6, which concludes the work with a note on future work.
2
Related Work
Anomaly-based IDS has the capability to identify new attacks, as any attack will differ from the normal activity. However, such systems have a very high 3
Rawat, Pujari, and Gulati
rate of false positives [2]. Hence, a lot of research is being done in the area of anomaly-based intrusion detection [1]. A pioneering work in the field of anomaly detection by Denning [5] describes a model for detecting computer abuse by monitoring the system’s audit records. In this approach, profiles of subjects (users) are learnt and statistical methods (means and standard deviation) used to calculate deviations from the normal behavior. Lane et al [11] proposes another approach that captures users’ behavior. A database of sequences of UNIX commands that a user issues normally, is maintained for each user. Any new command sequence is compared with this database using a similarity metric. Another approach, initiated by Forrest et al [6,9], captures the normal behavior of processes as programs show a stable behavior over the period of time under normal execution. In this approach, short sequences of system calls are used to profile a process. Experiments, performed over different data sets, show the effectiveness of the approach [18]. A similar approach is followed by Lee et al [12], but they make use of a rule learner RIPPER, to form the rules for classification. Sato et al [17] propose a scheme based on the profiling of processes which is constructed from the ranking of the system calls. They use a pattern matching method, called DP Matching, to measure the distance between profiled and new processes. Artificial Neural Networks have also been used for anomaly detection [7] due to their ability to learn behavior and generalize from this learning. In their approach, Ghosh et al use Leaky Bucket Algorithm to capture the temporal locality. A new scheme based on the kNN Classifier is proposed by Liao and Vemuri [13] in which, each process is treated as a document and each system call as a word in that document. The process is converted into a vector and cosine similarity measurement is used to calculate the similarity among processes. In a very recent proposal [16], Liao’s method is further improved by introducing a different metric and considering the ordering of system calls in the process. The proposed scheme in this paper also follows a similar approach by using kNN classifier for the classification of process.
3
Background
In this section, we provide necessary background to understand the technique, used in our scheme. The section also outlines the scheme of Liao and Vemuri for the completeness of the paper as the proposed scheme implements SVD technique on Liao’s scheme. However, the proposed technique can be used with any method which makes use of feature vectors (i.e. data should be used as vectors). According to Denning, normal behavior of entities is substantially different from the intrusive behavior (abnormal behavior). Therefore, in case of process monitoring approach, under the normal execution a process exhibits a pattern, which is different from the pattern under an effort to exploit the process to launch an attack. A process can be presented in terms of the system 4
Rawat, Pujari, and Gulati
calls made by it. It should be noted that in order to exhibit a specific pattern under normal condition, there should be some high correlation among the system calls made by the process. In other words, occurrence of some system calls leads to the presence of other related system calls. If this co-occurrence of system calls can be captured, the detection of the abnormal execution of the process becomes easier task. In this context, we try to investigate the idea of applying Latent Semantic Indexing (LSI) method to build an anomaly based IDS. LSI is a relevant documents retrieval method [4], being used by search engines [3]. In addition to learn which keywords a document contains, the method examines the document collection as a whole, to see which other documents contain some of those same words. LSI considers documents that have many words in common to be semantically close and ones with few words in common to be semantically distant. LSI looks at patterns of words distribution (specifically, word co-occurrence) across a set of documents. In the process of applying LSI, a word-by-document matrix A = [aij ] is constructed where aij is the frequency of ith word in the j th document, i = 1, ..., m and j = 1, ..., n. Thus each document is represented as a vector in m-dimensional term-space [4]. In this space, documents that have many words in common will have vectors that are near to each other, while documents with few shared words will have vectors that are far apart. LSI works by projecting this large, multidimensional space down into a smaller number of dimensions by decomposing the matrix A using a linear algebraic method called Singular Value Decomposition (SVD), which is described in detailed in the next section. In doing so, words that are semantically similar will get squeezed together and will no longer be completely distinct. 3.1 Singular Value Decomposition SVD is closely related to a number of mathematical and statistical techniques in a wide variety of other fields, including eigenvalue decomposition, spectral analysis, and fractal analysis [8]. Let A be the term-by-document matrix as described above. Then SVD of A is given by (1)
0
A = T0 S0 D0
where T0 and D0 are the matrices of left and right singular vectors and S0 is the diagonal matrix of singular values (square roots of eigen values of AT A or AAT ) in decreasing order, of A. T0 and D0 have orthonormal columns. These eigen values describe the variance of each of the components. Initially S0 is a n × n matrix with singular values filling the first r places on the diagonal, r = rank(A). The columns of T0 can be thought of as “term” vectors, in the sense that each columns of T0 represent a linear combination, or pattern, of terms that tend to occur in the same proportion. Orthogonality implies that the columns of T0 span a vector space of dimension r, and can therefore be regarded as axes in that space. It can be shown that the entries in the first column of T0 are positive which indicates the terms that tend to occur in all 5
Rawat, Pujari, and Gulati
documents. Entries in other columns may be positive or negative. A negative negative entry for one term implies that when some other terms are present in a document, the term with negative entry is less likely to be present. The singular values in S0 (along with the entries in the matrix D0 ) indicate how important the different “term” are in each document, and those same singular values (and the entries in the matrix T0 ) indicate how much each document contributes to the corpus. It can be shown [15] that the entries in row i of the 0 0 matrix S0 D0 are document i’s coordinates in the new space denoted by D0 . The basis for this space is the set of term vectors, in the sense that each column of T0 is an axis in the new space. So each document has coordinates along the axes defined by each of the columns of T0 . If two documents (i.e. two rows 0 of S0 D0 ) have a high value for a given coordinate i, it could be inferred that those documents are strong in the characteristic, represented by the column i. SVD allows a simple strategy for optimal approximate fit using smaller matrices. In the matrix S0 , the first l largest values are kept and accordingly the size of matrices T0 and D0 are adjusted as follow: 0 (2) Al = Tl Sl Dl 0
where Tl is m × l matrix, Sl is l × l matrix and Dl is l × n matrix. The new matrix Al is approximately equal to A and is of rank l. The amount of dimension reduction i.e. the choice of l is critical to our work and should be chosen carefully. The matrix Sl provides scaling, in the sense that for 0 any row i of the “scaled” matrix Sl Dl (= B, say), each entry Bi,j in row i of B is the coordinate of document j along the axis determined by the ith column of Tl [15]. Any similarity measure (e.g. cosine similarity) or dot 0 product between two column vectors of the product Sl Dl reveals the extent to which two documents have a similar profile of terms. Any query q is also treated as a pseudo-document, where q is a row vector of size l × m. This new vector is mapped into the new space as follows: (3) qˆ = qTl Sl−1 This transformed query can be treated as one of the columns of matrix Al , and thus can be compared against rest of the columns to find most similar documents, as mentioned above. Since we apply our methodology on a recent scheme by Liao and Vemuri and compare experimental results of our approach with that of Liao, in the next subsection we describe Liao’s scheme in short to make the paper selfcontained. 3.2 A Host-Based Anomaly Detection Scheme by Liao and Vemuri There are many approaches proposed in the literature to build a HIDS. A commonly used methodology is to monitor processes in terms of system calls invoked by them. Various processes under Unix system are converted into vectors using the frequencies or occurrence of various system calls invoked by those processes under normal condition. After that, a number of classifiers 6
Rawat, Pujari, and Gulati
can be applied to classify the future instances of processes as either normal or abnormal. An approach based on kNN classifier is proposed by Liao and Vemuri [13], where the frequencies of system calls, invoked by a program (process), are used to define the program’s behavior. The paper presents an analogy between Text Categorization and Intrusion Detection, in the sense that each system call is treated as a word and a set of system calls generated by the process as a document. The processes under normal execution are collected from the DARPA’98 BSM data and thereafter converted into the vectors, consisting of the frequencies of the system calls made by them during the normal execution. From all the normal processes, a matrix A = [aij ] is formed, where aij denotes the frequency of ith system calls in the j th process. In order to categorize a new process P into either normal or abnormal class, the process P is first converted into a vector. The kNN classifier then compares it with all the processes Aj in A to determine the k nearest neighbors, by calculating the similarity Sim(P, Aj ), using the cosine formula given by equation 4. P.Aj (4) Sim(P, Aj ) = kP kkAj k √ where kXk = X.X The average similarity value of the k nearest neighbors is calculated and a threshold is set. When the average similarity value is above the threshold, process P is considered as normal, otherwise abnormal.
4
Proposed Scheme
In the view of the above discussion, we suggest that if we replace terms by system calls and documents by processes, and apply the SVD on the collection of processes, then the correlation among the system calls occurring in the processes can be captured. This co-occurrence of system calls can, thus, be taken as the patterns for normal behavior. Therefore, in this work, we make use of a spectral analysis technique- SVD, in the stage of preprocessing of the data to reduce the dimensionality of the space. This not only reduces the computational time but also removes noise, as afore mentioned and is shown by means of experimental results in the next section. As noted earlier, processes can be represented as the sequences of system calls made by them. These sequences show patterns in terms of co-occurrence of system calls under normal execution. The incidence matrix A can be constructed and its truncated form Al can be obtained by using SVD using equation 2. The main advantage of using SVD is that it tries to capture system calls which occur together in most of the processes and projects them closer into a new space of lower dimension. In this way, processes sharing the common system calls will become more similar than those sharing very few system calls in common. In context of IDS, every new process is considered as a query, to be matched against the 0 document database (i.e. normal processes, contained in the product Sl Dl ). 7
Rawat, Pujari, and Gulati
Thus each new process P is first mapped into the new space using equation 3. This new transformed process, say Pˆ , is matched against the columns of 0 the product Sl Dl using the cosine similarity measure given by equation 4. At this stage kNN-algorithm is applied to classify the process as either normal or abnormal. In other words, cosine similarity score of Pˆ with each column 0 of Sl Dl is calculated and sorted in descending order. The first k scores are selected and their average is calculated. If this average is greater than some predefined threshold value, then the process is declared as normal otherwise abnormal.
5
Experimental Setup and Results
Our objective is to show the use of SVD to reduce the dimension of the space and remove the noise without degrading the performance of the system. We choose two data sets to perform the experiments- DARPA’98 BSM data and UNM data for various applications such as sendmail, inetd, login and ps. The code for performing all the experiments is written in Matlab [14], running on a Windows 2000 machine. 5.1 Experiments with DARPA data DARPA’98 BSM data is widely used data set for the evaluation of host-based IDS. Therefore we choose this data set to test our scheme. Another reason of choosing this set is that one of the recent proposals by Liao and Vemuri [13] uses the same data for their scheme and we are interested to show the performance of our scheme vis-a-vis Liao’s scheme. However, we repeat the experiment with Liao’s scheme to calculate the results in our setup. We use BSM audit logs from the 1998 DARPA data for the training and testing of our algorithm. After analyzing the whole training data, we extract the 53 unique system calls that appear in the training data. Actually 3 of these system calls are one of the original system calls but with different suffix/prefix. On analyzing the whole BSM logs (list files), we locate the five days which are free of any type of attacks. There is a total of 1937 normal sessions reported in the four days data. We carefully extract the processes occurring during these days and our training data set consists of 769 unique processes. There are 412 normal sessions on the fifth day and we extract 4443 normal processes from these sessions for testing data. In order to test the detection capability of our method, we incorporate 40 intrusive sessions into our testing data. An intrusive session is said to be detected if any of the processes associated with this session is classified as abnormal. Thus detection rate is defined as the number of intrusive sessions detected, divided by the total number of intrusive sessions. In this case, the incidence matrix A is of the size 53 × 769. We calculate the SVD of A. To reduce the dimension of the matrix, we choose the sin8
Rawat, Pujari, and Gulati
gular values greater than 100 (l = 15), greater than 20 (l = 22) and greater than 10 (l = 27) for experimentation. For kNN classifier, we choose three values K = 5, 10, 15. To measure the effectiveness of the approach, we perform experiments with different combinations of these values. On the basis of experiments, the combination which gives the best result is K = 5, 10, 15 and l = 27. The results are shown in table 1. l=27 K=5
K = 10
K = 15
Threshold
FP
DR
Threshold
FP
DR
Threshold
FP
DR
0.20
0.06
0.73
0.20
0.06
0.80
0.20
0.06
0.80
0.24
0.08
0.83
0.24
0.09
0.85
0.24
0.11
0.85
0.27
0.09
0.85
0.27
0.12
0.85
0.27
0.12
0.85
0.30
0.12
0.93
0.30
0.15
0.93
0.30
0.17
0.95
0.33
0.15
0.95
0.33
0.18
0.98
0.33
0.18
0.98
0.37
0.23
1.0
0.37
0.23
1.0
0.37
0.23
1.0
0.40
0.25
1.0
0.40
0.25
1.0
0.40
0.25
1.0
Table 1 False Positive Rate vs Detection Rate for different values of K = 5, 10, 15 at l = 27
This combination achieves a 100% detection rate at 23% false positive rate, which is quite a comparable result with other schemes. As mentioned earlier, we calculate results using Liao’s scheme for comparison to show the usefulness of our approach. Following table 2 summarizes the findings with Liao’s scheme. In this case, we attain a detection rate of 100% Threshold
FP
DR
0.930
0.008
0.70
0.950
0.035
0.73
0.970
0.054
0.83
0.980
0.058
0.92
0.985
0.129
0.95
0.990
0.181
0.95
0.992
0.211
1.00
Table 2 False Positive Rate vs Detection Rate for Liao’s Scheme
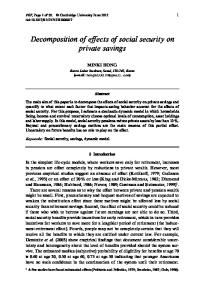
at 21% false positive with vector size 1 × 53, whereas it is 100% detection rate at 23% false positive rate with vector size 1 × 27 under our scheme. Thus, we achieve almost same performance with vector size as low as half of the vector size in Liao’s scheme (see the ROC curve in figure 1). The total computing time in Liao’s scheme is about 1900 seconds, whereas it is 1500 seconds in our method. We consider this as a good improvement as far as the computing time and timely response is concerned. 9
Rawat, Pujari, and Gulati ROC curve for Liao and proposed scheme at l=27 & k=5,10,15 1
0.95 k=5 k=10 k=15 Liao
Detection Rate
0.9
0.85
0.8
0.75
0.7
0
0.05
0.1 0.15 False Positive Rate
0.2
0.25
Fig. 1. ROC curve for Liao’s Scheme and the proposed scheme
Our next round of experiment involves the data sets obtained from UNM site (http://www.cs.unm.edu/˜immsec/systemcalls.htm) which is described in the next section. 5.2 Experiments with UNM Data Our objective of experimenting with UNM data sets is to test another aspect of LSI, and thus SVD, in the realm of ID systems. As discussed earlier, LSI understands the semantic meaning of the documents and words in the terms of the co-occurrence of words in the documents. This co-occurrence is very high if the documents belong to one category (topic). In case of DARPA BSM data, though the processes, collected for training, are normal, they belong to different applications. One implication of this is that it is very difficult to capture extracted common meaning components of many different system calls (words) and processes (documents) [4]. This may be a reason that in DARPA data, we get a bit high false positive rate. Data sets at UNM site are available for different applications i.e. each data set belongs to one category (topic). We choose sendmail, inetd, login and ps data sets for our experiment. In the following paragraphs, we detail our experimental results for each of them. 5.2.1 Sendmail Data Set The sendmail program was traced on an MIT AI lab running SunOS 4.1.1. In normal data set, which is collected for approximately three days, there are originally 71767 traces. We discard some very large processes and the 10
Rawat, Pujari, and Gulati
final set consists of 65026 processes. Out of these, we keep 3000 processes for testing data set. These remaining 62024 processes are again processed to extract 10764 unique processes. We separate 6000 processes for training and remaining 4764 processes are mixed with already chosen 3000 processes. Thus our normal testing data set consists of 7764 processes out of which at least 4764 are not used in training set. As there is no attack data set with this trace of sendmail, we choose attack data from UNM synthetic sendmail data (http://www.cs.unm.edu/˜immsec/data/synth-sm.html) for the following attacks: Sunsendmailcp intrusion, Decode intrusion, and Error condition forwarding loops. There are a total of eight attacks involved in the testing data set. The incidence matrix A is constructed from the normal processes and decomposed using SVD. For our experiment, we consider singular values greater than 20 (l = 28) and first 10 most similar processes for kNN. We get a detection rate of 100% with false positive as low as 0.06%. However, when we analyze the intrusive processes, we find that most of them is containing system calls that are not in the set of normal system calls. That may be due the fact that we choose different data set for intrusive data, in which the mapping may be different. Despite these, we are able to differentiate among normal and abnormal processes with vector size of only 1 × 28, whereas original size is 1 × 64. 5.2.2 inetd, login and ps data sets inetd program initiates a daemon process in background and then exits. The intrusion to exploit this program is a DoS attack that ties up network connection resources. There are a total of three normal processes for training i.e. for constructing incidence matrix A. Due to the lack of sufficient number of normal processes [18], we cannot test the false positive rate for these data sets. There is one attack against this program, which involves 29 processes. There is a total of 35 unique system calls made by these 3 processes under normal execution. For our experiment, we choose l = 3 and K = 3, i.e. we take all the processes into consideration for kNN classifier. At the threshold of 0.25, we could identify the attack. What is most encouraging is that only the vectors of size 1 × 3 (about 12 times shorter) are sufficient to take decision about normality or abnormality. For login data set, two attacks are recorded, which involve Trojan intrusion. There are a total of 12 normal processes for training. There are 47 unique system calls occurred during the normal execution of the program. For experiment, we choose the singular values greater than 1, i.e. l = 6. We chose K = 4 for kNN classifier. At the threshold value of only 0.04, we are able to detect both of the attacks. With this small value, it can be said that all the normal processes should not be detected as intrusions and therefore a very low false positive rate is expected. Once again, we are able to achieve this performance at vector size of 1 × 6 only (original size is 1 × 47). ps gives a snapshot of the current processes. Like login program, two 11
Rawat, Pujari, and Gulati
attacks are recorded for this data, which involve Trojan intrusion. These intrusions allow unauthorized access to the system through a built in “backdoor”. There are a total of 24 normal processes for training and 22 unique system calls. For experiment, we choose the singular values greater than 1, i.e. l = 6. We chose K = 4 for kNN classifier. At the threshold value of only 0.28, we are able to detect both of the attacks. Once again, we are able to achieve this performance with vector size of only 1 × 6 (original size is 1 × 22). In the view of above experiments, it can be asserted that data reduction indeed improves the performance of the ID systems by saving computational time and reducing the noise present in the data.
6
Conclusion and Future Work
Instead of presenting a new method of classifying data as normal or abnormal, the present study focuses on the preprocessing of the data. As has been observed by the study of Julisch [10], data mining in intrusion detection is mainly used to construct a ”black box” that detects intrusions. Through this study, we explore a less-paid-attention, yet important area in the process of intrusion detection. Our study shows that by applying LSI technique, dimensionality of the data can be reduced without loosing its performance. It is also established by experimental results that this method of reduction performs better in case of ’per-application’ data set e.g. login, inetd etc. As a future task, we are further analyzing the decomposition of incidence matrix to gain some insight about the association among system calls under normal and abnormal execution to better understand the process profiling. Such knowledge could be used to capture normal profiles of the programs for better intrusion detection systems.
References [1] Axelsson, S., Research in Intrusion Detection Systems: A Survey, Technical Report No. 98-17, Dept. of Computer Engineering, Chalmers University of Technology, Gteborg, Sweden, 1999. [2] Bace, R. and Mell, P., NIST Special Publication on Intrusion Detection Systems, SP800-31, NIST, Gaithersburg, MD, 2001. [3] Berry, M. W., Dumais, S. T. and O’Brien, G. W., Using Linear Algebra for Intelligent Information Retrieval, SIAM Review 37(4), (1995), 573–595. [4] Deerwester, S. Dumais, Susan, T., Furnas, G. W., Landauer, T. K. and Harshman, R., Indexing by Latent Semantic Analysis, Journal of the American Society of Information Science, 41(6), (1990), 391–407. [5] Denning, D. E. An Intrusion-Detection Model, In: Proceedings of the 1986 IEEE Symposium on Security and Privacy (SSP ’86), IEEE Computer Society Press, (1990), 118–133.
12
Rawat, Pujari, and Gulati
[6] Forrest, S., Hofmeyr, S. A., Somayaji, A. and Longstaff, T. A., A Sense of Self for Unix Processes, In: Proceedings of the 1996 IEEE Symposium on Research in Security and Privacy. Los Alamitos, CA. IEEE Computer Society Press, (1996), 120–128. [7] Ghosh, A. K. and Schwartzbard, A., A Study in Using Neural Networks for Anomaly and Misuse Detection, In: Proceedings of the 8th USENIX security Symposium. Aug, Washington D C USA, (1999), 141–151. [8] Golub, G. H. and van Loan, C. F., “Matrix Computations”, John Hopkins University Press, 3rd edition, 1996. [9] Hofmeyr, S. A., Forrest, A. and Somayaji, A., Intrusion Detection Using Sequences of System Calls, Journal of Computer Security. 6, (1998), 151–180. [10] Julisch, K., Data mining for intrusion detection: A critical review, In: Barbara D, Jajodia S (eds.) “Applications of Data Mining in Computer Security”, Kluwer academics Publishers,Boston, 2002. [11] Lane, T. and Brodly, C. E., An application of Machine Learning to Anomaly Detection, In: Proceeding of the 20th National Information System Security Conference, (1997), 366–377. [12] Lee, W., Stolfo, S. and Chan, P., Learning Patterns from Unix Process Execution Traces for Intrusion Detection, In: Proceedings of the AAAI97 workshop on AI methods in Fraud and risk management, (1997), 50–56. [13] Liao, Y. and Vemuri, V. R., Use of K-Nearest Neighbor Classifier for Intrusion Detection, Computers & Security, 21(5), (2002a), 439–448. [14] MATLAB -The Language http://www.mathworks.com.
of
Technical
Computing.
URL:
[15] Nicholas, C. and Dahlberg, R., Spotting Topics with the Singular Value Decomposition, In: Proc. PODDP’98, LNCS # 1481, Springer-Verlag, (1998), 82–91. [16] Rawat, S., Gulati, V. P. and Pujari, A. K., Frequecy And Ordering Based Similarity Measure For Host Based Intrusion Detection, Accepted In: J Information Management and Computer Security, 12(5), Emerald Press, 2004. [17] Sato, I., Okazaki, Y. and Goto, S., An Improved Intrusion Detection Method Based on Process Profiling, IPSJ Journal, 43(11), (2002), 3316–3326. [18] Warrender, C., Forrest, S. and Pearlmutter, B., Detecting Intrusions Using System Calls: Alternative Data Models, IEEE Symposium on Security and Privacy, (1999), 133–145.
13