Geomorphology 124 (2010) 1–16
Contents lists available at ScienceDirect
Geomorphology j o u r n a l h o m e p a g e : w w w. e l s ev i e r. c o m / l o c a t e / g e o m o r p h
Paleohydrologic bounds and extreme flood frequency of the Upper Arkansas River, Colorado, USA J.F. England Jr. a b c
a,
⁎, J.E. Godaire b, R.E. Klinger b, T.R. Bauer b, P.Y. Julien c
Bureau of Reclamation, Flood Hydrology, 86-68250, Denver Federal Ctr., Denver, CO 80225, USA Bureau of Reclamation, Sedimentation and River Hydraulics, 86-68240, Denver Federal Ctr., Denver, CO 80225, USA Department of Civil Engineering, Colorado State University, Fort Collins, CO 80523, USA
a r t i c l e
i n f o
Article history: Received 19 January 2007 Received in revised form 16 July 2010 Accepted 22 July 2010 Available online 1 August 2010 Keywords: Paleoflood data Historical information Extreme floods Flood frequency analysis
a b s t r a c t The Upper Arkansas River basin has experienced notable large floods, including the event of 2–6 June 1921 that devastated the city of Pueblo, Colorado. We investigated flood and paleoflood hydrology at strategic sites to determine the frequency and geographic extent of extreme floods within the basin for a dam safety application. Streamgage, historical, and paleoflood data were utilized to develop frequency curves at sites near Salida, Cotopaxi, Parkdale, and Pueblo. Soil/stratigraphic descriptions, radiocarbon dating, and hydraulic modeling were used to estimate paleoflood nonexceedance bounds at the four sites, which ranged from 400 to 2200 YBP for late Holocene surfaces to late Pleistocene surfaces near Cotopaxi. Peak-flow data are from lower-magnitude snowmelt runoff in May and June in the upper basin and from high-magnitude rainfall runoff from June to August in the lower basin. Flood frequency curves reflect this transition near Parkdale from snowmelt to extreme rainfall-runoff. For similar return periods, paleoflood peak discharges increase from about 480 m3/s upstream at Loma Linda to about 4250 m3/s downstream near Pueblo. This increase is attributed to the larger rainfall component derived from lower elevations between Loma Linda and Pueblo. Return periods for design floods at Pueblo Dam exceeded 10,000 years based on paleoflood frequency curve extrapolations. Published by Elsevier B.V.
1. Introduction Paleoflood data are a critical component for assessing hydrologic hazards at Bureau of Reclamation dams (Bureau of Reclamation, 2002; Levish et al., 2003; Swain et al., 2004; England et al., 2006). By providing information beyond the historical gaging record, it typically serves as a data-based means to extend the flood frequency curve well beyond the 100-year return period. It also provides an important check for the validity of flood frequency and rainfall-runoff modeling results because it is based on direct observations of the physical system. Through field-based studies, hydrologic investigations, hydraulic modeling, and laboratory analysis, a paleoflood hydrology study can provide data on the magnitude and frequency of floods and can indicate a limit to flood magnitude over a specified time interval. When used in flood frequency analysis, paleoflood data can greatly improve the flood hazard estimation for return periods beyond the period of record (O'Connell et al., 2002; England et al., 2003a). When extreme floods or “high outliers” are present in the record, such as the June 1921 record flood on the Arkansas River (Follansbee and Sawyer, 1948), their return period may be much greater than the gage period
⁎ Corresponding author. Tel.: +1 303 445 2541; fax: +1 303 445 6351. E-mail address:
[email protected] (J.F. England). 0169-555X/$ – see front matter. Published by Elsevier B.V. doi:10.1016/j.geomorph.2010.07.021
of record. Placing a large historical flood into frequency context with geological deposits provides a more accurate estimate of the true return period of the extreme flood (e.g., Costa, 1978). Paleoflood hydrology has a long history in a wide variety of settings throughout the world (Baker et al., 1988; House et al., 2002a,b). Early studies by Mansfield (1938) on the Ohio River and Jahns (1947) on the Connecticut River recognized that historical floods on those rivers overtopped stream terraces that had not been inundated for thousands of years. The stratigraphic record present along streams in the form of terrace and floodplain deposits represents indirect indicators of the magnitude of large floods on a river and may be 10 to 100 times longer than conventional stream gaging records of large floods (Jarrett, 1991; House et al., 2002a,b). Thus, the study of paleofloods not only offers a means to reduce the uncertainty in flood frequency analyses and verify the results of rainfall-runoff models, but also helps to extend the record many times longer than the length of the stream and precipitation gages or historical records (Costa, 1978). Paleoflood studies can also provide a long-term perspective that can place historical large-magnitude floods into temporal context and assist in reconciliation of conflicting information (Helley and LaMarche, 1973). One widely used technique in the study of paleofloods uses the fine-grained sedimentological record that accumulates in backwater areas (slackwater) to construct a detailed history of past floods, ideally in bedrock canyons (e.g., Patton et al., 1979; Kochel and Baker,
2
J.F. England Jr. et al. / Geomorphology 124 (2010) 1–16
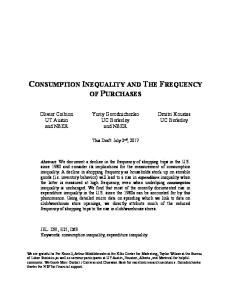
1988). This technique can be extremely useful in characterizing the number of individual floods, their magnitude, and the frequency of large floods, but locations exist where the inherent assumption that a sequence of slackwater sediments represents a complete and continuous record of floods does not apply (House et al., 2002a,b). In addition, the physical setting of a backwater site may not be ideally suited for reconstructing or accurately estimating the peak discharge for the flood that is associated with a particular sequence of slackwater deposits in hydraulic models. This issue can often be minimized with more elaborate hydraulic modeling (e.g., Denlinger et al., 2002). Another methodology uses terrace surfaces that lack evidence of recent inundation and display evidence of long-term stability to establish an upper limit to flood magnitude and frequency, using a concept called a paleohydrologic bound. A paleohydrologic bound, or nonexceedance bound, is a time interval during which a given discharge has not been exceeded (Levish, 2002). The positive evidence of landscape stability on surfaces such as terraces is used to develop a paleohydrologic bound. Rather than constructing a detailed stratigraphic record of past floods, the non-inundation approach focuses on positive evidence of surface stability. Geomorphic surfaces adjacent to rivers are reliable indicators of maximum flood stage through time because fine-grained soils and streamtransported floodplain sediments that can be easily modified by floods typically underlie these surfaces. Disruptions in soil profiles and geomorphic features, such as eroded channels, that result from significant inundation by large floods, are generally easily recognized (e.g., Shroba et al., 1979; Brooks and Lawrence, 1999; House et al., 2002a,b; Levish, 2002). The non-inundation approach is similar to the studies by Mansfield (1938) and Jahns (1947). The age of a stable geomorphic surface is an estimator of the minimum return period of a flood that could significantly alter that surface (Costa, 1978), given that the surface lacks evidence of recent flood modification, erosion or deposition. Defining a nonexceedance bound is accomplished by identifying terrace surfaces with stable soils that serve as limits for the paleostage of large floods and estimating ages for those terraces (Fig. 1). Peak discharges that inundate the terrace to a depth sufficient to erode the existing stable soil are estimated using a hydraulic model. The key concepts of a paleohydrologic bound are to identify stable surfaces, estimate ages for the surfaces, and utilize hydraulic models and shear stress to estimate a nonexceedance discharge for the
surface. The field expression of a paleohydrologic bound, a stable geomorphic surface, is a floodplain that has been abandoned (Levish, 2002). Geomorphic surfaces adjacent to rivers define a maximum channel width, over the time period represented by the surfaces, through which a maximum discharge can be estimated. The ages associated with these surfaces that form paleohydrologic bounds are almost always minimum ages because of the problems related to determining the precise time when a particular surface was abandoned (Levish, 2002). The resulting nonexceedance bound is a maximum discharge during the minimum time interval since stabilization. The non-inundation approach is extremely useful in flood hazard assessment because geomorphic and stratigraphic information derived from terrace surfaces provide an upper limit or bound on the age and magnitude of extreme floods (Levish, 2002). This technique has been used to estimate extreme flood hazard for dam safety applications in the western U.S., and provide critical constraints on flood frequency extrapolations for remote (≥10,000 years) return periods (Levish and Ostenaa, 1996; Ostenaa et al., 1996; Reclamation, 2002; Levish et al., 2003). Flood frequency methods have been recently evolving in order to more effectively utilize historical and paleoflood data, including nonexceedance bounds (O'Connell et al., 2002; England et al., 2003a,b). Most conventional estimates for the frequency of large floods are based on extrapolations from stream gaging records that commonly have record lengths shorter than 100 years. While adding historical information can vastly improve flood frequency estimates by extending the record up to several hundred years, estimating the frequency of lower probability floods becomes problematic. Sensitivity analyses of flood frequency calculations have shown that the addition of paleoflood information that spans a range of hundreds to thousands of years is valuable and can have a significant impact on the shape of the flood frequency curve (Stedinger and Cohn, 1986; Blainey et al., 2002; O'Connell et al., 2002; England et al., 2003a). This paper presents a paleoflood nonexceedance and extreme flood hydrology study of the 12,000 km2 Upper Arkansas River basin upstream of Pueblo, CO. The objectives of this study are to (i) describe and quantify the extreme flood hydrology including flood type, seasonality, and historical flood information; (ii) collect paleoflood data to extend the spatial and temporal distributions of existing peakflow observations in the basin; and (iii) conduct a peak-flow frequency analysis that integrates gage, historical, and paleoflood data at several sites. The overall objective is to develop an
Fig. 1. Idealized channel cross section illustrating the fluvial landforms important to the concept of a nonexceedance bound.
J.F. England Jr. et al. / Geomorphology 124 (2010) 1–16
understanding of extreme floods for estimating the flood hazard at Pueblo Dam, Colorado. Paleoflood data are a crucial component to meeting this objective. Using the methodology described by Levish (2002), we rely principally on paleoflood nonexceedance information derived from narrow, bedrock-controlled, canyon reaches within Upper Arkansas River basin. Data are obtained based on the position in the basin relative to the principal geologic feature, the Royal Gorge. This location demarks the transition between steep canyons and narrow valleys to rolling terrain and wider river corridor. 2. Arkansas River basin flood hydrology 2.1. Study area description The 12,000 km2 Upper Arkansas River basin study watershed is located west of the city of Pueblo in southern Colorado (Fig. 2). The Arkansas River originates at the confluence of the East Fork Arkansas River and Tennessee Creeks, high in the Rocky Mountains near Leadville, Colorado. The upper watershed consists of narrow valleys and short, steep canyon reaches, with numerous small tributaries. From Salida to Parkdale, the river flows through a canyon environment with relatively narrow valleys that connect with short, narrow canyon reaches. Downstream of Parkdale, the river enters the Royal Gorge, a deeply incised, narrow bedrock canyon. At Cañon City, the topography and river corridor change from steep canyons and narrow valleys to rolling terrain and an ever-widening river valley. Elevations in the watershed range from 4400 m (Mt. Elbert) to about 1430 m, some of the highest relief in the conterminous United States. Cañon City marks the transition between a high elevation, steep gradient watershed where the mean basin slope is 20.5% to a lower elevation, lower gradient watershed where the mean slope is 9.9%.
3
During the Pleistocene, five glaciations and interstades shaped the physiography of the Rocky Mountains; two minor Holocene advances have also been reported (Richmond, 1965). Pre-Bull Lake, Bull Lake, and Pinedale outwash terraces have been identified and are the dominant landforms in the Upper Arkansas River valley upstream of the Royal Gorge. Fluvial processes in the Holocene are for the most part incapable of reshaping the Pleistocene landforms in this area, leaving the majority of valleys and canyons filled with glacial outwash, as these locations are upstream of flash-flood zones (e.g., Jarrett, 1990). Downstream of Cañon City, glacial outwash deposits disappear, and in their place, Tertiary and Pleistocene alluvial deposits associated with the erosion of the Rocky Mountains overlie Cretaceous sedimentary bedrock (e.g., Scott, 1972a,b; Taylor et al., 1975a,b). Early research describes the formation of Tertiary and Quaternary landforms that dominate the physiography of the Upper Arkansas River basin. Behre (1933), Powers (1933, 1935), and Powers and Behre (1934) provides a geologic history of Tertiary uplift and erosion and of Quaternary glaciation and glaciofluvial processes. Powers (1935) described seven fluvial terraces, which range in age from preglacial to post-glacial. The oldest terraces (Nos. 7 and 6) are preglacial in age; terraces 5 to 3 are pre-Wisconsin, or Bull Lake, in age. Terrace No. 2 can be traced to moraines associated with the Wisconsin (Pinedale) glaciation. Terrace No. 1 is post-glacial in age and is approximately 6 m above the modern Arkansas River. 2.2. Extreme floods in the Arkansas River basin and region Streamflow data from the U.S. Geological Survey and Colorado Division of Water Resources, including peak and daily mean discharge estimates, are used to understand and quantify flood magnitude, types, and seasons. Historical information that includes known floods
Fig. 2. Upper Arkansas River basin study area. The portion of the watershed below 2300 m is shaded.
4
J.F. England Jr. et al. / Geomorphology 124 (2010) 1–16
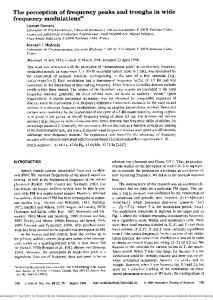
prior to establishment of gaging stations and settlement periods is presented. This study focuses on using data from 16 gaging stations upstream from Pueblo Dam (Fig. 2). Long-term gages started in the late 1800s, including Granite (1895), Salida (1895), Cañon City (1888), and Pueblo (1885) (Crowfoot et al., 2004). In concert with paleoflood data, we obtain a physically-based understanding of extreme flood hydrology for extreme flood frequency. We explored flood seasonality within the upper Arkansas River basin using annual peak-flow and maximum mean daily flow data from gaging stations at Granite, Salida, Wellsville, Parkdale, Cañon City, and Pueblo. Runoff seasonality is very strong in the upper watershed from Granite to Parkdale and is limited to May through August (Table 1). Peak-flow monthly distributions are unimodal, peak strongly in June, and are nearly identical upstream of Cañon City. At Cañon City and Pueblo, the distributions clearly change by having more spread and indicate the influence of the general storm rainfallrunoff process. The peak distribution for Pueblo is nearly uniform for June through August (Table 1). In addition to seasonality, the largest floods at each site are examined and classified according to type (e.g., Elliott et al., 1982). At Granite, Salida, Wellsville, and Parkdale, the largest floods are from snowmelt. The largest snowmelt peaks occurred in June 1957 and June 1995. Peak flows downstream of Parkdale are from rainfall-dominant general storms in May and June, and local thunderstorms in July and August. The largest floods were on 2 August 1921 at Cañon City and on 3 June 1921 at Pueblo. The June 1921 flood (Follansbee and Jones, 1922) is the largest on the Arkansas River upstream of Pueblo and is one of the largest in the history of Colorado. These analyses indicate that snowmelt runoff is the dominant flood runoff mechanism in the watershed upstream of Parkdale and that peak flows downstream of Parkdale are dominated by rainfall runoff. Peak-flow and maximum mean daily flow crosscorrelations and regional flood envelope curves provide further confirmation of these runoff mechanisms (England et al., 2006). Maximum unit peak flood discharges within the Arkansas River basin and region dramatically decrease with elevation (Fig. 3). This nonlinear relationship shows the change in process from rainfall runoff at lower elevations to snowmelt runoff at higher elevations in the region. The highest unit discharges are associated with very high rainfall runoff from lower elevation watersheds less than about 130 km2; most of these are associated with the July 1976 Big Thompson flood (Fig. 3, points 1–5) in the South Platte. Two of the largest events that occurred within the Arkansas watershed upstream from Pueblo are Orman's Gulch (point 6) and the Arkansas tributary near Parkdale (point 7), but they do not define the unit discharge envelope curve (Fig. 3). The envelope curve supports Follansbee and Sawyer's (1948) and Jarrett's (1990) views that floods decrease with elevation in the Colorado Front Range. Jarrett (1987) suggested a 2300 m elevation limit to flash flooding in the Colorado Front Range, including the Arkansas watershed. This envelope curve, updated with 25 more years of data (including the July 1997 Fort Collins flood), supports Jarret's hypothesis. Orographics and topography appear to play a significant role in extreme flood generation in the Colorado Front Range, and record flood peaks have not been observed upstream of Pueblo other than the June 1921 flood. Peak flows in the Arkansas
Fig. 3. Maximum unit peak discharge data and elevation envelope curve for observations within the Arkansas and South Platte River basins, Colorado.
watershed upstream of Pueblo are lower than the South Platte and lower Arkansas peaks (Fig. 3). Recent Colorado extreme floods, including the devastating July 1997 Fort Collins flood (Ogden et al., 2000), have occurred at lower elevations and do not define or exceed the envelope. We gathered historical information within the Arkansas River basin for use in flood frequency analysis. This information is useful in flood frequency to extend the length of the gage record and to provide estimates of extreme floods that may have occurred before the establishment of gaging stations. Historical information generally consists of diaries, written accounts of settlements, and anecdotal accounts that may document historical floods and periods without extreme weather or floods (Baker, 1987; England et al., 2003a). The sources used to document the time of human settlement, travel routes, population distribution, and observations included: Campbell (1922), Baker and Hafen (1927), Hafen (1948), and Osterwald (2003). Historical flood information and data are obtained from Follansbee and Jones (1922), Munn and Savage (1922), Follansbee and Sawyer (1948), Patterson (1964), and Crowfoot et al. (2004). Based on these sources, we estimate the historical period and the historical flood years at each site (Table 2). Peak-flow time series are extended from 48 to 89 years at the four sites with the addition of historical data and include three large floods at Pueblo prior to the gage record. 3. Paleoflood investigations
Table 1 Monthly frequencies of annual peak flows at four sites in the Upper Arkansas River basin. Site
No. Observations
April
May
June
July
August
September
Adobe Park (Salida) Loma Linda (Wellsville) Parkdale Pueblo State Park
77
0.00
0.16
0.58
0.17
0.09
0.00
41
0.00
0.19
0.60
0.14
0.07
0.00
48 81
0.00 0.00
0.10 0.09
0.69 0.28
0.17 0.27
0.04 0.33
0.00 0.02
3.1. Site selection Initial paleoflood study reconnaissance in the Upper Arkansas River basin upstream of Pueblo was conducted from 26–30 July 2004. Results of this reconnaissance indicated that (i) Holocene terraces (≥1000 year) along the river are scarce; (ii) strath terraces and bedrock control upstream of Cañon City are common; and (iii) there are major anthropogenic influences along the entire system, including roads, railroads, and mining activity. Four locations for detailed study were selected (Fig. 2): Pueblo State Park, Parkdale, Loma Linda, and
J.F. England Jr. et al. / Geomorphology 124 (2010) 1–16
5
Table 2 Historical information and floods at four sites in the Upper Arkansas River basin. Flood frequency site
Historical record start
Historical period (years)
Historical flood years (outside gage record)
Sources
Pueblo State Park
1859
64
Parkdale Loma Linda Adobe Park
1868 1880 1880
89 84 48
(1864), (1893), (1894), June 1921 (August 1921) – 1957
Campbell (1922), Follansbee and Jones (1922), Baker and Hafen (1927), Hafen (1948) Campbell (1922); Baker and Hafen (1927); Hafen (1948) Campbell (1922), Baker and Hafen (1927) Campbell (1922), (Baker and Hafen, 1927), Crowfoot et al. (2004)
Adobe Park. No prior paleoflood studies and few Quaternary-specific studies have been conducted within the Upper Arkansas River basin. Site selection was based on several factors: geographic location, preservation of Pleistocene and Holocene terrace deposits, channel hydraulic characteristics, and extent of human impact. The geographic location of sites was important to quantify the magnitude of floods in different parts of the basin in order to explore the hypothesis that paleoflood magnitudes should reflect behavior similar to gaging records. Paleofloods and nonexceedance bounds in the higher elevations upstream of Parkdale would be smaller in magnitude, reflecting snowmelt runoff. In the lower basin, paleofloods and nonexceedance bounds would be larger in magnitude, reflecting rainfall runoff. The Loma Linda and Adobe Park sites were selected for snowmelt runoff; the Pueblo State Park and Parkdale sites were selected to represent downstream rainfall-dominant floods (Fig. 2). The results and discussion are focused on Pueblo and Loma Linda as the primary sites; these represent one snowmelt and one rainfall site. Preserved Holocene and Pleistocene terraces provide information for paleohydrologic bounds and were critical components in each study reach. Downstream of Cañon City, the most extensive surfaces along the Arkansas River are late Holocene terraces; while upstream of Cañon City, Pleistocene glacial outwash terraces are the dominant features along the main channel. Holocene alluvium in the upper basin is generally limited and is preserved principally as narrow floodplain surfaces. The channel geometry at each site was important for hydraulic modeling. Stratigraphic sites were located near the upstream end or in the middle of the modeling reach to reduce downstream boundary effects in the model and potentially reduce peak discharge uncertainty. Reaches were selected with minimal human disturbance or interference by infrastructure such as railroads, highways, and bridges. 3.2. Paleoflood methods Detailed stratigraphic investigations were completed at the four sites during the Fall of 2004. At each of the sites, soils were described and investigated to determine that the geomorphic surface was stable. Charcoal samples were collected to estimate ages of the terrace deposits. The four reaches were surveyed and peak discharges estimated using the one-dimensional HEC-RAS flow model. Peak discharge estimates and radiocarbon ages were then used to develop estimates for paleoflood nonexceedance bounds following the approach described by Levish (2002). Individual paleofloods were identified if they were apparent in the stratigraphy. Soil and stratigraphic data were gathered at each site in natural stream bank exposures or in hand-dug pits. Soil properties and sedimentary stratigraphy were described following methods outlined in Boggs (1995) and Birkeland (1999). Charcoal collected for age control was separated from sediment by floatation and identified to genus level (Puseman, 2004). This was done in order to select specific charcoal types for subsequent radiocarbon dating, rather than sending some unknown sample. Analysis of bulk samples from some recent studies revealed more than a dozen different types of charcoal as well as roots, burned roots, small mammal bones, various types of mollusk shells, fruits, seeds, or leaves (Levish, 2002). The most reliable ages appear to come from short-lived riparian species or burn horizons. Selected samples were
then submitted for standard AMS radiocarbon analysis, with calibration to calendar years (Stuiver et al., 1998). The resulting ages were then used in conjunction with soil characteristics to interpret the age of the stream terraces and any individual flood deposits preserved in the stratigraphic record. The geomorphology of each study area was mapped based on aerial photo interpretation, field observations, and existing geologic data (Scott, 1972a,b; Van Alstine, 1974; Taylor et al., 1975a,b). The geologic maps compiled for this study show the distribution of Pleistocene and Holocene alluvium, the location of bedrock, HEC-RAS hydraulic model cross sections, and soil pit locations where stratigraphic and age data were collected. The topographic data were collected using a Trimble 5800 GPS system. A Real Time Kinematic (RTK) survey was performed to collect seven to nine cross sections at each of the four sites. After each site survey was completed, the data points were used to develop a surface representation of each site, and cross sections were extracted for use in HEC-RAS flow modeling. Roughness values (Manning's n) were applied separately to each cross section. Uniform values were applied to the channel and left and right floodplains based on field observations and published values (Jarrett, 1985). Roughness values were varied to account for parameter uncertainty and to provide a range of peak flows for subsequent flood frequency analysis. The hydraulic model for each reach was run over a range of flows with varied roughness values to estimate flows that overtopped each surface by up to 1 m. We assumed this depth produced sufficient shear to erode stable surfaces (Levish, 2002), based on the steepness of river channel slopes and site geometry. Ostenaa et al. (1996) estimated that depths as low as 0.3 m were sufficient to produce overbank erosion in steep canyon reaches, similar to those found here. Use of a 2D hydraulic model (e.g. Denlinger et al., 2002) might provide refined shear stress estimates in order to better establish paleohydrologic bound discharges. Time and budget constraints, and lack of good flow model calibration data in the reaches of interest precluded those efforts. Further investigations are warranted in comparing 1D and 2D hydraulic model results and their respective impacts on paleohydrologic bound estimation. Normal depth was used as the downstream boundary condition for each reach. Hydraulic characteristics for the study sites are summarized in Table 3. 3.3. Pueblo State Park site The Pueblo State Park reach is about 2.4 km long and located upstream of Pueblo Dam (Fig. 2). In this reach, the Arkansas River Table 3 Summary of hydraulic characteristics at the four paleoflood sites. Manning n Site
No. of cross sections
Reach length (m)
Reach bed slope (m/m)
Left overbank
Main channel
Right overbank
Pueblo State Park Parkdale Loma Linda Adobe Park
7 8 9 8
2285 710 714 570
0.0030 0.0045 0.0019 0.0052
0.050 0.060 0.050 0.045
0.040 0.045 0.045 0.040
0.040 0.055 0.050 0.045
6
J.F. England Jr. et al. / Geomorphology 124 (2010) 1–16
flows through a 0.8-km-wide canyon incised into Pleistocene outwash gravels and Cretaceous limestones and shales. The Pleistocene gravels mapped in the study reach (Scott, 1972a) include the Rocky Flats alluvium, Slocum alluvium, and Louviers alluvium, which are 91, 37, and 21–24 m above the modern Arkansas River, respectively. These deposits are generally about 6 m thick and form rounded hills in the study reach. They lie unconformably on upper Cretaceous rocks of the Greenhorn Limestone, Carlile Shale, and Niobrara Formation. Holocene alluvium (labeled Qy2 in Fig. 4) in this reach and at other locations along the Colorado Front Range has been identified as Post Piney Creek (Malde, 1955), which is ~ 1500 years old (Scott, 1963). Older Holocene deposits of Piney Creek age (N1500 years) were mapped downstream of this reach before the construction of Pueblo Dam (Scott, 1972b) and are now inundated by the reservoir. Three soil profiles (AR1, AR2, and AR9) were described in the reach (Fig. 4). The soil profiles were each placed on different Holocene units: Qy2, Qy1b, and Qy1a (Fig. 4). Site AR1 (Qy2) is on a low terrace at the downstream end of the Pueblo State Park reach and is composed of silty sand, sandy clay, and gravel with weakly developed soil properties. The surface horizon contains coal fragments and railroad slag and may explain why the A horizon is over-thickened. Three C horizons described from 39 to 100 cm are generally sandy overbank alluvium with clay-rich lenses; the lowermost horizon is a gravelly deposit, which suggests that the base of the profile is former channel alluvium or channel splay deposits. Soils at AR1 are young relative to the AR2 and AR9 soils. Sites AR2 and AR9 are located at the upstream end of the Pueblo State Park study reach at about 3.7 and 5.8 m, respectively, above the active river channel. The sites are situated on a late Holocene rightbank terrace (Qy1a, Qy1b; Fig. 4) that grades to an alluvial fan near the valley margin. Site AR2 is near the riverward margin of the Qy1b terrace and exhibits a soil with a highly bioturbated A horizon and Bk horizon with weak (stage I) calcium carbonate development (Fig. 5). The parent material is fine-grained sandy alluvium, indicating
exclusive deposition by the Arkansas River. Radiocarbon analysis of in situ Juniper charcoal from the Bk horizon yielded a calibrated age of 1740–1550 cal YBP. (Table 4). This suggests that the AR2 soil is approximately 1600 to 1800 years old. Site AR9 is located upslope from AR2 on the north side of an abandoned railroad grade (Fig. 4). The upper 22 cm contains alluvial fan sediments with a 15-cm-thick coarse angular gravel on the surface and a 7-cm-thick gravelly layer of locally derived angular limestone fragments (colluvium) (Fig. 5). Below 29 cm, the soil is composed of main stem sediments with sandy loam and silt loam textures and massive to moderate subangular blocky structure. No individual units representing discrete, individual floods were observed. Rather, the soils indicated stability. Radiocarbon analysis of charcoal recovered from a 56-cm depth yielded an age of 790–680 YBP, which is younger than that at AR2. However, the depths at the two sites are not equivalent. By removing the alluvial fan soils at AR9 (0–22 cm), and accounting for differences in elevation between AR9 and AR2, the younger age at AR9 is approximately at 34 cm, higher in the stratigraphic section than the dated sample at AR2 (Fig. 5). The extent of soil development at both sites confirms this interpretation that the soils are in stratigraphic order. Assuming that soil properties formed at both sites are representative of the age of the deposits, the Bk horizon age at AR2 compared to a slightly weaker formed B horizon age at AR9 is consistent. From the soil development at the two sites, we utilize site AR9 as a nonexceedance bound, with an age of 680 to 790 years. This stable surface represents a 680 to 790-year time period where floods have not been of significant magnitude to overtop and modify the terrace. Soil development properties and age at AR2 are consistent to Post Piney Creek alluvium estimates of about 1500 years (Malde, 1955; Scott, 1963). The Pueblo State Park reach is relatively wide for developing paleoflood nonexceedance bounds because of the potential for shifts in channel position. Comparison of aerial photography between 1937 and 1999 reveals a similar channel position for at least the last
Fig. 4. Surficial geologic map of the Arkansas River in Pueblo State Park reach upstream of Pueblo Dam. River flow is from upper left to lower right. Soil pits AR1, AR2, and AR9 are denoted by white dots.
J.F. England Jr. et al. / Geomorphology 124 (2010) 1–16
7
Fig. 5. Schematic cross section showing the stage of the nonexceedance bound peak discharge of modeled flows and its relationship to geomorphic surfaces and stratigraphic sites in the Pueblo State Park reach. Schematic profiles of soils at sites AR2 and AR9 are shown at right. Sample AR2-3JU collected from the interval 63–78 cm yielded a radiocarbon age of 1750 ± 40 C14 YBP (1740–1550 cal YBP). Sample AR9-1JU collected from 56 cm yielded a radiocarbon age of 830 ± 40 C14 YBP. (790-680 cal YBP). Soils on the Qy1a terrace (AR9) represent a nonexceedance bound.
68 years (England et al., 2006). In addition, the first railroads were completed through this reach in 1872 (Campbell, 1922) and much of the original roadbed is still intact on the landscape. It is also unlikely that the channel has shifted significantly near AR2 and AR9 during the time frame of the nonexceedance bound. Sediment from Red Creek appears to have forced the river to the north side of the valley and has controlled the position of the river for at least the last 1500 years. This idea is supported by the radiocarbon ages (1740– 1550 cal YBP) and the formation of a calcic B horizon, as well as the lack of morphologic evidence for a channel on the south side of the valley at this site. The overtopping discharges at AR1, AR2, and AR9 vary according to their vertical and lateral landscape positions. Site AR1, located on the lowest and youngest alluvium (Qy2; Fig. 4) in the reach, is overtopped by a discharge of ~283 m3/s. Site AR2, while being immediately adjacent to the active channel, is on a slightly higher and older terrace (Qy1b; Fig. 4). The site is located just upstream of a large expansion in valley width associated with an abandoned meander and is overtopped by discharges ranging from about 850 to 1133 m3/s. Site AR9 is located just downslope of an abandoned railroad grade and upslope of AR2 (Fig. 4). The stratigraphy at AR9 indicates that the site is situated at the distal margin of a small alluvial fan that has shed sediment across the back edge of the Qy1a terrace, but may have been truncated or reworked by flow associated with the mainstem Arkansas River. Peak discharges that overtop the site by about 1 m range from ~ 3680 to 4530 m3/s (Fig. 5).
3.4. Parkdale site The Parkdale site is located at the upstream entrance to the Royal Gorge and near the Parkdale gage (Fig. 2). In the study reach, glacial outwash of presumed Pinedale age (Qpo, N10 ka) is exposed in a bank exposure buried underneath Holocene alluvium and colluvium (Fig. 6). The youngest deposits mapped in the study reach include the active channel (Qyc) and the floodplain (Qy2) sediments. Soils were described at three sites (AR3, AR4, and AR5) on a late Holocene terrace along the right bank (Fig. 6). Sites AR3 and AR4 are on the Qy1/Qpo map unit and represent the same soil with different parent material. Both soils exhibit a 20- to 30cm thick loamy sand A horizon with b10% gravel (Fig. 7A). The underlying Bw horizon is about 30 cm thick and has a medium loamy sand texture and subangular blocky structure. Parent material was observed to vary between profiles such that potassium feldspar-rich colluvium is described at AR4 and fine-grained alluvium is described at AR3. The Bk horizon, which underlies the Bw horizon, is a loamy sand with subangular blocky structure. Two radiocarbon ages of 1230 ± 40 C14 YBP and 1210 ± 40 C14 YBP were determined from in situ Pinus charcoal (Table 4) collected from the Bw horizon. Calibration of these ages indicates that this soil is about 1100 to 1300 years old. A paleoflood nonexceedance bound discharge estimate for this surface ranged from 680 to 965 m3/s (Fig. 8). At the downstream end of the Qy1/Qpo deposit, a historical flood deposit (AR5) is inset against this stratigraphy on the lee side of a
Table 4 Summary of radiocarbon ages at the four paleoflood sites. Site
Sample no. (lab no.)
Soil horizon (depth, cm) Type of material
Sample weight (g) Radiocarbon age (C14 age YBP) Calibrated age (cal age YBP)
Pueblo State Park Pueblo State Park Parkdale Parkdale Loma Linda Loma Linda Adobe Park
AR9-1-JU (Beta-198216) AR2-3-JU (Beta-197337) AR3-1-PI (Beta-197338) AR3-2-PI (Beta-197339) AR7-1-PI (Beta-197340) AR7-2-PI (Beta-197341) AR8-1-PI (Beta-197342)
2B3 (56) Bk (63–78) Bw (48) Bw (30–54) AB (20–52) Bk (52–80) B2 (42)
0.125 0.004 0.006 0.045 0.038 0.005 0.028
Juniperius charcoal Juniperius charcoal Pinus charcoal Pinus charcoal Pinus charcoal Pinus charcoal Pinus charcoal
830 ± 40 1750 ± 40 1230 ± 40 1210 ± 40 830 ± 40 2100 ± 40 400 ± 40
790–680 1740–1550 1260–1060 1250–1050 790–680 2150–1980 520–420, 390–320
8
J.F. England Jr. et al. / Geomorphology 124 (2010) 1–16
Fig. 6. Surficial geologic map showing stratigrapic sites AR3, AR4, and AR5 and approximate location of HEC-RAS cross sections 3 through 8 in the Parkdale reach. Cross sections 1–2 at the downstream end of the reach are not shown. River flow is from the top to bottom of the figure.
large boulder that created a suitable setting for the deposition of flood sediment. Below an irregular slope of wind-blown sand lies a 5-cm thick dark brown to black bed, which appears to be a concentration of mafic minerals deposited either by the flood or placer mining activity (Fig. 7B). Below this horizon are three sedimentary beds: a 9-cm thick pebble lens with well sorted and well-rounded clasts less than 3 cm in diameter, a 6-cm thick silt bed and a 45-cm thick cross-bedded and loosely consolidated medium sand. A piece of mesh wire was recovered from a cross-bedded sand unit, indicating that the entire sequence was deposited historically (Fig. 7B). The lack of any recognizable soil development on the flood deposit is also consistent with the interpretation that the deposit is historical. The flood deposit at site AR5 is shallowly overtopped by flows between 510 and 625 m3/s. The deposit is consistent with the largest historical peak flow from August 1921 (Frankenfield, 1921; Crowfoot et al., 2004). 3.5. Loma Linda site The Loma Linda reach is located in a narrow canyon reach of the Arkansas River, ~2 km downstream of Cotopaxi (Fig. 2). This site was chosen for its intermediate location in the basin, its preservation of Holocene alluvium, and minimal human impacts within the modeling reach.
The canyon at the site trends NE–SW and is cut into the Precambrian granodiorite bedrock mapped by Taylor et al. (1975a,b) (Xgd in Fig. 9). Only isolated Holocene deposits are preserved in this reach; which is typical of observations in other narrow reaches in the Upper Arkansas River basin. Glacial outwash deposits, primarily of Pinedale age (Qpo in Fig. 9), are preserved along the reach and are composed of metamorphic and igneous boulders, cobbles, pebbles, and sand (Taylor et al., 1975a,b). Bull Lake glacial outwash deposits (Qbo in Fig. 9) as well as alluvial fan deposits at the mouths of small tributaries (Qf in Fig. 9) form a minor component of the surficial deposits in the reach. Through the modeled reach, the Arkansas River flows in a narrow channel with deep pools and large fluvially sculpted boulders. The Pinedale outwash terrace on the right bank is about 9 m high and forms a nonexceedance bound at this site that is about 10,000 to 14,000 years old. Coupled with resistant bedrock on the left bank, it has confined the river to its present position, limiting any significant lateral movement. A soil profile described at site AR6 on the Pinedale outwash terrace exhibits a 10-cm-thick A horizon formed on sandy parent material. A 15-cm-thick weakly developed cambic horizon (Bw) is reddened and contains minor amounts of rounded gravel compared to the overlying A horizon. A juvenile argillic horizon (Btj) (Birkeland, 1999) at the base of the soil pit consists of poorly sorted, well-rounded gravel and moderately developed distinct clay coatings on the gravel. The Btj horizon marks a distinct change in parent material and depositional processes. While this horizon is distinctly fluvial in origin, the lack of gravel and predominance of sand in the uppermost horizons suggest that they are composed mostly of loess, formed as wind-blown sediment was deposited on the surface and incorporated into the soil. A Holocene deposit at site AR7 is inset at the base of the Pinedale outwash terrace at the downstream end of the reach (cross section 4, Fig. 9). The soil consists of a 20-cm-thick A horizon with a single grain structure that grades to granular structure with depth (Fig. 10). This horizon overlies an AB horizon that is transitional having properties of both A and B horizons. Its color is similar to that of the A horizon, which is a dark brown, but its structure resembles that of the underlying Bk horizons. Filamentous carbonate is formed on the undersides of clasts and in pores at the base of the horizon. The Bk and Bk2 horizons exhibit an increase in soil structure development as well as a whitened matrix and stronger effervescence, indicating greater carbonate accumulation. Radiocarbon dates from Pinus charcoal in the AB and Bk horizons are 830 ± 40 C14 YBP and 2100 ± 40 C14 YBP, respectively, with a calibrated age of 700 to 2200 cal YBP. The soil at site AR7 appears to be continuous, with no apparent breaks in soil formation or sediment deposition. Continuous soil development indicates overall stability, and the lack of evidence for individual floods within the sequence establishes the AR7 geomorphic surface as a nonexceedance bound over the last 700 to 2200 years. Peak discharges required to overtop site AR6 range from 1410 to 1700 m3/s; site AR7 is overtopped by discharges ranging from 370 to 510 m3/s (Fig. 10). 3.6. Adobe Park site The Adobe Park reach is located upstream of Salida (Fig. 2) and was chosen based on the preservation of older and higher Holocene and Pleistocene terraces, its suitability for hydraulic modeling, and access. Nine different aged Pleistocene units (Van Alstine, 1974) are comprised of alluvium deposited during various glaciations and interstades. The four highest and oldest units include pediments, or erosional surfaces, that overlie the Tertiary Dry Union Formation (bedrock) in some areas. Pinedale and Bull Lake alluvium form the five youngest outwash terraces (Fig. 11). Two Holocene deposits (labeled Qy2 and Qy1) that form the modern floodplain and low terraces as well as the active channel (Qyc) of the Arkansas River were mapped in the reach. Typically, the terrace surfaces formed on these deposits have irregular topography
J.F. England Jr. et al. / Geomorphology 124 (2010) 1–16
9
Fig. 7. Parkdale soil exposures at sites AR3 and AR5. (A) Sample AR3-1PI was collected from 48 cm and yielded a radiocarbon age of 1230 ± 40 C14 YBP (1260–1060 cal YBP). Sample AR3-2PI was collected from the interval 30-54 cm and yielded a radiocarbon age of 1210 ± 40 C14 YBP (1250–1050 cal YBP). (B) Photograph at site AR5 showing the historical flood deposit. Mesh wire was recovered from the cross-bedded sand, indicating that the deposit to a depth of 60 cm is composed of sediment that is historical. Colored increments on the measuring tape are 10 cm long. Sites AR3 and AR4 were stable terraces used to establish a nonexceedance bound. Site AR5 included one historic flood.
and are ~1 to 2 m above the active channel. Exposures of soils formed on the Qy2 deposits show that they are weakly developed and exhibit primary depositional features. The Qy1 deposits are composed of sandy river alluvium and the soil formed on these deposits include a 10-cm thick A horizon and several underlying B horizons (Fig. 12). The B horizons at site AR8 were distinguished from each other primarily on the basis of parent material changes (sand to sandy gravel). Below a depth of 42 cm, the soil becomes clay rich and exhibits filaments and nodules of an unidentified salt (not calcium carbonate). The A and B horizons represent a single soil on a stable terrace. A radiocarbon sample from the base of the 2B horizon yielded a radiocarbon age of
400 ± 40 C14 YBP, with a calibrated age of 400 to 600 cal YBP. Peak discharges for a nonexceedance bound at site AR8 range from about 480 to 765 m3/s. 3.7. Paleoflood data discussion and summary Quaternary deposits along the Upper Arkansas River consist of predominantly Pleistocene glacial deposits upstream of Parkdale and predominantly Holocene alluvial deposits downstream of Cañon City. Upstream of Parkdale, the floodplain occupies a narrow space between Pleistocene gravelly outwash terraces, leaving little room for the
Fig. 8. Schematic cross section showing the stage of the nonexceedance bound peak discharge of modeled flows and its relationship to geomorphic surfaces and stratigraphic sites AR3 and AR4 in the Parkdale reach.
10
J.F. England Jr. et al. / Geomorphology 124 (2010) 1–16
Fig. 9. Surficial geologic map of the Loma Linda reach showing stratigraphic sites and the approximate location of HEC-RAS cross sections. River flow is from the lower left to the upper right of the photograph.
preservation of Holocene deposits. Downstream of Cañon City, Holocene alluvium is common and is accommodated in a wider floodplain. In addition to the physiographic and geologic differences, flood magnitude increases sharply from the Loma Linda site to the Pueblo State Park site, based on streamflow records and paleoflood nonexceedance bounds. For instance, for a similar age surface and accounting for differences in basin area, floods at Pueblo State Park are substantially larger than floods at Loma Linda. Based strictly on the paleoflood data, this suggests that there is a transition to snowmelt-dominant floods within the basin upstream of Cañon City. Paleoflood nonexceedance bounds were developed at the four study sites using age estimates derived from
radiocarbon analysis (Table 4) and peak discharge estimates from HECRAS hydraulic modeling (Table 5). One paleoflood (historic flood) was estimated at the Parkdale site (Table 5). At Pueblo State Park, the estimated peak discharge for the June 1921 flood (about 2910 m3/s) marginally inundates site AR9. Little evidence of historical flooding was observed. Angular rock fragments on the surface at site AR9 and ~20 cm of alluvium in the upper part of the soil profile were interpreted as being deposits derived from an upslope alluvial fan. The site has been effectively isolated from alluvial fan deposition since the 1870s railroad grade construction. In the soil profile, the parent material on which the 3B1 horizon is formed,
Fig. 10. Schematic cross section showing the stages of the nonexceedance bound peak discharges of modeled flows and their relationship to geomorphic surfaces and stratigraphic sites in the Loma Linda reach. Schematic profile of soils at site AR7 is shown at right. Sample AR7-1PI collected from the interval 30–54 cm yielded a radiocarbon age of 830 ± 40 C14 YBP (790–680 cal YBP). Sample AR7-2PI collected from the interval 52–80 cm yielded a radiocarbon age of 2100 ± 40 C14 YBP (2150–1980 cal YBP). Soils on the Qy1 terrace (AR7) represent a nonexceedance bound.
J.F. England Jr. et al. / Geomorphology 124 (2010) 1–16
11
Fig. 11. Surficial geologic map of the Adobe Park reach showing the location of stratigraphic site AR8 and the approximate location of HEC-RAS cross sections. River flow is from left to right.
interpreted to be flood sediment, would represent the last time a large flood inundated the site. A radiocarbon age on charcoal recovered from these sediments (3B3 horizon) indicates that the overlying soil is at least 730–840 years old. Based on these data, apparently there has not been a flood larger than 4250 m3/s in the last 730 to 840 years (Table 5). In the Parkdale reach, a peak discharge for both a nonexceedance bound and a paleoflood was developed. The paleoflood represented by the flood deposit at site AR5 is considered to be historical because of the incorporated wire mesh recovered from the deposit. The age of the flood can be bracketed by documentation of the historical development since the late 1860s (Table 2) and by the gage records at Parkdale (1946) and Cañon City (1888). While this flood age cannot be stated with certainty, the historic flood deposit probably resulted from the August 1921 flood recorded at the Cañon City gage. Peak discharge estimates at the Parkdale site and the Cañon City gage are
very similar and are highly correlated (England et al., 2006). A nonexceedance bound developed for sites AR3 and AR4 indicates that 680–960 m3/s has not been exceeded in 1100–1300 years (Table 5). This estimate is derived from modeled peak discharge estimates required to inundate the Qy1 terrace surface and on two radiocarbon ages from the soil profile at site AR3 (Table 4). Estimates of nonexceedance bounds were developed in the Loma Linda reach on Late Holocene and Late Pleistocene deposits. The Pleistocene deposit is mapped as a Pinedale outwash terrace (Taylor et al., 1975a) and forms the basis for a nonexceedance bound peak discharge estimate of 1410–1700 m3/s with an age range of 10,000– 14,000 years. Radiocarbon ages derived from a stable soil formed on a small Holocene terrace (AR7) inset into the Pleistocene terrace indicate that this soil is about 700 to 2200 years old. Modeled peak discharges of 370–510 m3/s overtopped the terrace and define the peak discharge range for the nonexceedance bound (Table 5). Within
Fig. 12. Schematic cross section showing the stage of the nonexceedance bound peak discharge of modeled flows and its relationship to geomorphic surfaces and stratigraphic site AR8 in the Adobe Park reach. Schematic profile of soils at site AR8 is shown at right. Sample AR8-1PI collected from 42 cm yielded a radiocarbon age of 400 ± 40 C14 YBP (520–320 cal YBP). Soils on the Qy1 terrace (AR8) represent a nonexceedance bound.
12
J.F. England Jr. et al. / Geomorphology 124 (2010) 1–16
Table 5 Summary of paleoflood nonexceedance bounds and paleofloods, Upper Arkansas River. Location
Stratigraphic site
Type of estimate
Age range (years)
Peak discharge range (m3/s)
Preferred peak discharge (m3/s)
Pueblo State Park Parkdale Parkdale Loma Linda Loma Linda Adobe Park
AR9 AR5 AR3, AR4 AR7 AR6 AR8
nonexceedance paleoflood nonexceedance nonexceedance nonexceedance nonexceedance
730–840 historical (post 1870 ca. 1921) 1100–1300 700–2200 10,000–14,000 400–600
3680–4530 510–620 680–960 370–510 1410–1700 480–765
4250 570 850 400 1410 570
bound bound bound bound bound
this section, the stratigraphy demonstrates a lack of evidence of individual paleofloods within this time frame, that could have exceeded the modern terrace by more than 1 m. In the Adobe Park reach, a late Holocene terrace (Qy1) at site AR8 was determined to be between 400 and 600 years old on the basis of soil development and radiocarbon analysis of charcoal recovered (at 42 cm depth) from a soil formed on the terrace. This stable soil and age range is the basis for a nonexceedance bound, in which modeled peak discharges of 480–765 m3/s overtop the terrace (Table 5). A comparison of the nonexceedance bound peak discharge data between the upper basin sites suggests that the Adobe Park nonexceedance estimate is anomalous. While the basin area at Adobe Park is about half of that at Parkdale, and the age for the nonexceedance bound is also about half as old, the peak discharge estimate is roughly equal. This potentially indicates that paleofloods in the upper part of the basin have been somewhat larger than at downstream sites. However, closer analysis of the paleoflood data and the geomorphic setting of each of the upper basin sites suggest that the apparent anomaly falls within expected data uncertainty. At Loma Linda, the lower limit of the age range is about 100 years older than at Adobe Park, and the nonexceedance bound peak discharge estimates overlap with a 20% larger basin area. Relative to the Parkdale site, while the basin area and the age range are about double that of the Adobe Park site, the minimum estimate for the nonexceedance bound peak discharge is also half of the maximum estimate at the Parkdale site. The most important factor to consider in making nonexceedance bound comparisons between the sites is the geomorphic setting. Both Parkdale and Loma Linda are located in narrow reaches where the preservation of Holocene deposits is relatively rare compared to much more extensive late Pleistocene deposits present at each site. In addition, the channel geometry at both of these sites is relatively confined, so the estimates of peak discharge in the hydraulic model are probably more precise, and more relevant to the modern channel geometry. The geomorphic setting at both of these sites is considered near ideal for making paleoflood nonexceedance bound estimates for this reason. In contrast, the Adobe Park site is situated in a wide, lower relief valley than the other downstream sites and the channel geometry is not as well constrained. 4. Flood frequency 4.1. Flood frequency methods Peak-flow frequency estimates were made at each of the four paleoflood sites with gage, historical, and paleoflood data. Data-based peak discharge probabilities were estimated directly using a threshold-exceedance plotting position (Stedinger et al., 1993), including historical and paleoflood data. The data were assumed to follow a logPearson Type III (LP-III) distribution. The method of moments was used to estimate the LP-III parameters for peak discharge estimates using the Expected Moments Algorithm (Cohn et al., 1997). EMA was designed to incorporate many different types of systematic, historical, and paleoflood data into flood frequency analysis with the LP-III distribution (England et al., 2003a). Confidence intervals were estimated using the approach in Cohn et al. (2001).
A regional frequency analysis was conducted for the four sites using the index flood method (Stedinger et al., 1993; Hosking and Wallis, 1997). The regional frequency analysis was conducted to determine if the estimated frequency curve for the Arkansas River at Pueblo was similar to frequency curves from the other three sites. Similarity in the frequency curve at Pueblo, to those from other sites, would provide additional confidence in estimating extreme flood probabilities at Pueblo Dam. Differences between the frequency curves could clearly highlight mixed-population flood effects within the basin. As in Smith (1989), the peak discharge frequency curve at each site was made dimensionless using the at-site 0.10 exceedance probability. 4.2. Flood frequency results and discussion Peak discharge probability estimates were made at four paleoflood sites on the Arkansas River at Pueblo State Park, Parkdale, Loma Linda, and Adobe Park (Fig. 2). We focus on the Pueblo State Park site flood frequency and regional results here; flood frequency results for other locations are presented in England et al. (2006). Peak discharge estimates on the Arkansas River at Pueblo State Park are combined from gaging stations at Portland, near Portland, and near Pueblo in order to gain a complete record of all large floods that exceeded ~ 283 m3/s for the period of record. The total combined gage record length, excluding historical data, is 110 years (1895– 2004) (Fig. 13). Patterson (1964) indicates that the largest peak discharge estimates from these gages were unaffected by upstream regulation. Reviews of available historical information (Follansbee and Jones, 1922; Munn and Savage, 1922; Follansbee and Sawyer, 1948) indicated that historical flood information was available at the site for frequency analysis. The historical record was estimated to begin in 1859, resulting in a 146-year period (1859–2004) (Table 2). Three historical floods were included: June 1864, July 1893, and May 1894. The magnitudes of these floods were large relative to the floods in the gaging record; estimates within a range were based on Follansbee and Sawyer (1948) and included in the flood frequency analysis. These estimates have relatively large uncertainties as compared to the smaller floods in the gage record. Peak discharge, historical flood, and nonexceedance bound data synthesis for flood frequency show that these historical floods are the largest in the record and combined with the paleoflood data result in a substantially longer time series (Fig. 13). The flood frequency results (Fig. 14) indicated that the LP-III model fits the bulk of the data well, including most of the large floods, but underfits the largest flood (June 1921) because of the paleoflood data influence. The paleoflood nonexceedance bound data at Pueblo State Park increases the peak discharge record length substantially to about 840 years and has an effect on the upper end of the extrapolated frequency curve principally by reducing the skewness coefficient. One can observe the large positive skew and relatively steep transition between snowmelt-dominant floods to rainfall-dominant floods greater than about 283 m3/s. These large rainfall floods are responsible for the shape of the upper portion of the frequency curve. The return period of the largest flood on record (June 1921) is about 270 years from the exceedance-based plotting position and about
J.F. England Jr. et al. / Geomorphology 124 (2010) 1–16
13
Fig. 13. Peak discharge, historical, and paleoflood estimates, Arkansas River at Pueblo State Park. A scale break is used to separate the gage and historical data from the longer paleoflood record. Arrows on the 1864, 1893, 1894, and 1921 floods indicate floods in a range.
1600 years from the LP-III model. Based on significant extrapolation of the LP-III model and 90% confidence interval (Fig. 14), the spillway design outflow capacity for Pueblo Dam (5400 m3/s) has an estimated return period of 13,000 years, and a return period estimate for the
volume-critical spillway design inflow peak (7650 m3/s) is about 42,000 years. Dimensionless peak discharge frequency curves at the four sites show distinct differences between the locations (Fig. 15). The lower-basin
Fig. 14. Peak discharge frequency curve, Arkansas River at Pueblo State Park, including gage, historical, and paleoflood data. Peak discharge estimates from the gage are shown as open squares; vertical bars represent estimated data uncertainty for some of the largest floods. Paleoflood nonexceedance bound shown as a grey box.
14
J.F. England Jr. et al. / Geomorphology 124 (2010) 1–16
Fig. 15. Dimensionless peak discharge frequency curves for the four sites within the Arkansas River basin. Each curve is indexed by the at-site 10-year model estimate; peak flows that exceed the index are shown with paleoflood nonexceedance bounds.
frequency curves (Pueblo and Parkdale) clearly reflect extreme rainfall-runoff and are much steeper than upstream sites (Loma Linda and Adobe Park). The flood runoff extreme peak-flow magnitudes at Pueblo are substantially larger than at upstream snowmelt locations within the same time period, giving a much steeper frequency curve. The Parkdale frequency curve is approximately similar in shape to Pueblo for flows greater than about the 10-year peak. This suggests a separation in flood process in the record; the upper end of the Parkdale frequency curve behaves similarly to Pueblo but is not as steep. We infer from this that there is a transition in the peak-flow frequency behavior between Pueblo and Loma Linda; storms that affect Pueblo and cause extreme floods do not cause peaks as large at Parkdale. The frequency curves for the downstream locations are clearly different for the most extreme floods; they have a much steeper shape that is primarily determined by the skewness coefficient. The frequency curve shapes and slopes of the upper basin Adobe Park and Loma Linda sites are very similar and reflect snowmelt runoff. They differ from the two downstream locations because the historical and paleoflood data do not show evidence of extreme floods substantially larger than the snowmelt floods recorded in the gage records. The results have important hydrologic risk implications for dam safety, suggesting that the upper basin does not contribute substantially to extreme flood peaks at Pueblo Dam (England et al., 2006). 5. Conclusions The overall objective of this work was to develop an understanding of extreme floods for estimating the flood hazard at Pueblo Dam, Colorado. Paleoflood data were a crucial component to meeting this objective. We relied principally on paleoflood nonexceedance information derived from narrow, bedrock-controlled, canyon reaches within Upper Arkansas River basin. Data were obtained based on the position in the basin relative to the Royal Gorge, where the river transitions from steep canyons and narrow valleys with
snowmelt-dominant floods, to rolling terrain and a wider river corridor with rainfall-dominant floods. Narrow, bedrock canyon reaches upstream of the Royal Gorge provided strong constraints on paleostages and discharge estimates. Flood hydrology investigations within the 12,000 km2 Upper Arkansas River basin showed that runoff seasonality was very strong in the upper watershed from Granite to Parkdale and that the largest floods resulted from snowmelt upstream of the Royal Gorge. Peakflow monthly distributions were unimodal with a June peak. Downstream of Parkdale, the largest floods were from rainfalldominant general storms, such as the record June 1921 flood, and local thunderstorms. Maximum unit peak discharges within the basin and region dramatically decreased with elevation and were associated with very high rainfall runoff from lower elevation watersheds less than about 130 km2. Historical data extended peak-flow records from 48 to 89 years at four sites and included three large floods at Pueblo prior to the gage record. Paleoflood investigations were made at Adobe Park, Loma Linda, Parkdale, and Pueblo State Park to characterize paleofloods and nonexceedance bounds. Nine soil/stratigraphic descriptions and seven radiocarbon dates of key deposits were used in conjunction with geomorphic mapping and HEC-RAS flow modeling to determine age estimates of each soil and peak discharges required to overtop the surfaces. Nonexceedance bounds for similar age surfaces increased in the downstream direction and change markedly between Loma Linda and Pueblo State Park from ~ 400 m3/s to 4250 m3/s for Holocene alluvium between the ages of about 700 and 2200 years. The paleoflood data supported the upper basin snowmelt runoff and the lower-basin (Parkdale and downstream) rainfall-runoff extreme flood mechanisms. At Pueblo State Park, the paleoflood nonexceedance bound suggested that floods slightly larger in magnitude than the June 1921 flood have not been experienced in the past 800 years. Flood frequency analysis was conducted using gage, historical, and paleoflood data at the four paleoflood study sites. Paleoflood nonexceedance bounds spanned 550 to 10,000 years within the
J.F. England Jr. et al. / Geomorphology 124 (2010) 1–16
watershed and provided substantially longer record lengths for frequency analysis. Peak flows at Pueblo and Parkdale reflected extreme floods from rainfall that were relatively much larger than at the two upstream locations. Upstream snowmelt sites had relatively flat frequency curves; frequency curves at the lower sites had much steeper shapes. From these frequency curves, return periods for spillway design flood peaks at Pueblo Dam were N10,000 years. Acknowledgements This study was funded by the Dam Safety Office, Bureau of Reclamation, Denver. We thank the anonymous reviewers for comments that helped us clarify some important points in the paper. References Baker, V.R., 1987. Paleoflood hydrology and extraordinary flood events. J. Hydrol. 96, 79–99. Baker, J.H., Hafen, L.R., 1927. History of Colorado Volume II. Linderman Co., Denver, CO, pp. 429–867. Baker, V.R., Kochel, R.C., Patton, P.C. (Eds.), 1988. Flood Geomorphology. John Wiley and Sons, New York. 503 pp. Behre Jr., C.H., 1933. Physiographic history of the Upper Arkansas and Eagle Rivers, Colorado. J. Geol. 41 (8), 785–814. Birkeland, P.W., 1999. Soils and Geomorphology. Oxford University Press, New York. 430 pp. Blainey, J.B., Webb, R.H., Moss, M.E., Baker, V.R., 2002. Bias and information content of paleoflood data in flood-frequency analysis. In: House, P.K., Webb, R.H., Baker, V.R., Levish, D.R. (Eds.), Ancient Floods, Modern Hazards: Principles and Applications of Paleoflood Hydrology. : Water Sciences and Application, vol. 5. American Geophysical Union, Washington DC, pp. 161–174. Boggs Jr., S., 1995. Principles of Sedimentology and Stratigraphy. Prentice Hall, Englewood Cliffs, NJ. 774 pp. Brooks, G.R., Lawrence, D.E., 1999. The drainage of the Lake Ha! Ha! Reservoir and downstream geomorphic impacts along Ha! Ha! River, Saguenay area, Quebec, Canada. Geomorphology 28, 141–168. Bureau of Reclamation, 2002. Flood Hazard Analysis — Folsom Dam, Central Valley Project, California. Bureau of Reclamation, Denver, CO. 128 pp. Campbell, M.R., 1922. Guidebook of the western United States, Part E. The Denver and Rio Grande Western Route: U.S. Geological Survey Bulletin, 707. US Gvt. Printing Office, Washington, DC, 266 pp. Cohn, T.A., Lane, W.L., Baier, W.G., 1997. An algorithm for computing moments-based flood quantile estimates when historical information is available. Water Resour. Res. 33 (9), 2089–2096. Cohn, T.A., Lane, W.L., Stedinger, J.R., 2001. Confidence intervals for EMA flood quantile estimates. Water Resour. Res. 37 (6), 1695–1706. Costa, J.E., 1978. Holocene stratigraphy in flood frequency analysis. Water Resour. Res. 14, 626–632. Crowfoot, R.M., Payne, W.F., O'Neill, G.B., 2004. Water Resources Data, Colorado, Water Year 2003, Volume 1. Missouri River Basin, Arkansas River Basin, and Rio Grande Basin. U.S. Geological Survey Water-Data Report CO 03 1. 577 pp. Denlinger, R.P., O'Connell, D.R.H., House, P.K., 2002. Robust determination of stage and discharge: an example from an extreme flood on the Verde River, Arizona. In: House, P.K., Webb, R.H., Baker, V.R., Levish, D.R. (Eds.), Ancient Floods, Modern Hazards: Principles and Applications of Paleoflood Hydrology. : Water Sciences and Application, vol. 5. American Geophysical Union, Washington DC, pp. 127–146. Elliott, J.G., Jarrett, R.D., Ebling, J.L., 1982. Annual snowmelt and rainfall peak-flow data on selected foothills region streams, South Platte River, Arkansas River, and Colorado River Basins, Colorado. U.S. Geological Survey Open-File Report 82-426. 86 pp. England, J.F. Jr., Salas, J.D., Jarrett, R.D., 2003a. Comparisons of two moments-based estimators that utilize historical and paleoflood data for the log-Pearson Type III distribution, Water Resour. Res. 39 (9), 5-1 5-16, doi:10.1029/2002WR001791. England Jr., J.F., Jarrett, R.D., Salas, J.D., 2003b. Data-based comparisons of moments estimators that use historical and paleoflood data. J. Hydrol. 278 (1–4), 170–194. England Jr., J.F., Klawon, J.E., Klinger, R.E., Bauer, T.R., 2006. Flood Hazard Study, Pueblo Dam, Colorado. Final Report. Bureau of Reclamation, Denver, CO. 160 pp. ftp://ftp. usbr.gov/jengland/Dam_Safety/pueblo_floodhazard_finalreport.pdf. Follansbee, R., Jones, E.E., 1922. Arkansas River flood of June 3–5, 1921. U.S. Geological Survey Water-Supply Paper 487. 44 pp. Follansbee, R., Sawyer, L.R., 1948. Floods in Colorado. U.S. Geological Survey WaterSupply Paper 997. 151 pp. Frankenfield, H.C., 1921. Rivers and Floods, August, 1921. Mon. Weather Rev. 49 (8), 471. Hafen, L.R., 1948. Colorado and Its People. A Narrative and Topical History of the Centennial State, Volume I. Lewis Historical Publishing, NY. 644 pp. Helley, E.J., LaMarche, V.C., 1973. Historic flood information for northern California streams from geological and botanical evidence. U.S. Geological Survey Professional Paper 485-E. 16 pp. Hosking, J.R.M., Wallis, J.R., 1997. Regional Frequency Analysis — An Approach based on L-Moments. Cambridge University Press. 224 pp.
15
House, P.K., Webb, R.H., Baker, V.R., Levish, D.R. (Eds.), 2002a. Ancient Floods, Modern Hazards: Principles and Applications of Paleoflood Hydrology. : Water Sciences and Application, vol. 5. American Geophysical Union, Washington DC. 385 pp. House, P.K., Pearthree, P.A., Klawon, J.E., 2002b. Historical flood and paleoflood chronology of the lower Verde River, Arizona: stratigraphic complexity and related uncertainties. In: House, P.K., Webb, R.H., Baker, V.R., Levish, D.R. (Eds.), Ancient Floods, Modern Hazards: Principles and Applications of Paleoflood Hydrology. Water Sciences and Application, vol. 5. American Geophysical Union, Washington DC, pp. 267–294. Jahns, R.E., 1947. Geologic features of the Connecticut Valley, Massachusetts, as related to recent floods. U.S. Geological Survey Water-Supply Paper 996. 158 pp. Jarrett, R.D., 1985. Determination of roughness coefficients for streams in Colorado. U.S. Geological Survey Water-Resources Investigations Report 85-4004. 54 pp. Jarrett, R.D., 1987. Flood hydrology of foothill and mountain streams in Colorado. Ph.D. Dissertation, Department of Civil Engineering, Colorado State Univ., Fort Collins, Colorado, 239 pp. Jarrett, R.D., 1990. Paleohydrologic techniques used to define the spatial occurrence of floods. Geomorphology 3, 181–195. Jarrett, R.D., 1991. Paleohydrology and its value in analyzing floods and droughts. In: Paulson, R.W., Chase, E.B., Roberts, R.S., Moody, D.W. (compilers) National Water Summary 1988–89-Hydrologic Events and Floods and Droughts, U.S. Geological Survey Water-Supply Paper 2375, pp. 105–116. Kochel, R.C., Baker, V.R., 1988. Paleoflood analysis using slackwater deposits. In: Baker, V.R., Kochel, R.C., Patton, P.C. (Eds.), Flood Geomorphology. John Wiley and Sons, NY, pp. 357–376. Levish, D.R., 2002. Paleohydrologic bounds: nonexceedance information for flood hazard assessment. In: House, P.K., Webb, R.H., Baker, V.R., Levish, D.R. (Eds.), Ancient Floods, Modern Hazards: Principles and Applications of Paleoflood Hydrology. : Water Sciences and Application, vol. 5. American Geophysical Union, Washington DC, pp. 175–190. Levish, D.R., Ostenaa, D.A., 1996. Applied Paleoflood Hydrology in North-Central Oregon. Guidebook for Field Trip 2, April 19–21, 1996, Cordilleran Section 92nd Annual Meeting, GSA, Portland, OR. Bureau of Reclamation, Denver, CO, Seismotectonics Report 96-7. 182 pp. Levish, D.R., England Jr., J.F., Klawon, J.E., O'Connell, D.R.H., 2003. Flood Hazard Analysis for Seminoe and Glendo Dams, Kendrick and North Platte Projects, Wyoming. Final Report. Bureau of Reclamation, Denver, CO. 126 pp. ftp://ftp.usbr.gov/jengland/ Dam_Safety/NorthPlatteFinalReport.pdf. Malde, H.E., 1955. Surficial geology of the Louisville quadrangle, Colorado. U.S. Geological Survey Bulletin 996E, pp. 217–259. Mansfield, G.R., 1938. Flood deposits of the Ohio River, January–February, 1937, a study of sedimentation. In: Grover, N.C. (Ed.), Floods of Ohio and Mississippi Rivers, January–February, 1937: U.S. Geological Survey Water Supply Paper 838, pp. 693–736. Munn, J., Savage, J.L., 1922. The Flood of June 1921 in the Arkansas River, at Pueblo, Colorado. Trans. Am. Soc. Civ. Eng. 85, 1–35 with discussion pp. 36–65. O'Connell, D.R.H., Ostenaa, D.A., Levish, D.R., Klinger, R.E., 2002. Bayesian flood frequency analysis with paleohydrologic bound data. Water Resour. Res. 38 (5), 16-1–16-14. Ogden, F.L., Sharif, H.O., Senarath, S.U.S., Smith, J.A., Baeck, M.L., Richardson, J.R., 2000. Hydrologic analysis of the Fort Collins, Colorado, flash flood of 1997. J. Hydrol. 228, 82–100. Ostenaa, D.A., Levish, D.R., O'Connell, D.R.H., 1996. Paleoflood Study for Bradbury Dam, Cachuma Project, California. Bureau of Reclamation, Denver, CO, Seismotectonics Report 96-3. 86 pp. Osterwald, D.B., 2003. Rails Thru the Gorge. A mile-by-mile guide for the Royal Gorge Route. Western Guideways, Ltd., Hugo, CO. 167 pp. Patterson, J.L., 1964. Magnitude and frequency of floods in the United States — Part 7, Lower Mississippi River Basin. U.S. Geological Survey Water-Supply Paper 1681. 636 pp. Patton, P.C., Baker, V.R., Kochel, R.C., 1979. Slack water deposits: a geomorphic technique for the interpretation of fluvial paleohydrology. In: Rhodes, D.D., Williams, G.P. (Eds.), Adjustments of the Fluvial System. Kendall/Hunt Publishing, Dubuque, IA, pp. 225–253. Powers, W.E., 1933. Physiography of the Royal Gorge of the Arkansas River. Geological Society of America Proceedings, p. 102. Powers, W.E., 1935. Physiographic history of the Upper Arkansas River Valley and the Royal Gorge, Colorado. J. Geol. 43 (2), 184–199. Powers, W.E., Behre Jr., C.H., 1934. Physiographic history of the Upper Arkansas River Valley and the Royal Gorge, Colorado. Ann. Assoc. Am. Geogr. 24, 64. Puseman, K., 2004. Examination of bulk soil and detrital charcoal for radiocarbon datable material from sites along the Arkansas River, Colorado. Paleo Research Institute Technical Report 04-113, Golden, CO. 20 pp. Richmond, G.M., 1965. Glaciation of the Rocky Mountains. In: Wright Jr., H.E., Frey, D.G. (Eds.), The Quaternary of the United States. Princeton University Press, Princeton, NJ. 922 pp. Scott, G.R., 1963. Quaternary geology and geomorphic history of the Kassler Quadrangle Colorado. U.S. Geological Survey Professional Paper 421A, 70 p., 1 sheet, scale 1:24, 000. Scott, G.R., 1972a. Reconnaissance geologic map of the Hobson Quadrangle, Pueblo and Fremont Counties, Colorado. USGS Miscellaneous Field Studies Map MF-353, 1 sheet, scale 1:24, 000. Scott, G.R., 1972b. Reconnaissance geologic map of the Swallows Quadrangle, Pueblo County, Colorado. USGS Miscellaneous Field Studies Map MF-354, 1 sheet, scale 1:24, 000. Shroba, R.R., Schmidt, P.W., Crosby, E.J., Hansen, W.R., Soule, J.M., 1979. Storm and flood of July 31–August 1, 1976 in the Big Thompson and Cache la Poudre River Basins,
16
J.F. England Jr. et al. / Geomorphology 124 (2010) 1–16
Larimer and Weld Counties, Colorado, Part B. Geologic and Geomorphic Effects in the Big Thompson Canyon Area, Larimer County. U.S. Geological Survey Professional Paper 1115, pp. 87–152. Smith, J.A., 1989. Regional flood frequency analysis using extreme order statistics of the annual peak record. Water Resour. Res. 25 (2), 311–317. Stedinger, J.R., Cohn, T.A., 1986. Flood frequency analysis with historical and paleoflood information. Water Resour. Res. 22, 785–793. Stedinger, J.R., Vogel, R.M., Foufoula-Georgiou, E., 1993. Frequency analysis of extreme events. In: Maidment, D.R. (Ed.), Handbook of Hydrology. McGraw-Hill, NY, pp. 18.1–18.66. Ch. 18. Stuiver, M., et al., 1998. INTCAL98 Radiocarbon age calibration. Radiocarbon 40 (3), 1041–1083.
Swain, R.E., England Jr., J.F., Bullard, K.L., Raff, D.A., 2004. Hydrologic Hazard Curve Estimating Procedures. Dam Safety Research Report DS-04-08. Bureau of Reclamation, Denver, CO. 79 pp. Taylor, R.B., Scott, G.R., Wobus, R.A., Epis, R.C., 1975a. Reconnaissance geologic map of the Cotopaxi 15-minute Quadrangle, Fremont and Custer counties, Colorado. USGS Miscellaneous Field Investigations Map I-900, 1 sheet, scale 1:62, 500. Taylor, R.B., Scott, G.R., Wobus, R.A., Epis, R.C., 1975b. Reconnaissance geologic map of the Royal Gorge Quadrangle, Fremont and Custer counties, Colorado. USGS Miscellaneous Investigations Map I-869, 1 sheet, scale 1:62, 500. Van Alstine, R.E., 1974. Geology and mineral deposits of the Poncha Springs SE Quadrangle, Chaffee County, Colorado. USGS Professional Paper 829, 19 p., scale 1:24, 000.