Andrés Etter and Willem van Wyngaarden
Patterns of Landscape Transformation in Colombia, with Emphasis in the Andean Region Since pre-Columbian times, Colombia has undergone transformation of large parts of its natural ecosystems, in particular in the Andean region. To date, little is known about the patterns and processes of this transformation and their relation with socioeconomic and biophysical aspects. Traditionally, the lack of integration of multidisciplinary data has hampered the possibility to understand complex phenomena like this. An integrated approach helps to bring into a relevant contextual analysis, data that are normally analyzed separately. This paper presents an approach to understanding ecosystem transformation by linking and integrating, spatially, data on ecosystem distribution and transformation, with demographic, land use, and settlement history data on a national scale. The transformation is analyzed and documented in order to explain the present situation and to make some general predictions about future tendencies. The results show that the demographic and transformation patterns follow clear historical trends that can be spatially differentiated, and are related to natural regions—plains and mountains, and altitude belts—and to general land uses. In particular, the patterns of the Andes and the lowlands show historically distinct tendencies. The Andean region has higher densities and transformation proportions than the lowlands. The older settlement areas show higher densities and more intensive land use, and tend to be strongly related to the Andean region.
INTRODUCTION The study of the human processes that underlay ecosystem transformation and the spatial patterns that are generated are of prime importance to support the process of landscape planning. It enables us to determine more adequately the spatial analyses and evaluations of the impacts these processes have on ecosystem functions. In addition, it may help in visualizing future tendencies of spatial occupation. However, a reasonable understanding of the spatial patterns that result from the settlement history of a landscape, depends to a large extent on the possibility to effectively articulate the different biophysical and socioeconomic variables which underlie them. Generally, population data tend to be analyzed independently, without taking into account relationships to particular biophysical conditions and land use. This leads to the difficulty posed by the differences in spatial and temporal references, in the fields of biophysical and socioeconomic information. To arrive at a more comprehensive approach, it is necessary to develop an analytical model that includes possible relevant variables, and to transform and adjust data originating from different databases to a common base. This article develops an approach in this sense, for Colombia and the Andean region in particular. BACKGROUND OF THE ANDEAN LANDSCAPE TRANSFORMATION The Andean Region in Colombia covers some 278␣ 600 km2, or 24.5% of the country’s surface, taking the 500 m contour line as the lower limit. The altitudinal gradient covers from 500 to 432
Central Cordillera, Colombia. At an altitude between 1000 and 2000 m and a humid climate. The landscape is densely populated and intensively used for various forms of cropping and very little remains of the original forest. The main crop in this area is coffee. Photo: A. Etter.
more than 5000 m. It is composed of 3 main N-S oriented mountain ranges or Cordilleras (eastern, central and western), and 2 massifs, one isolated to the north, the Sierra Nevada de Santa Marta, and one to the south, the Macizo Colombiano and Nudo de los Pastos, where the Cordilleras originate by splitting (Fig. 1). Some of the outstanding aspects of the region are its high ecosystem and species diversity. This is the result of various factors that propitiate geographical variability; the large altitudinal range, the climatic anomalies in the inter-Andean valleys resulting from the complex topography, and the contrasts in soil mosaics due to the geologic heterogeneity (1). The flora of the region show affinities with the Amazon and Pacific regions up to 1500 m (2). At higher altitudes the relations with other flora are weak and the level of endemism high. The tropical cloud forests, in particular the Andean ones, are among the least known ecosystems (3). Gentry, estimated the number of plant species for the region at 30␣ 000 to 40␣ 000, which makes it one of the richest in the world, certainly considering its limited area. Although the diversity of the individual communities may not be high, the region seen as a whole definitely is; a main reason being the restricted distribution of many plant and animal groups in areas which in many cases are 10 km2 or less (4). The explanation for this phenomenon is based on 2 aspects; the rugged and complex topography, and (periodic) isolation determined by the Ice Ages during the Pleistocene. The existing human population in the present state of Colombia, at the time of the arrival of the Spaniards, is known to have been high, as well as ethnically very diverse, although the figures used by different authors vary. Authors like Melo (quoted in 5) give an estimate of around 5 million. Colmenares (6), on the basis of calculations derived from indigenous tributary figures collected during the 16th century, arrives at a total of 3 million, which probably is an underestimation since a large part of the population was not tributary. Colmenares estimates that on
© Royal Swedish Academy of Sciences 2000 http://www.ambio.kva.se
Ambio Vol. 29 No. 7, Nov. 2000
arrival of the Spaniards about 60% of the population was settled in the Colombian Andes. According to Ardila (pers. comm.), on the basis of his own detailed archaeological studies in the Guajira region in northern Colombia, the population around the year 1500 AD could have been over 500␣ 000 inhabitants in this region only. This would mean that the figure of 5 million would be a rather low estimate. Whatever the exact magnitude of the indigenous population, the process of conquest led to the extermination of a major part of the population, especially in the Andean and Caribbean regions, with estimates of up to more than 90% for many areas. At the end of the 18th century the population was still as low as 1 million, only returning to the original 5 million at the end of the 19th century. All these estimations/calculations rely on data provided by the chronicles and archaeological findings, which are still local and rather unevenly distributed. What is certain is that pre-Columbian occupation was indeed high, and concentrated in the Andean region, especially in the main valleys and the highlands of the present Departments of Nariño, Cauca, Antioquia, Cundinamarca, Boyacá and Santander, and in the Caribbean region. Within the Andes, except for the major valleys, the zone between 1000 and 2500 m, apparently showed lower densities than the highlands above 2500 m. However, the archaeological records of several areas show that occupation densities were high, and the settlements permanent for more than 1500 years before the Spanish conquest (7, 8), which indicates a long process of ecosystem transformation. Figure 1. Location of the Andean Region in Colombia.
The land use before 1500 AD was, however, almost exclusively a form of semipermanent slash-and–burn agriculture and hunting, which should have favored the existence of mosaics of natural and seminatural vegetation associated with cultivated fields. In some cases permanent cropping areas were established in swampy areas on ridged fields (9, 10). Real urban concentrations were neither very frequent nor large in Colombia, being at that time rather in a process of conformation. With the arrival of the Spaniards, fundamental changes occurred in the use of land due to: i) the introduction of cattle, which had a large impact both on the transformation of natural ecosystems and on the type of agro-ecosystems; ii) the gradual concentration of the population in urban areas; and iii) a drastic reduction in population, leading to extermination in large areas that possibly, regenerated back to natural ecosystems. The impact of the grazing activities must have been especially strong in areas with a well-defined dry season like the Caribbean and parts of the Andean highlands, where fire could be easily used for grassland management, leading to the creation of vast previously nonexisting open landscapes. At the same time, the reduction of the population in the more humid areas, meant that large areas underwent a process of regeneration of the natural ecosystems, for which there is evidence in areas like the Sierra Nevada de Santa Marta, the slopes of the of the central and western Cordilleras, and the middle Sinú valley (11). These processes combined with the exponential growth of the population after about 1800 have led to the state of transformation in the ecosystems found nowadays. For instance, transformation of the forests of the Andean region has reached about 70% (1), and the distribution of the remaining forests is not even; the larger and more continuous remnants are located on the more humid east-facing slopes of the eastern Cordillera and the west-facing slopes of the western Cordillera (Fig. 7). In many areas like the Chicamocha watershed, however, relicts occupy only around 10% and are located on the steepest and highest parts of the landscape (12). Fragmentation is very pronounced, and few complete altitudinal transects or effective latitudinal connections still remain. This has meant local and macro-regional isolation, and producing what Gentry (13) referred to as “neo-endemism”. An understanding of the impact of this process of transformation on a regional and national scale is still lacking. One way of analyzing the consequences of the human transformation of ecosystems is by calculating the degree of representativeness that the actual ecosystems have, in relation to their original distribution and characteristics. So far there is only one example available at a local level, that by Fandiño (14), for the Iguaque area in the Eastern Cordillera. MATERIALS AND METHODS The analytic procedure developed, follows from 3 basic arguments: i) The vast transformation of the natural ecosystems, which has led to the actual situation as presented in the Ecosystem Map (15). ii) The pattern of transformation is not homogeneously distributed over the country (15). iii) The transformation results from human activity and, thus, is probably related to factors related to this, such as population distribution and density, type of land use and the history of land occupation.
Ambio Vol. 29 No. 7, Nov. 2000
© Royal Swedish Academy of Sciences 2000 http://www.ambio.kva.se
433
Figure 2. Analytical procedure.
Therefore, the procedure emphasizes the understanding of the relationship between the factors related to the actual and past distribution of the human activities, and the ecosystem transformation. The general analytical procedure followed is shown in Figure 2. The following sources of information were used for the analysis: – Municipal census 1993 and projections to the year 2000 (16). – Map of municipalities and towns (18). – Foundation dates of 954 towns and villages (17). – 500 m contour lines of the 1:1␣ 500␣ 000 national cartography (18). – Map of Colombian Ecosystems at 1:1␣ 500␣ 000 (15). – General National Land Cover/Use Map at 1:3 400 000 (19). All these data were captured in a geographic information system for further analysis. Because the majority of the operations in the spatial analysis (point/line interpolation, crossing of maps) require maps in raster format, all original data, whether in the form of point, vector or raster format, were converted into rastermaps with 1-km resolution. The spatial analysis was carried out by using the ILWIS 2.2 software (20). From the Contour Map an Altitude Zone Map was generated (ALT) through point/line interpolation and slicing. The altitudinal zoning is taken into account, because biophysical conditions, especially climate and resources, as well as settlement patterns, often show a close relationship to altitude in mountain environments (21, 22). From the Ecosystem Map (15), the Transformed Areas were retrieved in a separate map, and crossed with the Municipality map, to produce a Map showing the transformation for each municipality, by levels (< 10%; 10–50%; 50-80%; > 80%) (TRAN). The calculation of population density is generally done, using the total area of the administrative unit (municipality, country, etc.). In this case, the rural population density was corrected using as calculation base only the transformed area of the municipality, and displayed as a map grouped according to 4 classes (< 20; 20-50; 50–100; >100 hab km–2) (DENS). The maps TRAN and DENS, and urban settlements from the Municipal Map were crossed with the ALT map. Thus, the relation between the altitude zones and % transformation, total population, rural density and number of urban settlements was established. 434
From the Land Use Map (19), a new classified map (USE) was derived, by grouping units into 3 classes: Natural Ecosystems, Pastures, and Crop areas. Pastures are taken as related to more extensive types of land use, and Crop areas to more intensive land uses. The map AGE was constructed by interpolating the data of the foundation age of the towns and villages, within the area of transformed ecosystems of the country. The interpolation method used was “Kriging” (20), which assigns weighted average point values, calculated on the basis of a user specified semivariogram. The interpolation map, was then sliced according to broad “settlement periods” of Colombian history, that can be described as follows: – before 1500: pre-conquest period; – 1500 to 1750: colonial time with population decreasing tendencies; – 1750 to 1850: late colonial and independence wars; – 1850 to1920: New Andean colonization; – 1920 to 1970: first industrialization period and beginning of recent lowland colonization; – 1970 to 2000: urban boom and Amazon and Magdalena lowland colonization. To arrive at a proper interpretation base, to allow an insight into the ecosystem transformation process of the country and the possible particularities of the Andean region, the following map-crossing operations based on the intermediate results were carried out: TRAN*DENS; DEN*AGE; DENAGE*USE; TRAN*AGE; TRANDEN*USE; The results of these operations in the form of Tables, were then re-calculated for each 500 m altitude zone. The data were also grouped in terms of Andean (> 500 m) and non-Andean (< 500 m) areas. RESULTS At the national scale, the TRAN map (Fig. 3) and the DENS map (Fig. 4), show that ecosystem transformation and population distribution, have clearly recognizable patterns, although the explanation of these is not evident independently. When looking at the Rural Population Density and Ecosystem Transformation Maps, and crossing them with the 500 m Altitude Map, clear patterns come out (Table 1). The distribution of the population
© Royal Swedish Academy of Sciences 2000 http://www.ambio.kva.se
Ambio Vol. 29 No. 7, Nov. 2000
Figure 3. Transformation by municipality.
Figure 4. Map of the corrected rural population density in classes.
Ecosystem Transformation Classes
Rural Population Density Classes (inhab. km–2)
Table 1. Population and urban settlements by 500 m altitude belts.
Colombia Andes
Population
km2
%
Tot.
1000 km–2
Urban inhab.
859 321 70 102 55 593 46 741 48 087 26 656 22 665 8776
75.5 6.2 4.9 4.1 4.2 2.3 2.0 0.8
377 124 92 241 67 145 23 –
0.4 1.8 1.7 5.2 1.4 5.4 1 –
7 367 787 3 648 345 1 060 550 4 275 265 394 287 6 366 664 72 623 –
3 654 047 931 009 1 210 750 1 338 746 1 158 615 807 173 450 443 –
12.8 65.3 40.9 120.1 32.3 269.1 23.1 –
4.3 13.3 21.8 28.6 24.1 30.3 19.9 –
1 137 941 278 620
100.0 24.5
1069 692
0.9 2.5
23 185 521 15 817 734
9 550 783 5 896 736
28.8 77.9
8.4 21.2
is not homogeneous, showing large differences among regions and altitude belts. Over 66% of the population is located in areas of more than 500 m, which corresponds to the Andean region, in only 24.5% of the country’s surface. The rural population density increases with altitude from 17.1 up to more than 48 inhab. km– 2 . Regarding urban concentrations 64.7% are located in the Andes; their density varies from 0.4 up to 5.8 per 1000 km2, with two peaks in the ranges of 1500–2000 m and 2500–3000 m (Fig.5). The average proportion of transformed ecosystems is rather constant for the Andean region belts between 500 and 3000 m, mostly between 60 and 75%, and very contrasting with areas found under 500 m altitude. The crossing of the spatial information on rural density and ecosystem transformation, presented in the map TRANDEN (Fig. 6), confirms that there is not a straightforward relation between the two, but invites formulation of the hypothesis Ambio Vol. 29 No. 7, Nov. 2000
Rural inhab.
Total dens. Rural dens. km–2 km–2
Corrected rural dens. km–2 17.1 20.7 31.4 38.9 38.4 48.6 44.9 – 24.6 33.7
Figure 5. Relation between transformation %, corrected rural density and town density, in the different altitude belts.
Nr Towns km–2
0–500 500–1000 1000–1500 1500–2000 2000–2500 2500–3000 3000–3500 > 3500
Towns
% or inhabitants km–2
(m)
Area
▲
Altidude
km–2 © Royal Swedish Academy of Sciences 2000 http://www.ambio.kva.se
% Transf.
Nr. Towns km–2
435
that there is a relation with general land-use types and history of transformation. For instance, areas of low population density and high transformation which would probably correspond with large properties and extensive use of the land, such as grazing. The testing of the previous hypothesis was done by crossing Transformation – Density the TRANDEN Map, with the classified Land Use Map USE Classes (Fig. 7). The results obtained indicate a close relation between the high proportion of pastures, associated with the more extensive uses, and the low population density in all transformation classes, as well as the contrary (Table 2). The combined analysis of the constructed AGE map (Fig. 8) with the present patterns of rural population density DENS shows very clear and systematic patterns, as can be seen from Figure 9. In general, the average population densities are higher in the areas of older transformation (< 1750; 1750–1850), while the proportion of low density is higher in the more recent age areas (1920–1970; >1970). Another aspect to be seen is that the pattern of the Andean region contrasts sharply to the Lowland pattern in all age classes, very probably due to the differences in transformation history and in the biophysical conditions. The altitude zoning of ecosystem transformation, in terms of general land-use type and age (Table 3), shows regular differences in the patterns, e.g.: – the proportion and type of transformed ecosystems in the zones between 500 m and 3000 m is fairly constant; – the lowlands show a lower percentage of transformation, but a much higher proportion of pastures in the transformed ecosystems; – above 3500 m the transformation is almost zero because of the extreme climatic conditions; – the area of transformed ecosystems has been steadily growing during all periods at the national level, but this growth Figure 6. Map of the crossing of transformation and rural population density maps. has been decreasing in the Andean region since 1920; – the majority of ecosystem transformation in the last 30 to 50 years has been concentrated in the lowlands, up to 1000 m. Table 2. Percentage pastures for the transformation-rural density classes. When examining the relation between the transformation age, and the average rural denClass Transformation (%) Density (km–2) Area (km2) % of Colombia Pasture (%) sity and the proportion of pastureland (Table 4), the following can be concluded: TI-DI < 10% < 20 467 550 40.52 100.0 TI-Dml < 10% 20–50 4022 0.35 92.4 – the older the transformation, the larger the TI-Dm < 10% 50–100 1850 0.16 100.0 rural density, and the lower the proportion TI-Dh < 10% > 100 1947 0.17 100.0 of pastures; Tml-DI 10–50% < 20 106 941 9.27 98.2 ▲ – the opening of the agricultural frontier durTml-Dml 10–50% 20–50 69 498 6.02 91.3 th Tml-Dm 10–50% 50–100 23 485 2.04 87.2 ing the 20 century has been done on the TmI-Dh 10–50% >100 6044 0.52 63.5 basis of extensive grazing uses, and mainly Tm-DI 50–80% < 20 247 591 21.46 91.2 ▲ affects the Tropical Lowland Forests. Tm-DmI 50–80% 20–50 47 641 4.13 81.3 DISCUSSION These results offer a new and broader insight into the understanding of population patterns and ecosystem transformation in Colombia,
Tm-Dm Tm-Dh
50–80% 50–80%
50–100 > 100
15 787 5146
1.37 0.45
61.5 48.2
Th-DI Th-DmI Th-Dm Th-Dh
> 80% > 80% > 80% > 80%
< 20 20–50 50–100 > 100
87 210 56 603 9929 2545
7.56 4.91 0.86 0.22
90.1 ▲ 75.4 61.2 44.4
Table 3. Percentage transformed area per period and 500 m altitude belts. > 1750
1750–1850
0–500 500–1000 1000–1500 1500–2000 2000–2500 2500–3000 3000–3500 > 3500
9.0 21.9 21.0 19.3 17.0 50.9 36.7 0.0
16.1 18.4 30.0 34.2 35.2 22.3 24.0 0.0
1850–1920 19.2 19.6 24.5 31.1 30.3 19.1 23.6 0.0
1920–1970
> 1970
23.5 24.6 16.8 11.5 14.4 6.9 14.9 0.0
32.2 15.5 7.7 3.9 3.2 0.7 0.9 0.0
Colombia
15.8
21.3
21.8
20.3
20.8
Andea
24.0
27.7
25.0
16.3
7.1
436
Period
< 1750 1750–1850 1850–1920 1920–1970 > 1970
© Royal Swedish Academy of Sciences 2000 http://www.ambio.kva.se
Area (km2)
Rate (km2 yr–1)
60 454 81 473 83 373 77 408 79 552
? 240 815 1191 1548 3182
Avg. rural dens. (inh km–2) ▲ 43.7 31.4 25.1 16.2 12.3
Pasture %
▲
Altitude (m)
Table 4. Transformation rates, rural density and pastures (%) in transformed areas.
65.8 79.9 85.5 94.1 97.2
Ambio Vol. 29 No. 7, Nov. 2000
Generalized Land Use Map
Figure 7. General land use map (Derived from IGAC 1988).
Age of Transformation Classes
Figure 8. Age of transformation map constructed on the basis of the interpolation of the foundation dates of towns.
Percentage of total area per period
especially in the Andean region. The authors realize that with a identify. Therefore, the rate of transformation in our model for more diverse and extensive data set, for instance on physical as- the period before 1750 is probably high, but an unknown quanpects like relief, soil, and climate, as well as more detailed his- tity smaller than that given in Table 4. torical data, it would be possible to arrive at more detailed exOn the other hand, for the more recent periods like 1920–1970 planations of the present situation and its consequences. How- and especially 1970–2000, the results are very much in line with ever, the developed analytic procedure combined with the rela- the present estimations. For instance, in the 1980–1998 period tively simple database gave results that show clear patterns that the more reasonable estimates are thought to lie somewhere becan be logically explained; they put a new light on the pattern tween 270␣ 000 and 350␣ 000 ha yr–1 (23), while our model arrives of transformation of ecosystems in Colombia. at a figure of something over 300␣ 000 ha yr–1. Another clear obWhen comparing the figures of rural population density ob- servation is that the higher altitude areas correspond to early tained by the applied ecosystem transformation approach with transformation periods, whose transformation is at present almost those obtained using the traditional approach, it is possible to Figure 9. Andean and lowland figures for the combination of transformation age and present rural observe very significant differdensity classes. ences (Table 1). If the traditional Andes Lowland figure is used, most of the observed patterns would clearly be lost, as well as the explanatory power of the presented general results. With respect to the historic insight, although data on the preColombian process of ecosystem transformation are still scarce, it seems highly probable that during the first century of colonization a process of recovery and regeneration of the natural vegetation should have taken place. How large an area involved is not possible to determine and how much has remained transformed since the arrival of the Period and Density Class Spaniards is equally diffcult to Ambio Vol. 29 No. 7, Nov. 2000
© Royal Swedish Academy of Sciences 2000 http://www.ambio.kva.se
437
Central Cordillera, Colombia. Altitude between 1000 and 2000 m with a sub-humid climate and sparsely populated. The main activity is extensive livestock production as indicated by the abundance of pastures. Cropland is concentrated in the valley bottoms with ample water supply. Photo: A. Etter.
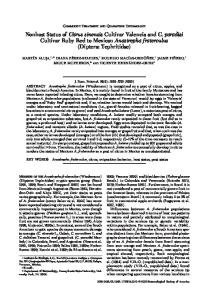
The image shows part of the eastern Cordillera, just north of the capital Bogotá. The left part belongs to the “Altiplano”, a plain at 2600 m altitude, with a long history of occupation and nowadays intensively used for livestock production (milk) (1, 2) and arable farming, mainly potatoes (3). Only on some of the steeper mountain ridges is there some remaining forest (4).
complete, very little being added each year. This is in contrast to the lowlands where almost all recent transformation is taking place (Table 3). In general the following may be concluded from the analysis: – Early transformation corresponds to higher rural density, lower percentage of pastures, and thus more intensive use of land, and is located in the mountainous areas. – Recently transformed areas are related with lower rural densities, higher percentage pastures, and so to more extensive land use, and are located in the lowlands. On the basis of our present knowledge, it can be argued that the main causes found in the history of the natural ecosystem transformation, could be phrased as follows: – Pre-Colombian times; slow population growth, and the need for new arable land to feed people. – Spanish conquest: expulsion of native population to inaccessible areas, need for land to maintain grazing activities, but initially, also a regeneration, especially in the more humid lowlands, due to native population extermination. – 18 and 19th centuries, beginning of exponential population growth, resulting in increasing population density and “local” transformation especially in the Andean zone. – 20th century: high demographic growth rates, forcing emigration to colonization areas, land concentration and extensive uses; demands of the growing market economy; and more recently a lowered governability, and the expansion of illicit crops. The right part belongs to the eastern flank of the Cordillera. The highest parts consist of the relatively undisturbed páramos (alpine meadows above 3400 m) (5), followed by the high Andean forests (6), while the slopes below 2500 m are almost totally converted into pastures and some cropland (7). (LANDSAT Satellite Image, approximate scale 1:200 000).
4 1
3 7 6 2
438
5
© Royal Swedish Academy of Sciences 2000 http://www.ambio.kva.se
Ambio Vol. 29 No. 7, Nov. 2000
Number of inhabitants
Possible Future Trends 20 000 000 If in the foreseeable future the present trends con18 000 000 tinue, most of the process of natural ecosystem transformation will take place in the lowlands of the 16 000 000 tropical forests in the Amazon and Pacific, and the savannas of the Orinoco plains. In the Andean re14 000 000 gion, the remnants of the natural ecosystems are either located on steep slopes or in the external wet 12 000 000 slopes of the east and west Cordilleras, which lowers the probability of them being transformed. 10 000 000 According to the most recent population censuses 8 000 000 (16), as in many other parts of the developing countries, there is a strong rural-urban migration with a 6 000 000 consequent general tendency for the rural population density to stagnate or even decline (Fig. 10). 4 000 000 This process has recently even been increasing in Colombia due to peasant migrations resulting from 2 000 000 the internal armed conflict. However, this does not imply, necessarily, that a recuperation of natural 0 ecosystems will take place, since extensive grazing activities have been increasing not only due to deforestation, but also to the decrease of labor intensive agriculture (24). The Andean region has not escaped from this process, since large areas of slopFigure 10. Rural/Urban population of the Andean Region 1951–1993. ing terrain have been transformed into extensive The actual and future pressure on natural ecosystems will be grazing lands with negative effects, e.g. landscape homogenivery much related to the historical tendencies and the present zation, erosion, and hydrological deregulation of watersheds. Some ecosystems like the Andean forests, in particular the occupation patterns. The planning and implementing of a well cloud forests, are being subject to increasing deforestation for structured strategy for the conservation of the natural and culthe cultivation of illegal crops like opium (25). Although these tural ecosystems, will require at least the following information: activities are being prosecuted, it is uncertain whether these ar- a detailed inventory (of the remaining natural areas), good eas will be left to return to natural ecosystems or will be kept knowledge of the pressure factors operating in the foreseeable future and a representativeness analysis (14, 26). under other uses like cattle-grazing. References 1. Etter, A. 1993. Ecosystem diversity in Colombia. In: Our Biological Diversity, CEREC and A. Angel Foundation (eds). pp. 43–61. Bogotá (In Spanish). 2. Rangel, O. (ed.). 1995. Colombia: Biotic Diversity Vol. 1. Natural Science Institute (National University) — Colombian National Science Fund, Bogotá. 440 pp. (In Spanish). 3. Gentry, A. 1993. The significance of Biodiversity. In: Our Biological Diversity, CEREC and A. Angel Foundation (eds). pp. 13–24. Bogotá. (In Spanish). 4. Gentry, A. 1986. Endemism of tropical versus temperate plants. In: Conservation Biology. Soulé, M.E. (ed.). Sinauer Associates, Massachusetts. 5. Jaramillo, S. and Cuervo, L.M. 1987. The Configuration of Regional Space in Colombia. Three Essays. Center of Economic Studies, Los Andes University, Bogotá. 420 pp. (In Spanish). 6. Colmenares, G. 1997. Economic and Social History of Colombia: 1537–1719. Vol. 1. 5th edition. Third World Editors, Bogotá. 480 pp. (In Spanish). 7. Herrera, L.F., Drennan, R. and Piñeros, F. 1989. The Environment and Human Occupation. In: Herrera, L.F., Drennan, R.D. and Uribe, C.A. (eds). Prehispanic Chiefdoms of the Valle de la Plata. Mem. Latin Am. Archaeol. 2, 226–232, U. of Pittsburgh, Pittsburgh. (In Spanish). 8. Santos, G. 1995. Prehispanic Societies of Jardín and Riosucio. Revista Colombiana de Antropología 247–287. (In Spanish). 9. Plazas, C., Falchetti, A.M., Sáenz, J. and Archila, S. 1993. The Zenú Hydraulic Society: Archaeological Study of 2 000 Years of History in the Caribbean Plains of Colombia. Bibliographic Collection, Bank of the Republic. 380 pp. (In Spanish). 10. Parsons, J.J. and Denevan, W.M. 1967. Precolumbian ridged fields. Sci. Am. 217, 92– 100. 11. Parsons, J. 1952. The settlement of the Sinú Valley of Colombia. Geogr. Rev. 42, 67– 86. 12. Villa, L.A., Etter, A. and Baptiste, L.G. 1994. Regional analysis of the land cover and the historic transformation of the landscape in northern Boyacá (Colombia). Proc. III Research Congress of the Javeriana University, Vol. 1, 59–68. Javergraf, Bogotá. (In Spanish). 13. Gentry, A. 1982. Neotropical floristic diversity: phytogeographical connections between Central and South America: Pleistocene climatic fluctuation, or an accident of the Andean orogeny? Ann. Missouri Bot. Garden 78, 273–295. 14. Fandiño, M. 1996. Framework for Ecological Evaluation. ITC Publ. No. 47. ITC, Enschede, The Netherlands. 195 pp. 15. Etter, A. 1998. General Ecosystem Map of Colombia (1:2␣ 000␣ 000 scale). Alexander von Humboldt Biodiversity Research Institute, Ministry of the Environment, Bogotá. 16. DANE 1951, 1964, 1973, 1985, 1993. National Census Statistics. National Statistics Department, Bogotá. 17. IGAC 1996. Geographic Dictionary of Colombia, 4 Vols. Agustín Codazzi National Geographic Institute, Bogotá. 18. IGAC 1995. Topographic Base Maps (1:1␣ 500␣ 000 scale). Agustín Codazzi National Geographic Institute, Bogotá. 19. IGAC 1988. Land Cover and Use Map (1:3 400 000 scale). Agustín Codazzi National Geographic Institute, Bogotá. 20. ITC 1998. ILWIS 2.2 for Windows: The Integrated Land and Water Information System. International Institute for Aerospace Survey and Earth Sciences (ITC), Enschede, The Netherlands. 21. Lauer, W. 1993. Human development and environment in the Andes: a geoecological overview. Mountain Res. Devel. 13, 157–166. Ambio Vol. 29 No. 7, Nov. 2000
22. Uhlig, H. and Kreutzmann, H. 1995. Persistence and change in high mountain agricultural systems. Mountain Res. Devel. 15, 199–212. 23. World Resources Institute 1998. World Resources 1998–1999: A Guide to the Global Environment. Part 3, Data Tables. Oxford University Press, Oxford. 24. Murgueitio, E. and Calle, Z. 1998. Biodiversity in cattle grazing systems in Colombia. Electronic Teleconference “Agroforestry for Animal Production in Tropical America”. FAO-CIPAV. (In Spanish). 25. Cavelier, J. and Etter, A. 1996. Deforestation of Montane Forests in Colombia as a Result of Illegal Plantations of Opium (Papaver somniferum). In: Churchill S., Balslev, H., Forero, E. and Luteyn, J. (eds). Biodiversity and Conservation of Neotropical Montane Forests, pp. 541–550. The New York Botanical Garden, N.Y. 26. Etter, A., Fandiño, M. and Van Wyngaarden, W. 1999. Representativeness Analysis of the Natural Ecosystems of the Andean Region in Colombia. Poster presented at the 2nd National Congress on Biodiversity Conservation, October 1999, Universidad JaverianaVon Humboldt Institute, Bogota. (In Spanish). 27. Acknowledgements: Thanks to A. Sarmiento for making some of the data accessible and for the layout and printing of the maps.
Andrés Etter is professor and head of the Department of Territorial Processes and Human Settlements at the Faculty of Environmental and Rural Studies of the Javeriana University in Bogota, Colombia. He has a MSc in landscape ecology from the ITC, Enschede, The Netherlands. His main scientific interest is landscape ecology, especially landscape fragmentation and human impact. His address: Faculty of Environmental and Rural Studies, Javeriana University, Cra. 7 Nr. 42-27, Bogota, Colombia. E-mail:
[email protected] Willem Van Wyngaarden is a private consultant and parttime professor at the Department of Territorial Processes and Human Settlements at the Faculty of Environmental and Rural Studies of the Javeriana University in Bogota, Colombia. He has a PhD in ecology from the Wageningen Agricultural University, The Netherlands. His main research interest is spatial and temporal modelling of ecosystem processes applied to conservation. His address: Faculty of Environmental and Rural Studies, Javeriana University, Cra. 7 Nr. 42-27, Bogota, Colombia. E-mail:
[email protected]
© Royal Swedish Academy of Sciences 2000 http://www.ambio.kva.se
439