Journal of Personality and Social Psychology 2009, Vol. 97, No. 5, 893–912
© 2009 American Psychological Association 0022-3514/09/$12.00 DOI: 10.1037/a0016515
Predicting Unpredictability: Do Measures of Interpersonal Rigidity/Flexibility and Distress Predict Intraindividual Variability in Social Perceptions and Behavior? Thane M. Erickson
Michelle G. Newman and Aaron L. Pincus
Seattle Pacific University
The Pennsylvania State University
Maladjusted individuals have been theorized to exhibit problematic intraindividual variability of social behavior across situations. This variability is either excessively high (i.e., unpredictable) or low (i.e., rigid), or the behavior is inappropriately matched to the interpersonal context (noncomplementary). However, research has not tested systematically whether interpersonal distress and purported measures of rigidity actually predict these different types of variability across a broad range of social situations. Participants completed measures of interpersonal functioning and then responded to a range of hypothetical interpersonal scenarios, rating perceptions of others and their own expected behavioral responses (Study 1). A subset of participants also rated others’ and their own social behaviors across a week of naturalistic social interactions (Study 2). Results most consistently suggested that interpersonal distress predicts high intraindividual variability, with little support for the measurement or theory of rigidity. Moreover, variability of social perceptions partially mediated the link between distress and behavioral variability. Results largely persisted even after accounting for gender and variables’ mean levels, and cannot be fully explained by interpersonal complementarity. The implications of these dynamic processes for understanding personality and interpersonal adjustment are discussed. Keywords: intraindividual variability, interpersonal rigidity, interpersonal problems, complementarity
exhibit both a characteristic mean level of friendliness over time and reliable variability around the mean level. Moreover, individuals demonstrate reliable patterns of cross-situational variability (e.g., friendliness only when others submit; Mischel, Shoda, & Mendoza-Denton, 2002). Thus, trait perspectives and perspectives emphasizing behavioral variability are reconcilable (Fournier, Moskowitz, & Zuroff, 2008): “cross-situational variability seems to be an essential expression of the enduring but dynamic personality system itself” (Mischel et al., 2002, p. 53). Many personality and clinical psychological theories posit links between psychosocial adjustment and variability, stating that maladjusted individuals exhibit intraindividual variability that is (a) too low, (b) too high, or (c) inappropriately matched to the interpersonal context. However, it is not clear which, if any, of these theories have compelling empirical support. The theoretical perspective that has received the most anecdotal support is that poorly adjusted individuals are relatively unable to adapt to situational demands, demonstrating rigid perseveration in one way of perceiving others or one pattern of relating to them (e.g., Bowlby, 1988; Carson, 1969; Epstein, 1973; Hayes, Strosahl, & Wilson, 1999; Kiesler, 1996; O’Connor & Dyce, 1997; Strupp & Binder, 1984; Tracey, 2005). Within this theory, well-adjusted individuals are capable of flexibly adapting to a wide range of situations (Bem, 1974; Cantor & Kihlstrom, 1987; Markus & Nurius, 1986; Paulhus & Martin, 1988; Snyder, 1974). Most explicitly, Leary (1957) defined interpersonal rigidity as when a person “tends to overdevelop a narrow range of one or two interpersonal responses . . . expressed intensely and often, whether appropriate to the situation or not” (p. 118). A rigidly dominant person, for instance, might assertively take charge in most inter-
Psychologists examining normal and maladaptive personality have long been interested in questions about variability in personality, such as whether behavior is traitlike and relatively consistent (e.g., Allport, 1937) or inconsistent across situational contexts (e.g., Mischel, 1968). Despite substantial consistency of personality traits over time (Caspi & Roberts, 2001), individuals also vary across situations or relationships in their self-perceptions (e.g., Donahue, Robins, Roberts, & John, 1993) and interpersonal tendencies (e.g., La Guardia, Ryan, Couchman, & Deci, 2000; Moskowitz & Zuroff, 2004). Of interest, recent research has attested to reliable individual differences in within-person or intraindividual variability across situations and time (Baird, Le, & Lucas, 2006; Eid & Diener, 1999; Fleeson, 2001). For instance, individuals may
Thane M. Erickson, Department of Psychology, Seattle Pacific University; Michelle G. Newman and Aaron L. Pincus, Department of Psychology, The Pennsylvania State University. This research was based on Thane M. Erickson’s dissertation and was supported by an award from the Penn State University Research and Graduate Student Organization. Portions of this article were presented at the annual meeting of the Society for Interpersonal Theory and Research in Madison, Wisconsin (June 2007). We thank D. S. Moskowitz for providing her Social Behavior Inventory behavior rating forms; Michael B. Gurtman for expert ratings of materials for Study 1; Laura Clem, Aaron Fisher, and Margaret Diddams for statistical consultation; and Pamela Sadler, David E. Conroy, Kenneth N. Levy, and Margaret Marshall for providing comments on earlier versions of the article. Correspondence concerning this article should be addressed to Thane M. Erickson, Department of Psychology, Seattle Pacific University, 3307 3rd Avenue West, Suite 107, Seattle, WA 98119. E-mail:
[email protected] 893
894
ERICKSON, NEWMAN, AND PINCUS
actions and risk alienating others. In contrast, the well-adjusted individual uses a broad repertoire of interpersonal behaviors flexibly, acting dominant when required to take leadership positions, submissive when yielding to others is warranted, loving when appropriate, and even cold when required to set firm boundaries. Thus, within this theory, maladjusted persons are thought to exhibit interpersonal problems characterized by low variability of behavior across social interactions (Pincus & Gurtman, 2006). In addition to theoretical links between maladjustment and low variability in interpersonal behavior, various theories imply a link between poor adjustment and low variability in social perceptions of others. Cognitive (Beck, 1976), psychodynamic (Strupp & Binder, 1984), and attachment theorists (Bowlby, 1988) have described maladjusted individuals as possessing a limited range of ways of perceiving others. Although these authors did not explicitly discuss the role of variability, and in some cases biased perception may occur without reduced variability, these theorists’ comments imply relatively lower variability of perceptions (e.g., perceiving hostility in the behavior of hostile, neutral, and friendly others indicates a high mean level of perceived hostility with decreased variability of perceived hostility). Moreover, personality disorders are often described not only by inflexibility of behavior (American Psychiatric Association, 2000) but also by inflexibility of inner experience (Pincus, 1994). In contrast, healthy individuals are described as discriminating among (Cantor & Kihlstrom, 1987) and mindfully perceiving (Langer, 1989) a broad range of stimuli, including social encounters with others (Dekeyser, Raes, Leijssen, Leysen, & Dewulf, 2008). However, it is unknown whether variability in perceptions and variability of behavior correlate. In contrast to such theories about rigidity, another theoretical viewpoint describes dysfunction in terms of excessively high variability. Salient examples include the conceptualization of borderline personality disorder, which emphasizes fluctuating perceptions of others (e.g., splitting between seeing others as good vs. bad) and concomitant vacillation between warm and hostile behavior (American Psychiatric Association, 2000). Similarly, disorganized attachment in infants is defined as vacillating between approach and avoidance of a caregiver (Main & Solomon, 1986). Individuals prone to lability or excessively variable social behavior over time are thought to be overly reactive to the influence of situations (Leary, 1957; Paulhus & Martin, 1988). Empirical examples include studies linking poorer adjustment to high variability of traits, attachment styles, social expectations, or behavior across roles, relationships, or time (e.g., Block, 1961; Donahue et al., 1993; Foltz, Barber, Weinryb, Morse, & Chittams, 1999; La Guardia et al., 2000; Sheldon, Ryan, Rawsthorne, & Ilardi, 1997). However, Baird et al. (2006) found that associations between adjustment and intraindividual variability disappear once variables’ mean levels are controlled, casting doubt on the link between adjustment and high variability. Also, these studies did not measure the full range of social perceptions and behavior. A third theoretical perspective that links adjustment to variability suggests that the amount of cross-situational variability (i.e., high or low) is less important than whether such variability itself is appropriate to the situation. The theory of interpersonal complementarity provides an account of situationally appropriate variability. Specifically, dominant behaviors are hypothesized to elicit submission from others (and vice versa), whereas affiliation elicits affiliation and coldness pulls for coldness; complementarity im-
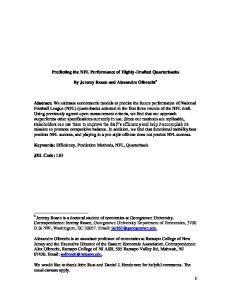
plies a flexible dance of give and take between individuals and is thought to sustain interaction (Carson, 1969; Kiesler, 1996). Friendly submission would be the complementary and therefore appropriate response to a partner’s friendly dominance. Several studies provide empirical evidence for complementarity as a normal phenomenon (e.g., Sadler & Woody, 2003; Tracey, 1994). In this context, measures of interpersonal rigidity and distress should be associated with lower complementarity, precisely the finding of a study examining the complementarity of participants’ responses to a few (1– 4) social scenarios or interactions (Tracey, 2005). However, it remains unknown (a) whether these findings would generalize to a broader range of interpersonal situations and (b) whether any relations between interpersonal distress or measures of rigidity and general intraindividual variability are simply due to low complementarity as this perspective might suggest. One reason to expect that complementarity may not fully capture whether intraindividual variability is adaptive is that socially skillful behavior sometimes requires not giving a complementary response, such as when a therapist must avoid the pull to respond in kind to a client’s hostility (Kiesler, 1996). In contrast to the theory that complementarity explains variability, maladjusted individuals may exhibit excessively low or high variability that results in their responses to others being less complementary. Remarkably little research has tested systematically whether maladjusted persons use a low, high, or complementary range of behaviors and whether purported measures of related constructs, such as rigidity, accurately reflect constrained behavioral variability. Various relevant personality measures exist (e.g., Bem, 1974; Snyder, 1974), but the most explicit attempts to measure the rigidity/flexibility construct come from the tradition of the interpersonal circumplex/circle, which conceptualizes social behaviors in a circular arrangement around two orthogonal dimensions, dominance versus submission and affiliation or friendliness versus coldness (see Figure 1; Wiggins, 1979). Calculation of one’s average scores on the dominance and affiliation dimensions provides both the direction of one’s general interpersonal tendency (e.g., toward friendly submission) and the extremeness or distance of scores from the center of the circle (or vector length). Vector length has been treated as a proxy for rigidity or one’s inability to adjust behavior to the situation. For example, an individual with a tendency toward friendly submissiveness and high vector length (see Figure 1) might rigidly use trusting or deferring behaviors to the exclusion of other behaviors. Measures from which vector length is calculated include the Interpersonal Adjective Scales (IAS; Wiggins, 1995), a measure using interpersonal trait adjectives (e.g., assertive, distant), and the Inventory of Interpersonal Problems–Circumplex Scales (IIP-C; Alden, Wiggins, & Pincus, 1990), a measure that requires respondents to rate their own behavioral excesses (e.g., “I try to please other people too much”) and deficits (“It’s hard for me to let other people know what I want”). Although vector length has been interpreted as an index of interpersonal rigidity for both measures (O’Connor & Dyce, 1997; Ruiz et al., 2004; Tracey, 2005; Vittengl, Clark, & Jarrett, 2003; Wiggins, Phillips, & Trapnell, 1989), measures of adjustment tend to correlate with it either nonsignificantly (e.g., Gurtman & Balakrishnan, 1998) or only indirectly (Tracey, 2005; Wiggins et al., 1989). Some theorists have proposed that vector length instead measures subjective differentiation of one’s traits or problems (i.e., high scorers clearly distin-
PREDICTORS OF INTRAINDIVIDUAL VARIABILITY
895
Dominance Friendly Dominance
Cold Dominance
Coldness
Friendliness Vector Length
Cold Submission
Friendly Submission
Submission
Figure 1.
The interpersonal circle with hypothetical scale scores and associated vector length.
guish which personality traits do and do not describe them, in contrast to those who endorse similar levels of all traits; Gurtman & Pincus, 2003). Most important, theoretical formulations of rigidity define rigidity in terms of a narrow range of behaviors (i.e., implying low variability across situations), but whether vector length predicts low intraindividual variability has not been tested directly. Paulhus and Martin (1987, 1988) developed an alternative measure of interpersonal rigidity/flexibility. The Battery of Interpersonal Capabilities (BIC) requires respondents to rate how capable they are of engaging in particular interpersonal behaviors when warranted by the situation (e.g., “How capable are you of being dominant when the situation requires it?”). The same question is asked for many behaviors around the interpersonal circle (being warm, submissive, cold, etc.). Endorsing the capability for all behaviors around the circle leads to high scores, originally assumed to reflect healthy interpersonal flexibility (the opposite of rigidity). However, markers of well-being correlate inconsistently with the BIC (Hofsess & Tracey, 2005; Paulhus & Martin, 1987, 1988), and it may simply measure interpersonal traits (Hofsess & Tracey, 2005). Moreover, as with vector length, it remains unclear whether such flexibility actually predicts the use of a broader range of behaviors across situations. Moskowitz and Zuroff (2004, 2005b) recently developed indices that systematically measure day-to-day variability of social behavior. They defined flux as the standard deviation of interpersonal circle behaviors (i.e., dominance, submissiveness, agreeableness, and quarrelsomeness) across social interactions. For example, an individual with high dominance flux might behave assertively in one situation but not in another; a person low in dominance flux would show little variability around his or her mean level of dominance (e.g., being moderately dominant in all interactions).
Similarly, high agreeableness flux would indicate an inconsistent level of friendliness. Thus, flux represents variability around the mean level of a particular type of interpersonal behavior. Spin, in contrast, reflects variability across different types of behaviors around the interpersonal circle (i.e., shifting from dominance to coldness to submission, etc.). For example, a distressed person might vacillate between different strategies for dealing with an interpersonal conflict, including attempts to comfort (affiliation), give direct advice (dominance), push the other person away (coldness or quarrelsomeness), and passively appease the other (submission). Moskowitz and Zuroff (2004, 2005b) found neuroticism to predict greater spin over 20 days of social interactions, validating their methodology for studying variability. However, to date no studies have tested whether measures of rigidity/flexibility or interpersonal problems predict these forms of variability in behavior or perceptions. Thus, a host of psychological theories explicitly or implicitly link psychosocial adjustment to intraindividual variability of social perceptions of others and interpersonal behavior. However, important questions about the links between interpersonal problems, purported measures of rigidity/flexibility, variability of perceptions, and variability of behavior remain unanswered. Accordingly, the present research tests whether interpersonal circle measures of rigidity/flexibility and interpersonal distress predict crosssituational variability of self-reported social behavior and perceptions of others. On the basis of recent research, we examined these processes in both hypothetical interpersonal scenarios involving imagining how one would respond (Study 1; e.g., Tracey, 2005) and naturalistic daily social interactions (Study 2; e.g., Moskowitz & Zuroff, 2004). To assess variability in social behavior and perceptions, we utilized flux on interpersonal dimensions of dominance and affiliation (fluctuation between dominance and submis-
ERICKSON, NEWMAN, AND PINCUS
896
sion or between affiliation and coldness), as well as spin, to capture nonredundant forms of broad variability on the interpersonal circle. Complementarity was measured with different methods in each study. The present research had four goals, which were accomplished by testing a series of structural equation models. The primary two structural (i.e., causal) models pertained to hypotheses about prediction of variability of perceptions and behavior (for conceptual models, see Figure 2 for flux and Figure 3 for spin); these models were conceptually the same across the studies of hypothetical (Study 1) and naturalistic (Study 2) interactions, although they used different measures of interpersonal behavior. A third model (see Figure 4) pertained to predicting complementarity and flux in Study 1 (because of the nature of the data, an alternative analytic strategy for testing hypotheses about complementarity was adopted in Study 2). These three models were examined separately because a single model would be visually cluttered, and individual paths would be difficult to interpret because of model complexity. The first goal was to examine the nature of social variability itself, including both the structure of intraindividual variability (i.e., are there separate factors for dominance flux and affiliation flux or only one general factor?) and whether different types of behavioral variability or different types of social perception variability would correlate. For example, would individuals who fluctuate frequently between dominant and submissive behavior tend to fluctuate between affiliation and coldness as well? We were also interested in whether variability of social perceptions and variability of behavior would correlate, which would suggest that interpersonal variability is a general personality tendency with multiple manifestations (e.g., Leary, 1957). We hypothesized the existence of latent factors for variability of behavior and perceptions, with the factors correlated (Figure 2). Because excessively high behavioral variability implies noncomplementary responses to others’ behavior, we predicted that behavioral variability would be inversely associated with complementarity (Figure 4).
Dominance Behavior Variability
Vector Length
Interpersonal Distress
Interpersonal Capabilities
Dominance Perceptual Variability
d1
Affiliation Perceptual Variability
d2
Affiliation Behavior Variability
d3
d4
Figure 2. Conceptual model with flux. Ovals represent latent variables (observed or measured variables are not represented here). Single-headed arrows reflect hypothesized direct effects, whereas double-headed arrows imply covariance. d ⫽ disturbance terms or unexplained variance of latent variables.
Vector Length
Behavior Spin
Interpersonal Distress
Perceptual Spin
d1
d2
Interpersonal Capabilities
Figure 3. Conceptual model with spin.
Our second goal was to examine whether purported measures of rigidity/flexibility predict intraindividual variability. Vector length scores (on the IIP-C Scales and the IAS) have historically been assumed to reflect interpersonal rigidity (i.e., low range of behavior across situations), whereas the BIC was designed to measure the opposite end of the spectrum— interpersonal flexibility. However, given the inconsistent evidence of validity for these measures as indicators of rigidity/ flexibility, as well as the theoretical rationale that vector length measures differentiation of traits rather than rigidity, we expected that these indices would not significantly predict flux (on dominance and affiliation dimensions) or spin of social perceptions and behavior across both imagined social scenarios (Study 1) and daily interactions (Study 2). However, on the basis of Tracey’s (2005) findings, we expected that vector length would negatively predict complementarity in participants’ responses to hypothetical interpersonal scenarios (Study 1; see Figure 4). Our third goal was to examine whether interpersonal distress would predict intraindividual variability and complementarity. Despite perspectives linking interpersonal maladjustment to high (e.g., Donahue et al., 1993), low (Leary, 1957), or noncomplementary (Tracey, 2005) variability, the relations between adjustment and intraindividual variability have yet to be understood (Fleeson & Leicht, 2006). Specifically, we used as an index of poor adjustment the mean level of interpersonal difficulties across a broad range of behavioral domains on the IIP-C, the most wellvalidated circumplex index of interpersonal distress (Gurtman & Balakrishnan, 1998). Because some extant studies have found a high level of maladaptive traits to correlate with intraindividual variability (e.g., Foltz et al., 1999; Moskowitz & Zuroff, 2005b) and because little empirical evidence supports the theory of interpersonal rigidity, interpersonal distress was expected to predict higher dimensional flux and spin of both perceptions and behavior (Figures 2 and 3) in both imagined social scenarios (Study 1) and naturalistic reports of daily interactions (Study 2). Consistent with Tracey (2005), distress was expected to negatively predict complementarity (Figure 4), which is normally considered adaptive (Carson, 1969). Although there may exist bidirectional relations between distress
PREDICTORS OF INTRAINDIVIDUAL VARIABILITY
Dominance Behavior Variability
Vector Length
Interpersonal Distress
897
d1
Complementarity
d2
Affiliation Behavior Variability
Interpersonal Capabilities
Figure 4.
d3
Conceptual model including flux and complementarity.
and intraindividual variability, we modeled variables related to variability as outcome variables rather than causes of distress because (a) many of the aforementioned theoretical writings (and some empirical research, such as Moskowitz & Zuroff, 2004) have portrayed variability as a by-product of maladjustment, and (b) like vector length and interpersonal capabilities, interpersonal problems are conceptualized as traitlike and therefore potential causal influences on variability. Our fourth goal was to examine mediational models. On the basis of theories positing that interpersonal perceptions causally influence social behavior (e.g., Beck, 1976; Bowlby, 1988; Mischel et al., 2002; Pincus, 1994; Strupp & Binder, 1984), we hypothesized that variability (flux and spin) of perceptions would partially mediate the associations between interpersonal distress and behavioral variability in both studies (see Figures 2 and 3). In line with the theory that noncomplementary behavior is neither always maladaptive nor the only type of interpersonal dysfunction (Kiesler, 1996), we expected that distress would predict behavior variability even with complementarity modeled as a mediator variable; complementarity would not fully account for this relation (Figure 4). Also, in the study of hypothetical interactions (Study 1), we tested an equivalent (i.e., mathematically similar) competing model in which behavior variability mediates the relation between distress and complementarity (because high or low variability may prevent complementary responding). On the assumption that interpersonal intraindividual variability is a genuine personality process with substantive links to adjustment, we hypothesized that our primary models (Figures 2 and 3) would fit well even when controlling separately for gender and mean levels (Baird et al., 2006) of interpersonal behaviors and perceptions.
Study 1 Methods Task Materials We first developed written interpersonal scenarios and behavioral response options to provide standardized hypothetical social interactions. Scenarios were abridged or combined versions of verbatim items from the Checklist of Interpersonal Transactions– Revised (Kiesler, 1987), a measure of social behaviors with circumplex properties (Tracey & Schneider, 1995). Each scenario portrayed a target other person in an interpersonal action toward the self. Two representative scenarios were chosen for each of eight types of social behavior, at two levels of intensity. For instance, the mild–moderate submissive scenario was “[He/she] waits for or follows your lead regarding issues to discuss or actions to pursue.” “[He/she] finds it almost impossible to take the lead or change the topic of conversation” reflected submissive behavior of extreme intensity. To broaden the range of interactions further, scenarios were presented for two types of relationships: friend and authority figure (e.g., employer or professor). To reduce burden, participants considered only a same-sex friend and authority figure. In total, 32 scenarios were used (i.e., 8 Types of Behavior ⫻ 2 Levels of Intensity ⫻ 2 Types of Relationships). Response options (see Table 1), each portraying a specific behavioral reaction to the other person, were inspired by the Checklist of Interpersonal Transactions–Revised and the 1982 Interpersonal Circle–Acts Version (Kiesler, 1985). Two response options were chosen for each class of behavior (e.g., cold), one at each of two levels of intensity (16 total). Instructions invited participants to imagine vividly a target other (e.g., friend) displaying each interpersonal act and then to select their most likely
ERICKSON, NEWMAN, AND PINCUS
898
Table 1 Study 1 Response Options for Interpersonal Scenarios Response option Type of behavior Dominant
Mild–moderate intensity
Extreme intensity
Express firm personal preferences Act resentful or mistrusting
Boss him or her around or refuse to yield Cold–dominant Be extremely suspicious or denounce him or her Cold Be irritable or Coldly refuse all quarrelsome cooperation Cold–submissive Act unsociable or Remain fearfully distant emotionally inhibited or totally detached Submissive Go along with his or her Act subservient or be preferences or very apologetic directions Friendly–submissive Show trust or confide in Be overtrusting, him or her flattering, or all forgiving Friendly Be warm or cooperative Be unconditionally supportive or superpolite Friendly–dominant Sociably disclose your Be highly disclosing or views dramatically expressive
behavioral response (repeat usage of responses permitted). For content validity, two interpersonal circle assessment experts independently categorized the response options on the basis of type of behavior and intensity level. They achieved acceptable initial interrater agreement ( ⫽ .60) and perfect agreement ( ⫽ 1.0) after 5 response options were revised. Calculation of variability scores. The calculation of dimensional flux in imagined social behavior required assigning values on the dominance and affiliation dimensions for each response option (cf. Tracey, 2005). Given that response options had been coded as reasonable markers for specific types of behavior, dominance and affiliation values were assigned to each one on the basis of the appropriate segment of the interpersonal circle, weighted on the basis of intensity level. For example, the mild–moderate dominant response option was assigned dimensional values of [0, 1] on the circle, whereas the extreme dominant response option (twice as far from the origin of the circle) was assigned values of [0, 2]. Response options for combinations of dominance and affiliation were assigned values on the basis of the Pythagorean theorem (e.g., mild–moderate friendly dominance at [.71, .71] is one unit from the circle origin). Dominance and affiliation flux were calculated as the standard deviation of levels of dominance or affiliation, respectively, across all response options chosen. Spin was calculated as circular standard deviation of all response options chosen, on the basis of a standard formula (Mardia, 1972).1 Flux and spin scores were created for imagined interactions with both a friend and an authority figure.2 Calculation of complementarity. On the basis of the theory of complementarity, which entails partners’ similar levels of affiliation (e.g., mutual friendliness) and opposite levels of dominance (e.g., one’s submission fits with the other’s dominance; Carson, 1969), we created dominance and affiliation values to represent the complementary response to each hypothetical scenario. Following
Tracey (2005), we calculated a complementary index as the distance between participants’ response to each scenario and the maximally complementary response, using the Pythagorean theorem. For instance, the complementary response to mild–moderate friendly dominance [.71, .71] would be mild–moderate friendly submission [.71, ⫺.71]; if the participant’s actual response reflected extreme submission [0, ⫺2], the distance between expected and actual responses would be [(.71 ⫹ .71)2 ⫹ (0 ⫹ 2)2]1/2. Scores were summed across all scenarios to create composite complementarity indices for friend and authority figure interactions. We subtracted the scores from zero so that high scores reflected higher complementarity.
Participants General psychology students at a state university were invited to participate in a study of social cognition for course credit (N ⫽ 288; 173 women, 115 men). Participant age ranged from 18 to 49 years (M ⫽ 20.41, SD ⫽ 3.02). The sample was 77% White, 7% Asian, 7% Black, and 4% Hispanic/Latino, with 1 American Indian student; in addition, 3% responded other, and there were 2 nonresponders.
Procedure Data were collected through a professional survey server on the Internet, a valid means of survey data collection (Gosling, Vazire, Srivastava, & John, 2004). Participants completed a demographic information survey, questionnaires (IAS, IIP-C, BIC), the interpersonal scenarios (two possible administration orders) with response options presented in random order, and a measure (Interpersonal Grid) for rating perceptions of the hypothetical other person in these scenarios.
Measures Interpersonal Grid (Moskowitz & Zuroff, 2005a). This measure is a rectangular grid of (9 ⫻ 9) squares with nine interpersonal descriptors as anchors around the perimeter (e.g., warm–agreeable, cold– quarrelsome). Respondents place an x on the grid to quantify their perceptions of another person’s social behavior along the 1 Dominance and affiliation scores were used to calculate the angular location on the interpersonal circle for each response option (or Interpersonal Grid perception). For instance, cold behavioral responses or perception of one’s partner as cold would result in an angular location of 180° (affiliation at 0°). Angular location is calculated as [tan⫺1(affiliation/ dominance) ⫻ 180/]. Angular location values were then used to calculate circular variance (S0), where i ⫽ the angular location of each response (see Mardia, 1972, pp. 15–18):
再冋冉 冘 冊 冉 冘 冊 册 冎 冒 2
n
S0 ⫽ 1 ⫺
cos i
i⫽1
2
n
⫹
sin i
1/ 2
n
i⫽1
Circular standard deviation (Spin) was calculated as [⫺2loge(1 ⫺ S0)]1/2. 2 Moskowitz and Zuroff (2004) also created pulse, a measure of variability (standard deviation) of vector length scores across behaviors over time (i.e., behaviors varying between low and high extremity or distance from the center of the interpersonal circle). We excluded pulse to avoid adding additional complexity to the article.
PREDICTORS OF INTRAINDIVIDUAL VARIABILITY
interpersonal dimensions of quarrelsomeness versus agreeableness (horizontal) and dominance versus submissiveness (vertical), with each dimension scaled ⫺4 to 4. In the present study, participants were asked to use the grid to rate how they would perceive their interaction partner in each of the hypothetical scenarios. Moskowitz and Zuroff (2005a) demonstrated good psychometric properties. Standard deviation scores for dominance and affiliation scores were summed separately, across all scenarios presented, to create flux scores for perceptions. Dominance and affiliation scores were used to calculate spin (see footnote 1). IAS (Wiggins, 1995). The IAS is a 64-item, eight-scale, selfreport circumplex measure of interpersonal traits (adjectives), with 8 Likert response options (1 ⫽ extremely inaccurate, 8 ⫽ extremely accurate). The measure showed adequate alpha coefficients in the present study, with scales ranging from .73 to .88. The IAS has demonstrated consistently excellent circumplex and psychometric properties (e.g., Gurtman & Pincus, 2000; Wiggins, 1995). We used only a vector length score; the point on the dimensions of dominance and affiliation that best captures an individual’s profile on eight scales is calculated, and vector length reflects the distance of this point from the center of the circle: Vector length ⫽ 关共dominance兲 2 ⫹ 共affiliation兲 2 兴 关1⁄ 2兴 IIP-C (Alden et al., 1990; Horowitz, Alden, Wiggins, & Pincus, 2000). The IIP-C is a 64-item circumplex measure of interpersonal problems varying in terms of dominance and affiliation (e.g., overly nurturant, unassertive, vindictive), with a 5-option Likert response format (0 ⫽ not at all, 4 ⫽ extremely). Scales exhibited adequate alpha coefficients in the present sample (.78 –.90). The IIP-C exhibits good psychometric and circumplex properties (Alden et al., 1990) and clinical validity (e.g., Ruiz et al., 2004). Overall mean, or elevation, scores and vector length scores were used in the study. BIC–Short Version (Paulhus & Martin, 1987, 1988). The short BIC is a 16-item measure of self-reported capabilities of using the full range of social behaviors (i.e., interpersonal flexibility), with a 7-point Likert scale (1 ⫽ not at all, 7 ⫽ very much). Items are summed to create an overall capability score (␣⫽ .80 in this sample). Initial evidence suggested a unique factor structure and links to adjustment (Paulhus & Martin, 1988). However, the BIC may simply possess dominance and affiliation dimensions plus a general factor, with the latter inconsistently related to adjustment (Hofsess & Tracey, 2005).
Results Overview We used structural equation modeling for analyses because it permits the simultaneous solution of a set of regression equations for postulated interrelationships (including prediction and mediation) and explicit modeling of measurement assumptions about latent variables (Bollen, 1989). The present study used AMOS 16.0 (Arbuckle, 2007) for structural equation modeling.
Hypothesized Models Predictor variables. Because IAS and IIP-C vector length have been interpreted as measures of rigidity, they were hypoth-
899
esized to share a latent factor; the models specified dual indicators for this exogenous (upstream) latent variable. We labeled this variable Vector Length rather than Rigidity because of the aforementioned questions about whether it measures rigidity per se.3 Whereas regression models often assume perfect reliability in predictors, we explicitly modeled reliability of single-indicator exogenous personality variables (i.e., mean of interpersonal problems and BIC total score) by assigning error values of each variable’s observed variance multiplied by sample-derived random error estimates (1 ⫺ Cronbach’s alpha), as recommended by Kline (2005). We refer to these latent variables as Interpersonal Distress (Distress) and Interpersonal Capabilities (Capabilities). We specified predictor variables as freely covarying. Predicted variables. Expecting common variance underlying forms of intraindividual variability, we modeled latent factors with dual indicators (i.e., ratings for friend and authority figure) for all endogenous or downstream flux/spin constructs (e.g., hypothetical latent Dominance Behavior Variability). We also tested an alternative measurement model in which all observed behavior flux variables (or perceptual flux) loaded on a single factor. Relations between variables. For the model with flux variables (Figure 2), we assumed that variability is a general personality process and specified covarying disturbance (latent residual) variables for latent dominance and affiliation variability, for both perception (d1 with d2) and imagined behavior (d3 with d4; see Figure 2); individuals that tend to fluctuate on the dominance dimension were expected to fluctuate on the affiliation dimension. We modeled correlated errors between dominance and affiliation flux for both friend and authority ratings, expecting similar rater effects for both dimensions on the single-item Interpersonal Grid. Flux and spin of interpersonal perception (Interpersonal Grid) were modeled as partial mediators of relations between Distress and behavioral flux/spin (Figures 2 and 3). Consistent with our hypotheses, we modeled only Distress as predicting each form of perceptual and behavior variability. For the model with complementarity (Figure 4), we modeled Vector Length as predicting complementarity and Distress as predicting complementarity and Dominance/Affiliation Behavior Variability. Given space limitations, we provide figures only for final models.
Assumptions for Multivariate Analyses Inspection of sample descriptive statistics (e.g., univariate skew and kurtosis, multivariate kurtosis, bivariate scatterplots) suggested normality and little evidence of curvilinearity. Twenty significant multivariate outliers were detected; because these cases possessed low IAS Vector Length and high Interpersonal Grid Dominance flux (friend) scores but otherwise appeared normal, we retained them. All variables were multiplied by a constant to provide the even scaling required for structural equation modeling. Maximum likelihood estimates were utilized to deal with missing data. 3 On the suggestion of a reviewer, we calculated vector length scores on the BIC; however, this index did not load significantly on the same latent factor as vector length for interpersonal traits and problems, so we omitted it.
900
ERICKSON, NEWMAN, AND PINCUS
Model Estimation for Flux Measurement model. We first tested a relatively saturated model with all latent predictors, perceptual variability factors, and behavioral variability factors correlated. This strategy provided a test of the measurement model (factor structure) to avoid confounding the fit of the measurement model and structural model (Kline, 2005). Structural path parameters were not examined until reaching a final overall model. The initial test of the measurement model suggested good fit (see Table 2 for all Study 1 model fit indices and modifications). Means, standard deviations, and intercorrelations of study variables are reported in Table 3. Alternative measurement model. We tested an alternative model in which all perceptual flux variables loaded on a single factor and all behavioral flux variables loaded on another factor, with these two factors correlated. This model showed very poor fit, inferior to the primary measurement model (Akaike information criterion [AIC] ⫽ 284.47 vs. 163.26 for the previous model; lower AIC scores represent better fit among alternative nonhierarchical models). Thus, the preferred model suggests that dimensional forms of flux are highly related but not redundant measures of the same process. Model modifications. The overall baseline model (Model 1; structural model in Figure 2) showed acceptable fit. However, to ensure that we did not prematurely rule out relations between predictor variables and intraindividual variability, we also conducted several theory-based, focused tests of specific predictor paths. Specifically, the addition of paths from Capabilities to both Perceptual Variability factors or Behavior Variability factors, or from Vector Length to Behavior Variability factors did not significantly improve model fit, ⌬2(2) ⫽ 0.62 to 3.77, ns. However, freeing paths from Vector Length to Dominance and Affiliation Perceptual Variability (Model 2) significantly improved model fit, so these paths were retained. To test whether different types of perceptual and behavioral variability might be related, consecutively added paths from Dominance Perceptual Variability to Affiliation Behavior Variability and from Affiliation Perceptual Variability to Dominance Behavior Variability were examined; neither improved model fit: relative to baseline Model 1, ⌬2(1) ⫽ 0 and 1.49, ns. Thus, Model 2 was the final general model (see Figure 5 for parameter estimates). Examination of measurement model paths. Nonsignificant covariances between Vector Length and Capabilities ( p ⫽ .79) and e9 and e11 ( p ⫽ .13) were retained because of standard assumptions of correlated predictors and measurement assumptions, respectively. As expected, all observed measures of variability had substantial standardized weights on latent factors (⬎.58, all ps ⬍ .001). Vector Length correlated with Distress; Distress correlated negatively with Capabilities. The disturbances for Dominance and Affiliation Perceptual Variability, as well as for Behavior Variability variables, correlated highly. In other words, individuals with high flux on one dimension showed high flux on the other dimension, across two types of relationships. This result, as well as finding that our measurement model fit well, supported our hypothesis of interpersonal variability as a latent process on distinct but related interpersonal dimensions. Examination of structural model. Vector Length positively predicted variability on both dimensions for social perception, contrary to predictions.4 Distress predicted higher variability of
both dimensions for imagined social behavior, as hypothesized, but negatively predicted variability of both dimensions for social perception, contrary to hypotheses. Affiliation Perceptual Variability predicted Affiliation Behavior Variability, as expected. We retained the path from Dominance Perceptual Variability to Dominance Behavior Variability despite nonsignificance, given that deletion of nonsignificant paths is not mandatory during the initial model-building phase (Kline, 2005). Providing partial support for hypothesized cognitive mediation, in Model 2 Distress had a significant standardized indirect effect on Affiliation Behavioral Variability through Affiliation Perceptual Variability ( ⫽ ⫺.07; Sobel z ⫽ ⫺2.05, p ⫽ .05).5 However, removing the paths between Distress and Dominance Behavior Variability, ⌬2(1) ⫽ 26.42, p ⬍ .001, or Affiliation Behavior Variability, ⌬2(1) ⫽ 8.50, p ⬍ .01, significantly decreased model fit relative to Model 2, suggesting that Perceptual Variability did not fully mediate these relations. Controlling means. Because variables’ mean levels and standard deviations are often correlated (Baird et al., 2006; Kashdan, Uswatte, Steger, & Julian, 2006), we reanalyzed the final general model (Model 2) with residualized flux variables (unstandardized residual variance scores of flux variables after controlling for mean levels; Model 3). After constraining to metric equivalence the loadings on Affiliation Behavior Variability, the model showed acceptable fit. The Affiliation Perceptual Variability to Affiliation Behavior Variability path, and therefore the larger mediation pathway, was no longer significant. However, all other paths and loadings remained significant, suggesting the robustness of the present results even after controlling for means. Controlling gender. To rule out gender effects, we tested Model 2 constrained to equality across gender groups. As a baseline, we simultaneously estimated model parameters for Model 2 across gender groups with all parameters free to vary. After fixing both factor loadings to one (metric equivalence) to deal with a local underidentification problem of Affiliation Behavior Variability, the model fit well (Model 4). Constraining measurement factor loadings (Model 5) and structural regression paths (Model 6) to equality across groups did not lead to significant fit erosion from Model 4, suggesting that findings applied similarly to both genders. Thus, consistent with predictions, results were not explainable by factors such as mean levels of social perceptions/behavior or gender.
Model Estimation for Flux and Complementarity Measurement model. To test whether interpersonal complementarity accounted for the relations between predictors and flux variables, we first fit a relatively saturated measurement model (Model 7) with all latent constructs correlated (excluding error 4
We note that when interpersonal traits and problems were analyzed separately, vector length for both measures positively predicted variability of perceptions, although with lower magnitude than when using the latent Vector Length factor as a predictor. 5 Testing this model with multivariate outliers deleted yielded the same final model with only one substantive difference: Dominance Perceptual Variability predicted Affiliation Behavior Variability ( ⫽ ⫺.25, p ⬍ .05). Given high agreement between these analyses and lacking a conceptual rationale for deletion of outliers, we report results for the larger sample.
PREDICTORS OF INTRAINDIVIDUAL VARIABILITY
901
Table 2 Study 1 Flux Model Fit Indices Model
2
df
p
⌬2
⌬df
⌬p
NC
CFI
RMSEA
RMSEA CI
M0a: Measurement model M0b: Alternate measurement model M1: Baseline model M2: M1 plus paths from Vector Length to Perceptual Variability factors M3: M2 ⫹ with all variability variables residualized (means controlled) M4: M2 across gender groups M5: M4 ⫹ constrained factor loadings across genders M6: M5 ⫹ constrained structural paths across genders M7: Measurement model for model including complementarity M8: Model including complementarity M9: Equivalent model including complementarity
49.26 192.47 65.07
33 44 43
.03 .00 .02
— — —
— — —
— — —
1.50 4.37 1.52
.98 .81 .97
.04 .11 .04
.01–.06 .09–.12 .02–.06
57.20
41
.05
7.87
2
⬍.025
1.40
.98
.04
0–.06
65.01 102.03
42 83
.01 .08
0.06 —
1 —
ns —
1.55 1.23
.97 .98
.04 .03
.02–.06 0–.05
106.68
87
.08
4.65
4
ns
1.23
.97
.03
0–.05
114.57
94
.07
12.54
11
ns
1.22
.97
.03
0–.04
13.68 19.44
18 23
.75 .68
— —
— —
— —
0.76 0.85
1.00 1.00
0 0
0–.04 0–.04
22.06
23
.52
—
—
—
0.96
1.00
0
0–.05
Note. Nonsignificance of chi-square often indicates good fit, but it may be significant in large samples even with good fit. Dashes indicate specific models that were not tested for change in fit relative to other models. ⌬2 ⫽ change in chi-square; ⌬df ⫽ change in degrees of freedom relative to baseline models; ⌬p ⫽ significance of change in fit; ns ⫽ not significant at p ⬍ .05; NC ⫽ normed chi-square (values ⬍ 2 conventionally reflecting acceptable fit); CFI ⫽ comparative fit index (good fit at values ⬎ .90); RMSEA ⫽ root mean square error of approximation (values ⬍ .06 indicating good fit); CI ⫽ 90% confidence interval (values ideally at 0 and ⬍ .10 for lower and upper bounds, respectively).
terms; see Table 2). Because Flux and Complementarity indices were calculated from the same interpersonal scenarios, we modeled correlated error terms for relevant variables (see note for Figure 6). The model fit well, attesting to the soundness of modeling a latent Complementarity factor. Structural model. The hypothesized model examining relations between predictors, flux, and complementarity (Figure 4) showed good fit (Model 8; see Table 2). We note that the addition of a path from Capabilities to Complementarity did not increase fit, ⌬2(1) ⫽ 0.01, ns, suggesting no reason to include it. Distress inversely predicted Complementarity as hypothesized and had significant indirect effects on Dominance (Sobel z ⫽ 2.28, p ⫽ .023) and Affiliation Behavior Variability (Sobel z ⫽ 2.59, p ⬍ .001). We tested whether Complementarity fully mediated the effects of Distress on Dominance and Affiliation Behavior Variability. Dropping the path from Distress to Dominance Behavior Variability resulted in significant erosion of fit, ⌬2(1) ⫽ 25.82, p ⬍ .001, whereas the path to Affiliation Behavior Variability did not, ⌬2(1) ⫽ 1.62, ns. Thus, the final model (Figure 6) suggests that Complementarity only partially explains the sorts of maladaptive variability that individuals may experience. Contrary to hypotheses and Tracey’s (2005) findings, Vector Length positively predicted Complementarity.6 We also tested an equivalent model in which Complementarity was predicted by, rather than predicted, both forms of Behavior Variability. Model fit (Model 9) was similar to that of the previous model (Model 8), but the modified structural regression paths yielded different coefficients. In this model, all associations remained significant and had the same sign except for paths from Distress ( ⫽ ⫺.04, ns) and Dominance Behavior Variability ( ⫽ ⫺.15, ns) to Complementarity; also, the path from Distress to Affiliation Behavior Variability became significant ( ⫽ .18, p ⬍ .05). Removing the Distress to Complementarity path did not significantly reduce model fit, ⌬2(1) ⫽ 0.29, ns, suggesting full
mediation between Distress and Complementarity by Affiliation Behavior Variability (standardized indirect effect of  ⫽ ⫺.18; Sobel z ⫽ 4.26, p ⬍ .001), consistent with our perspective that inordinate amounts of behavioral variability may make it difficult to respond in a complementary manner to others’ behavior.
Model Estimation for Spin For models with spin as the criterion, spin with a friend and an authority figure loaded on a joint factor for Behavior but not for Perceptions. Separate friend/authority models found no relations between predictors and spin; as a result, associated statistics are not reported. However, Table 3 shows that Spin and Complementarity were negatively correlated for both friend and authority figure scenarios, providing evidence that excessive variation between different types of interpersonal behaviors is inconsistent with appropriate responses to others’ behavior.
Discussion Study 1 investigated vector length, interpersonal capabilities, and interpersonal distress as predictors of variability in social perceptions and imagined behavior, as well as complementarity, in response to written interpersonal scenarios. For flux, measurement model fit supported our first hypothesis of latent dimensional variability factors of behavior and perceptions underlying ratings with a friend and authority figure. The model supported our hypothesis that individuals who are prone to vary do so broadly in both behavior and perceptions and that this variability occurs along correlated but nonredundant latent interpersonal circle dimensions of dom6 The model with complementarity and flux also fit well when controlling for mean levels of imagined behavior and was not moderated by gender.
ERICKSON, NEWMAN, AND PINCUS
902
Table 3 Intercorrelations, Means, and Standard Deviations for Study 1 Variables Variable
1
2
1. BIC 2. IAS vector length 3. IIP-C vector length 4. IIP-C mean 5. IG dominance flux (friend) 6. IG affiliation flux (friend) 7. IG spin (friend) 8. IG dominance flux (authority) 9. IG affiliation flux (authority) 10. IG spin (authority) 11. IS dominance flux (Friend) 12. IS affiliation flux (friend) 13. IS spin (friend) 14. IS dominance flux (authority) 15. IS affiliation flux (authority) 16. IS spin (authority) 17. Complementarity (friend) 18. Complementarity (authority) M SD
— ⫺.02
—
⫺.01 ⫺.13ⴱ
.41ⴱⴱ .20ⴱⴱ
— .25ⴱⴱ
.08
.05
.10 ⴱ
3
†
.11 .12 ⫺.10 ⫺.05 .06
.10
.03
.02
.07
⫺.12 ⫺.07 ⫺.07 ⫺.05
⫺.03 3.62 0.57
.02 ⫺.06
⫺.06 ⫺.12ⴱ ⫺.04
.00 .13 1.01 0.54
.01 ⫺.02
.05
†
.01
.10 ⫺.13ⴱ
.10
⫺.05 .02 ⫺.01 ⫺.08
ⴱ
.14 0.70 0.38
5
ⴱ
6
7
8
9
10
11
12
13
14
15
16
17
18
— ⫺.24ⴱⴱ
.03
.04 .01 .01 ⫺.01 .00
4
—
ⴱⴱ
.56ⴱⴱ .17ⴱ
— .21ⴱⴱ
⫺.22
ⴱⴱ
ⴱⴱ
ⴱⴱ
.13ⴱ
⫺.26 ⫺.03
ⴱⴱ
ⴱⴱ
ⴱ
⫺.20 ⫺.09
.66
ⴱⴱ
.44 .20ⴱ
.43
.71 .19ⴱ
— .53ⴱⴱ .28ⴱⴱ
.20 .15ⴱ
— .25ⴱⴱ
.25
ⴱⴱ
.12 .06
†
.26
ⴱⴱ
⫺.03
⫺.03
.06 ⫺.03
⫺.03
ⴱ
⫺.08 ⫺.04
⫺.10 .03
.07 ⫺.05 .03 .04
⫺.05 .15ⴱ
.15 ⫺.03
⫺.14 ⫺.11 ⫺0.02 0.73
ⴱ
⫺.09 .02 .01
⫺.13 .17 .01
.20
ⴱⴱ
.20 3.03 0.74
ⴱⴱ
ⴱ
—
ⴱ
⫺.02 ⫺.09 .13 .10
ⴱ
ⴱ
.01 .03
.14 .14ⴱ
⫺.02
.10 3.31 0.66
⫺.12 1.68 0.37
ⴱ
.06
.17 †
.20 2.98 0.79
⫺.10
ⴱⴱ
.04 .02 3.06 0.81
— ⫺.01 .04 .12ⴱ .07 .11 .23ⴱⴱ
.07 1.66 0.36
.17ⴱ .25ⴱⴱ
— .50ⴱⴱ
ⴱⴱ
ⴱⴱ
.39 †
.04
—
.25
— .16ⴱ
—
ⴱⴱ
ⴱⴱ
.50 .23ⴱⴱ
ⴱⴱ
.37 .40ⴱⴱ
.25ⴱⴱ .25ⴱⴱ
— .42ⴱⴱ
⫺.45
ⴱⴱ
⫺.46
ⴱⴱ
⫺.39
ⴱⴱ
⫺.20
ⴱⴱ
⫺.32
ⴱⴱ
⫺.23 2.65 0.58
ⴱⴱ
⫺.39 3.11 0.57
ⴱⴱ
⫺.29 1.54 0.37
ⴱⴱ
⫺.49 2.87 0.63
ⴱⴱ
⫺.46 3.03 0.62
ⴱⴱ
.24 .11†
— ⫺.15ⴱ ⫺.30 1.46 0.43
ⴱⴱ
— .46ⴱⴱ — ⫺6.08 ⫺6.16 0.31 0.47
Note. Means and standard deviations reflect transformed scores. BIC ⫽ Battery of Interpersonal Capabilities; IAS ⫽ Interpersonal Adjectives Scales; IIP-C ⫽ Inventory of Interpersonal Problems–Circumplex scales; IG ⫽ Interpersonal Grid; IS ⫽ interpersonal scenarios. † p ⬍ .07. ⴱ p ⬍ .05. ⴱⴱ p ⬍ .001.
inance and affiliation. However, perceptual variability around the interpersonal circle (spin) may be independent for interactions with friends and authority figures. Capabilities predicted neither flux nor spin variables, contrary to the idea that self-reported interpersonal capabilities imply a wide range of perceptions or behaviors utilized. Similarly, Vector Length did not predict restricted behavioral variability in flux or spin. Vector Length did, however, unexpectedly predict greater variability in flux for perceptions for both dominance and affiliation. Rather than demonstrating a rigid or low range of variability in perceptions, high-Vector Length individuals perceived a broader distribution of interpersonal scenario content with regard to shades of dominance and affiliation, a potentially adaptive tendency (Chiu, Hong, Mischel, & Shoda, 1995). Contrary to expectations, those with high Distress scores showed a narrowed or low range of perception when presented with scenarios varying on dominance and affiliation, even with mean levels controlled. Interpersonally distressed individuals thus appeared to demonstrate a form of rigid (Pincus, 1994) or biased cognition, rather than chaotic or vacillating perceptions. However, this form of bias differs from standard studies of mean difference from a criterion (e.g., Erickson & Newman, 2007), which omit information about variability. The findings imply greater social stimulus discrimination in those with less distress, consistent with the theory of discriminative perception as a contributor to social competence (Morrison & Bellack, 1981). As hypothesized, those with high Distress scores varied more widely on both dimensions in how they thought they would re-
spond to the spectrum of others’ behavior. Whereas neuroticism has been shown to predict variability in actual social behavior over time (cf. Moskowitz & Zuroff, 2004, 2005b), our results extend such fluctuation to the level of mental representations of how individuals believe they are most likely to respond to others. Distress had indirect effects on Affiliation Behavior Variability through Affiliation Perceptual Variability, supporting the hypothesis of partial cognitive mediation. Although not supported for all personality– behavior paths, this result remains noteworthy given the distal nature of the variables. However, because this path became less significant after means were controlled, it requires further replication; this was the only effect that changed, demonstrating that the processes examined cannot all be explained by mean-level variance. Last, results with models examining Complementarity attest to it being a generally adaptive form of interpersonal variability. As hypothesized, highly distressed individuals were low in complementary responses, and high levels of behavioral variability (flux on both dimensions and spin) were associated with low Complementarity as well; individuals with highly variable behavior may vacillate far outside of the normal variability of give-and-take interaction. Similarly, zero-order correlations (Table 3) showed that Complementarity indices correlated with perceiving a broader range of dominance in interpersonal stimuli. However, Complementarity mediated relations between Distress and Behavioral Variability only for the Affiliation dimension, showing that general intraindividual variability of a social nature is an important process itself, aside from appropriate matching to the others’ behavior. In addition, a competing model in which Behavioral
PREDICTORS OF INTRAINDIVIDUAL VARIABILITY
e1
e2
e5
e6
IIP-C VL
IAS VL
IS Dominance Flux (Friend)
IS Dominance Flux (Authority)
.59
.68
.58
Dominance Behavior Variability
Vector Length .25
.82 .36
Dominance Perceptual Variability
.43
.81
Interpersonal Distress
d3
IG Dominance Flux (Friend)
e9
IG Dominance Flux (Authority)
e10 .39
d1
-.39 -.37
.48
.58
d2
.29 .83
.97
Affiliation Perceptual Variability
IIP-C Mean -.15
e3
.68
.06
.23
-.01
903
.85
.23
IG Affiliation Flux (Friend)
e11
IG Affiliation Flux (Authority)
e12
.19
Interpersonal Capabilities .90
BIC e4
.77
Affiliation Behavior Variability
d4 .62
IS Affiliation Flux (Friend)
IS Affiliation Flux (Authority)
e7
e8
Figure 5. Hypothetical scenarios (Study 1) final general model with standardized parameter estimates. Circles/ovals represent latent variables, and rectangles represent measured variables. Single-headed arrows reflect direct effects, whereas double-headed arrows imply covariance. e ⫽ error terms (measurement error plus other unexplained variance) for measured variables; d ⫽ disturbance terms or unexplained variance of latent variables; IIP-C ⫽ Inventory of Interpersonal Problems–Circumplex scales; VL ⫽ Vector Length; IAS ⫽ Interpersonal Adjective Scales; IS ⫽ interpersonal scenarios; IG ⫽ Interpersonal Grid; BIC ⫽ Battery of Interpersonal Capabilities. All factor loadings were significant at p ⬍ .001. All structural paths and covariances were significant at p ⬍ .05, with the exception of covariances between Vector Length and Capabilities, as well as e10 and e12 ( p ⫽ .12).
Variability leads to Complementarity was equally plausible mathematically, requiring theoretical considerations to dictate model choice. We believe it most plausible that interpersonal distress leads to inordinate behavioral variability (e.g., using multiple and discrepant social strategies to manage distress), which thereby limits the likelihood of providing complementary responses to others, although confirmation of this perspective must await future studies that manipulate behavior experimentally. Finally, contrary to expectations, individuals scoring high on Vector Length gave more complementary responses to hypothetical scenarios, providing further evidence that the index need not measure a dysfunctional trait.
Study 2 Overview Whereas Study 1 utilized standard scenarios as criterion variables, Study 2 examined variability of social behavior and perceptions across naturally arising social interactions in a less con-
trolled, but more ecologically valid diary study. The present study was modeled after existing diary studies (e.g., Moskowitz & Zuroff, 2004), but with Internet-based diary entries.
Methods Participants Participant age deviated little from age in Study 1: M ⫽ 20.47, SD ⫽ 3.32 (range 18 – 49). A total of 192 participants met data retention criteria (132 women, 57 men, 3 not indicating gender). The sample was 77% White, 10% Asian, 5% Black, and 3% Hispanic/Latino, with 1 American Indian; in addition, 3% responded other, and 2% were nonresponders.
Procedure After completing Study 1, participants were invited into a 1-week study of daily social interactions for course credit. Participants were instructed (largely on the basis of Wheeler & Nezlek,
ERICKSON, NEWMAN, AND PINCUS
904 e1
e2
e5
e6
IIP-C VL
IAS VL
IS Dominance Flux (Friend)
IS Dominance Flux (Authority)
.58
.69
.57
Dominance Behavior Variability
Vector Length
.67
d1
.31 .36
-.38
.36
.51 -.02
Interpersonal Distress
-.27
Complementarity Index (Friend)
e7 .28
Complementarity Complementarity .86 Index (Authority)
.97
e8
d2
IIP-C Mean -.14
-.73
e3
Affiliation Behavior Variability
Interpersonal Capabilities .90
BIC e4
.59
d3 .81
IS Affiliation Flux (Friend)
IS Affiliation Flux (Authority)
e9
e10
Figure 6. Hypothetical scenarios (Study 1) final model including flux and complementarity. e ⫽ error terms (measurement error plus other unexplained variance) for measured variables; d ⫽ disturbance terms or unexplained variance of latent variables; IIP-C ⫽ Inventory of Interpersonal Problems–Circumplex scales; VL ⫽ Vector Length; IAS ⫽ Interpersonal Adjective Scales; IS ⫽ interpersonal scenarios; BIC ⫽ Battery of Interpersonal Capabilities. All factor loadings were significant at p ⬍ .001. All structural paths and covariances were significant at p ⬍ .05, with the exception of Vector Length and Capabilities (the covariance between d1 and d3 neared significance, p ⫽ .07). Because Flux and Complementarity indices were calculated from the same interpersonal scenarios, we also modeled covariances for the following errors: e5 and e7 (r ⫽ ⫺.44), e6 and e8 (r ⫽ ⫺.61), e7 and e9 (r ⫽ ⫺.34), and e8 and e10 (.22), all ps ⬍ .001, except between e8 and e10 ( p ⫽ .58). We omitted visual presentation of these covariances from Figure 6 for ease of presentation.
1977) to use one diary form on the study Web site per relevant interaction, defined as any encounter of 5 min or longer in which the participants attended to and adjusted their behavior in response to one another. Instructions emphasized logging onto the Web site to record at least five interactions daily, preferably distributed across the day. To limit retrospective bias, they were directed to make only same-day entries. To increase adherence, participants were told that their compliance might be monitored through time stamps of their entries. A total of 236 participants entered Study 2. However, we expected a range of participant compliance in completing the assigned number of records, and we included a priori those with at least 25 interaction records (N ⫽ 192) to reliably sample crosssituational variability. Included participants (M ⫽ 35.13 records, SD ⫽ 4.79) differed from excluded participants only by lower IIP-C mean scores, t(224) ⫽ ⫺3.56, p ⬍ .001. Unfortunately, some high-Distress participants provided too few records to assess variability, limiting our ability to know whether low record numbers reflected lack of interactions or distress interfering with adherence to instructions.
Measures Predictors. All participants had previously completed the BIC, IAS, and IIP-C. Social perceptions. Participants rated each interaction partner on the Interpersonal Grid. Social behavior. To assess interpersonal behavior for each interaction, participants completed social behavior checklists (the Social Behavior Inventory [SBI]; Moskowitz, 1994). A total of 46 items measure four scales: dominant (e.g., “I made a suggestion”), submissive (e.g., “I avoided taking the lead or being responsible”), agreeable (e.g., “I smiled and laughed with others”), and quarrelsome (e.g., “I confronted the other about something I did not like”); two pairs of scales share an item. Moskowitz (1994) demonstrated reliability, convergent validity with other interpersonal circle measures, and circumplex structure. Following Moskowitz and Zuroff (2004), we used four shortened, 12-item versions of the SBI with three items for each of the four cardinal social behaviors (e.g., dominant). Each time a participant logged onto the Web site, a new version of one of these four forms was triggered, ensuring
PREDICTORS OF INTRAINDIVIDUAL VARIABILITY
broad sampling of behaviors while reducing response sets. Summing the number of items checked (0 to 3) for each behavior scale yields scale scores. Scale scores were ipsatized to control for individual differences in overall item endorsement (i.e., within each interaction, subtracting the mean score across behavior scales from each scale). Calculation of variability scores. SBI flux scores for the scales of dominant, submissive, agreeable, and quarrelsome behaviors were calculated as standard deviation of each scale across all available interactions. Flux for interpersonal (Grid) perceptions was calculated in the same fashion as in Study 1. Spin for perceptions and spin for behavior were calculated as previously described.
Results Hypothesized Models The Study 2 flux model paralleled the Study 1 model in predictor variables, dominance and affiliation flux of perception as mediators between predictors and behavioral flux, and correlated disturbances for dominance and affiliation flux variables. Single indicators for flux of perceptions were used. We specified SBI dominance and submission flux to load on a latent Dominance Behavior Variability factor and specified agreeableness and quarrelsomeness flux to load on a latent Affiliation Behavior Variability factor. This permitted a test of whether individuals fluctuate along the primary interpersonal dimensions, as when we examined variability in imagined behavior (Study 1). As in Study 1, we tested a relatively saturated measurement model. We then tested our hypothesized general model, followed by targeted and theory-guided testing of particular paths in the structural model. The model for spin used single indicators for spin of perceptions and behavior, with a path specified between these variables (Figure 3).
Assumptions for Multivariate Analyses Sample descriptive statistics suggested uni/multivariate normality and other requirements were met (Kline, 2005). Variable scaling and missing data procedures were identical to those in Study 1.
Model Estimation for Flux Model Measurement model. Means, standard deviations, and intercorrelations of study variables are reported in Table 4. For flux (N ⫽ 192 for Study 2 analyses), the saturated measurement model fit well (see Table 5 for all model fit indices), supporting the hypothesis of latent variability factors. Alternative measurement model. Parallel to Study 1, we fitted an alternative model in which all behavior flux variables loaded on one latent factor and both perceptual flux variables loaded on a latent factor, with these factors allowed to covary. This model showed fit (AIC ⫽ 127.14) somewhat inferior to the original measurement model (AIC ⫽ 120.84). Model modifications. The general baseline model showed acceptable fit. Although this model was consistent with our expectations about Vector Length and Capabilities not significantly predicting intraindividual variability, we tested pairs of paths from
905
each of them to both Perceptual or Behavioral Variability factors given the theory-based nature of these measures; none of these tests pointed to a significant increase in fit as a result of including additional paths, ⌬2(2) ⫽ 0.39 to 5.78, ns. However, the addition of a path from Affiliation Perceptual Flux to Dominance Behavior Variability significantly improved model fit, leading to our final general model (Model 2).7 In Model 2, all indicators had acceptable factor loadings (⬎.59, ps ⬍ .001; see Figure 7 for standardized parameter estimates). Distress correlated positively with Vector Length and negatively with Capabilities, whereas Vector Length and Capabilities were unrelated. Consistent with predictions, Flux on Dominance and Affiliation correlated positively for both social perception and behavior. Structural model. More substantively, Distress positively predicted variability of social perceptions and behavior on both dominance and affiliation dimensions, as expected. Neither Capabilities nor Vector Length predicted variability in perceptions or behavior. Consistent with the notion of cognitive mediation of behavioral variability, Dominance Perceptual Flux perception predicted Dominance Behavior Variability, and Affiliation Flux of perception predicted variability on both dimensions for behavior. Affiliation Flux (Sobel z ⫽ 2.06, p ⫽ .039) and Dominance Flux (marginally; Sobel z ⫽ 1.72, p ⫽ .085) of perceptions partially mediated the effects of Distress on Dominance Behavior Variability, with a combined standardized indirect effect of  ⫽ .10. Distress had an indirect effect on Affiliation Behavior Variability through Affiliation Flux of perception,  ⫽ .10, Sobel z ⫽ 2.45, p ⫽ .01. However, the model did not support the idea of full cognitive mediation in that omitting paths from Distress to Dominance, ⌬2(1) ⫽ 13.43, p ⬍ .001, or Affiliation Behavior Variability, ⌬2(1) ⫽ 7.50, p ⬍ .01, significantly reduced model fit. Controlling means. We reanalyzed the final general model (Model 2) with (unstandardized) residualized flux variables. The model showed acceptable fit. All factor loadings and structural paths remained significant except for the path from Distress to Affiliation Flux of perceptions, demonstrating overall model robustness even after controlling for means. Controlling gender. In tests of gender moderation, the multigroup baseline model (Model 4) of Model 2 across gender groups fit well. Constraining measurement factor loadings (Model 5) and structural paths (Model 6) to equality across groups did not result in significant fit loss relative to Model 4, attesting to measurement invariance and generalizability across genders as hypothesized.
Complementarity Unlike the standardized stimuli of Study 1, the uncontrolled nature of social interactions in Study 2 did not permit examination of objective complementarity. However, we were able to examine whether Vector Length, Capabilities, and Distress predicted a subjective form of complementarity: the within-person association between perceptions of others’ and one’s own behavior during an 7
Study 2 model (Model 2) fit even when controlling for number of interaction records completed, 2(30) ⫽ 36.33, p ⫽ .20, normed chisquare ⫽ 1.21, comparative fit index ⫽ .99, root mean square error of approximation ⫽ .03 (0 –.07).
ERICKSON, NEWMAN, AND PINCUS
906
Table 4 Intercorrelations, Means, and Standard Deviations for Study 2 Variables Variable
1
2
1. BIC 2. IAS vector length 3. IIP-C vector length 4. IIP-C mean 5. IG dominance flux 6. IG affiliation flux 7. IG spin 8. SBI agreeableness flux 9. SBI quarrelsomeness flux 10. SBI dominance flux 11. SBI submission flux 12. SBI spin M SD
— .07 ⫺.01 ⫺.14† .12 .13 ⫺.02 ⫺.01 .07 ⫺.04 .08 .07 3.64 0.52
— .46ⴱⴱ .25ⴱⴱ ⫺.04 .13 ⫺.03 ⫺.07 .09 .01 .09 .17ⴱ 1.04 0.56
3
4
— .36ⴱⴱ — .05 .14† .06 .19ⴱ ⫺.07 ⫺.02 .04 .16ⴱ .08 .28ⴱⴱ .11 .27ⴱⴱ .17ⴱ .30ⴱⴱ .14† .24ⴱⴱ 0.70 ⫺0.11 0.40 0.68
5
6
7
8
9
10
11
12
— .60ⴱⴱ .42ⴱⴱ .13 .24ⴱⴱ .32ⴱⴱ .36ⴱⴱ .18ⴱ 1.89 0.62
— .33ⴱⴱ .32ⴱⴱ .42ⴱⴱ .36ⴱⴱ .38ⴱⴱ .39ⴱⴱ 1.91 0.74
— .11 .08 .17ⴱ .11 .08 1.21 0.30
— .52ⴱⴱ .44ⴱⴱ .30ⴱⴱ .61ⴱⴱ 2.00 0.34
— .48ⴱⴱ .39ⴱⴱ .80ⴱⴱ 1.79 0.42
— .53ⴱⴱ .43ⴱⴱ 1.96 0.36
— .30ⴱⴱ 2.03 0.46
— 0.94 0.22
Note. Means and standard deviations reflect transformed scores. BIC ⫽ Battery of Interpersonal Capabilities; IAS ⫽ Interpersonal Adjectives Scales; IIP-C ⫽ Inventory of Interpersonal Problems–Circumplex scales; IG ⫽ Interpersonal Grid; SBI ⫽ Social Behavior Inventory. p ⬍ .07. ⴱ p ⬍ .05. ⴱⴱp ⬍ .001.
†
interaction (e.g., whether one’s level of dominance correlated negatively with perceived dominance of the partner and whether one’s own affiliation correlated positively with perceived affiliation). Because our repeated measurements were nested within participants with unequal numbers of diary records, hierarchical linear modeling was most appropriate for these tests. None of these analyses reached significance, so we do not report results further. Without these effects being significant, it is impossible that complementarity (of this subjective form) could account for the effects observed in Study 2.
Discussion In a week-long diary study of social interactions, the measurement model fit with predictions, specifying latent factors for Dominance and Affiliation Behavior Variability (less so when modeling latent behavioral and perceptual variability as unitary factors). As expected, Vector Length and Capabilities did not predict intraindividual variability, whereas Distress consistently predicted such variability, as in Study 1. Consistent with hypotheses, Distress predicted higher variability of social behavior (Dominance/ Affiliation Behavior Variability and Spin), implying that such behavioral fluctuation over time constitutes a dysfunctional process. Distress positively predicted flux dimensions for social perceptions; this suggests that, in naturalistic settings where participants were free to select their own social interactions, those with high Distress had somewhat more variable perceptions of others. Results were consistent with the hypothesized (partial) meditational role of perceptual variability. Distress exerted indirect ef-
Model Estimation for Spin Model For spin (no figure), the saturated model fit well, 2(7) ⫽ 6.49, p ⫽ .48, normed chi-square ⫽ 0.93, comparative fit index ⫽ 1.00, root mean square error of approximation ⫽ 0 (0 –.09). Only the Distress to Behavior Spin path was significant,  ⫽ .25, p ⬍ .001, moderated by neither gender nor number of records.
Table 5 Study 2 Flux Model Fit Indices Model
2
df
p
⌬2
⌬df
⌬p
NC
CFI
RMSEA
RMSEA CI
M0a: Measurement model M0b: Alternative measurement model M1: Baseline model M2: M1 ⫹ path from Affiliation Perceptual Flux to Dominance Behavior Variability M3: M2 with all flux variables residualized (means controlled) M4: M2 across gender groups M5: M4 ⫹ constrained factor loadings across genders M6: M4 ⫹ constrained structural paths across genders
26.84 51.14 45.23
18 27 28
.08 .00 .02
— — —
— — —
— — —
1.49 1.89 1.62
.98 .94 .96
.05 .07 .06
0–.09 .04–.10 .02–.09
35.57
27
.13
9.66
1
⬍.005
1.32
.98
.04
0–.07
38.19 67.46
25 54
.04 .10
7.04 —
3 —
ns —
1.53 1.25
.96 .97
.05 .04
.01–.08 0–.06
68.86
57
.14
1.40
3
ns
1.21
.97
.03
0–.06
75.65
64
.15
8.19
10
ns
1.18
.97
.03
0–.06
Note. Dashes indicate specific models that were not tested for change in fit relative to other models. ⌬ ⫽ chi-square change; ⌬df ⫽ change in degrees of freedom relative to baseline models; ⌬p ⫽ significance of change in fit; ns ⫽ not significant at p ⬍ .05; NC ⫽ normed chi-square; CFI ⫽ comparative fit index; RMSEA ⫽ root mean square error of approximation; CI ⫽ 90% confidence interval. 2
PREDICTORS OF INTRAINDIVIDUAL VARIABILITY
907
e1
e2
e5
e6
IIP-C VL
IAS VL
SBI Dom Flux
SBI Sub Flux
.77
.59
.79
.69
Dominance Behavior Variability
Vector Length
d3
.30 .26 .47
.02
Dominance Perceptual Flux (IG)
Interpersonal Distress
.15
d1
.20
d2
.29 .70
.58
.97
IIP-C Mean -.17
e3
Affiliation Perceptual Flux (IG)
.47
.23
Interpersonal Capabilities .87
.65
Affiliation Behavior Variability
d4 .80
BIC
SBI Agree Flux
SBI Quar Flux
e4
e7
e8
Figure 7. Naturalistic interactions (Study 2) final general model with standardized parameter estimates. d ⫽ disturbance terms or unexplained variance of latent variables; e ⫽ error terms (measurement error plus other unexplained variance) for measured variables; IIP-C ⫽ Inventory of Interpersonal Problems–Circumplex scales; VL ⫽ Vector Length; IAS ⫽ Interpersonal Adjective Scales; SBI ⫽ Social Behavior Inventory; Dom ⫽ Dominance; Sub ⫽ Submissiveness; IG ⫽ Interpersonal Grid; BIC ⫽ Battery of Interpersonal Capabilities; Agree ⫽ Agreeableness; Quar ⫽ Quarrelsomeness. All factor loadings were significant at p ⬍ .001. All structural paths and covariances were significant at p ⬍ .05, with the exception of the covariance between Vector Length and Capabilities.
fects on Dominance Behavior Variability through both forms of dimensional flux for perceptions and exerted effects on Affiliation Behavior Variability through Affiliation Perceptual Flux. The fact that Affiliation Flux of perceptions played a mediational role for Behavior Variability for both dimensions is of note; individuals who vacillated between perceiving others as affiliative versus cold vacillated not only in their behavioral affiliation, but also in their behavioral dominance. Also, as expected, analyses showed that the aforementioned findings are robust across both men and women and are largely independent of mean-level variance.
General Discussion The English lexicon includes colloquial descriptions of personality tendencies characterized by excessively low (e.g., rigid, set in one’s ways) or high variability over time (e.g., unpredictable, unstable, wishy-washy). Similarly, many personality theories assume that poor interpersonal adjustment relates to intraindividual variability across situations, be it low (e.g., Bem, 1974; Carson, 1969), high (e.g., Leary, 1957), or inappropriate (i.e., not complementary or matched to the behavior of one’s partner; e.g., Kiesler, 1996; Tracey, 2005). Whereas recent research demonstrates stable
individual differences in intraindividual variability of interpersonal tendencies (e.g., Baird et al., 2006; Moskowitz & Zuroff, 2005b; Shoda, Mischel, & Wright, 1994), the present study sought to advance the study of interpersonal adjustment and variability by addressing several questions left unanswered by extant research. First, existing studies have not examined intraindividual variability in social perceptions across a broad range of situations and whether it correlates with variability of social behavior. Our results suggest that in both imagined and naturalistic social interactions, individuals who vacillate often between friendly and cold behavior are also likely to vacillate between dominant and submissive behavior; analogously, those who fluctuate between perceiving others as cold versus warm also fluctuate between perceiving others as dominant versus submissive. The latter finding extends the study of variability in attachment styles (La Guardia et al., 2000) and social expectations (Foltz et al., 1999) by our measurement of specific social situations (not just types of relationships) and a broader range of types of interactions. Also, we found that variability of perceptions and behavior correlated for the affiliation dimension in imagined interactions (Study 1). That effect was replicated in reported naturalistic interactions (Study 2), in which we also found that perceptual variability for both dominance and
908
ERICKSON, NEWMAN, AND PINCUS
affiliation predicted variability of dominance behavior. Thus, individuals prone to fluctuating perceptions of their interaction partners may themselves fluctuate highly in their own behavioral responses. Linking these two processes advances the study of variability in social behavior (Moskowitz & Zuroff, 2005b) by identifying a cognitive process that may influence it. Contemporary models of personality emphasize if–then behavioral signatures in which individuals behave differently depending on how they construe specific situations (e.g., Mischel et al., 2002), and our results show that individuals with a variable range of ifs (construed situations) also have a variable range of thens (behavioral responses). High-variability individuals may possess a larger set of if–then contingencies for their social behavior, or they may have less predictable contingencies. Examination of such issues may add to the study of if–then models. Our results buttress the view of intraindividual variability as a general personality process (Baird et al., 2006). Second, despite the ubiquitous assumption that well-adjusted individuals flexibly adapt their behavior to a wide range of situations (Bem, 1974; Leary, 1957; Paulhus & Martin, 1988; Snyder, 1974), whereas maladjusted persons use only a few behaviors repeatedly, previous research has not tested whether self-report personality measures purported to measure this tendency actually predict the high (flexibility) or low (rigidity) behavior variability across a range of situations that is implied by this theory. We found no such effects for purported measures of interpersonal flexibility (BIC) or rigidity (vector length calculated on measures of interpersonal traits and problems). Those who had high scores on the BIC gave no indication of flexibly varying their own behavior in response to others. Rather than flexibility per se, one’s selfreported capability to use a wide range of behaviors may simply reflect the general sense of social competence that typifies dominant traits, particularly given that in unreported post hoc analyses, the BIC correlated most highly with dominant and cold– dominant interpersonal traits. With regard to vector length, results are consistent with the idea that it does not measure a pathological process once interpersonal distress has been controlled (Gurtman & Balakrishnan, 1998). Rather, it seems to measure subjective differentiation of one’s interpersonal traits or problems (i.e., distinguishing which traits are self-descriptive and which are not; Gurtman & Pincus, 2003). This view clarifies our finding that vector length predicted perceiving a broader range of dominance and affiliation across standard scenarios. Those with a differentiated idea of their own interpersonal tendencies also appear to discriminate between degrees of dominance and affiliation in others, consistent with the findings of correlations between the complexity of one’s views of self and others (e.g., Mendoza-Denton, Ayduk, Mischel, Shoda, & Testa, 2001). The ability for discriminative perception of others is, indeed, often considered adaptive (Cantor & Kihlstrom, 1987; Chiu et al., 1995; Morrison & Bellack, 1981). In imagined interactions, individuals with high vector length also endorsed greater complementarity of their behavioral responses to the situation, further showing that this measure need not reflect maladjustment (in contrast to studies that did not sample as broad a range of situations; O’Connor & Dyce, 1997; Tracey, 2005). Thus, despite the intuitive and widespread appeal of the general idea of interpersonal rigidity/flexibility as put forth by many personality theories (e.g., Bem, 1974; Cantor & Kihlstrom, 1987;
Leary, 1957), our results support recent arguments that these measures simply do not measure flexibility (Hofsess & Tracey, 2005) or rigidity (Gurtman & Pincus, 2003). The implications are that this particular personality construct may not be amenable to standard self-report measurement formats, necessitating development of alternative strategies, such as having participants respond to a range of scenarios in if–then format as in Study 1 (e.g., “when others dominate, I submit”), thus permitting calculation of variability across situations. Third, the most central issue left ambiguous in previous research is whether interpersonal maladjustment most consistently relates to high, low, or noncomplementary intraindividual behavioral variability. Our results provide little evidence for the classic behavioral rigidity hypothesis (Leary, 1957) but largely support the idea that a high level of intraindividual variability of behavior across situations is linked to dysfunction (Foltz et al., 1999; Moskowitz & Zuroff, 2004), thus extending previous research by examining a clinically valid measure of interpersonal problems and a wide range of specific interpersonal situations. This effect occurred in both hypothetical and naturalistic interactions and for both interpersonal dimensions. Interpersonally distressed individuals consistently demonstrated fluctuation between friendly and cold behaviors, as well as between dominant and submissive behaviors (flux), suggesting a form of chaotic reactivity. The interpersonal behavior of these individuals also showed higher levels of variation between dominance, agreeableness, submission, and quarrelsomeness (spin) in daily interactions. Distressed individuals endorsed behavioral responses to hypothetical situations that were less complementary (replicating Tracey, 2005). Furthermore, complementarity fully accounted for the relation between interpersonal distress and variability on the affiliation dimension; however, an equivalent model suggested that variability of affiliative behavior mediates the relation between distress and complementarity. Either model fits the data; we believe it to be more plausible that excessive variability results in low complementarity. The present study cannot definitively settle the issue given that indices of variability and complementarity were all derived from the same participant responses. However, complementarity did not fully explain the association between distress and behavioral variability for the dominance dimension in hypothetical scenarios (Study 1). Similarly, interpersonal distress did not predict a subjective form of complementarity in naturalistic interactions (perhaps because of the lack of ability to hold types of interactions constant as in the standard scenarios in Study 1); therefore, complementarity could not explain the links between distress and high variability in Study 2. Thus, distressed individuals exhibit behavior that is not just potentially poorly matched to the situation but also excessively labile outside of the range of appropriate variability, challenging the interpersonal theory that low variability of behavior (i.e., rigidity) is dysfunctional because of failures to complement others’ behavior (Kiesler, 1996; Leary, 1957). Of importance, contrary to the idea that associations between maladjustment and intraindividual variability may be due to the mean level of a behavior across situations (e.g., average affiliation) rather than variability (e.g., standard deviation of affiliation; Baird et al., 2006; Kashdan et al., 2006), almost all links between distress and behavioral variability remained significant even after means were controlled. The present findings suggest that, at least within
PREDICTORS OF INTRAINDIVIDUAL VARIABILITY
the realms of imagined and reported social behavior, intraindividual variability is a personality process robustly linked to distress (see also Moskowitz & Zuroff, 2005b). With regard to variability of social perceptions, a more complex picture emerged. When participants were confronted with a range of standardized hypothetical scenarios, interpersonal distress predicted low variability of perceptions. Distressed individuals perceived a narrower range of dominance and affiliation (even with means controlled), consistent with the idea that discriminative social perception is adaptive (Chiu et al., 1995). This finding is novel because, whereas many theories emphasize biased perceptions in terms of mean levels (Bartholomew & Horowitz, 1991; Beck, 1976; Strupp & Binder, 1984), we are unaware of any studies testing for a low perceptual range (Pincus, 1994). This effect is unlikely to be due to chance, given that it occurred on both interpersonal dimensions and for imagined interactions with both friends and authority figures. Apparently, distressed individuals may benefit not only from attending to information inconsistent with their bias (Beck, 1976), but also from learning to mindfully perceive a broader range of stimuli (Langer, 1989), including the behavior of their interaction partners (i.e., on dominance and affiliation dimensions). Consistent with this idea, individuals high in mindful awareness of themselves and others endorse low distress and interpersonal problems (Dekeyser et al., 2008; Erickson, 2008). Individuals who imagined a wider range of hypothetical perceptions along the dominance dimension were more likely to endorse complementary responses, further evidence of such perceptual breadth as adaptive. In contrast, interpersonally distressed participants exhibited high variability of perceptions on both dominance and affiliation dimensions during naturalistic social interactions (Study 2). This finding extends the few extant studies linking distress to higher perceptual variability (e.g., Foltz et al., 1999; La Guardia et al., 2000) by use of a larger number of stimuli with more comprehensive coverage of the interpersonal domain. Although in apparent contradiction to the results from hypothetical interactions (Study 1), consideration of methodological differences may clarify these findings. Specifically, it makes sense that higher variability of perception in relation to the full spectrum of social situations reflects broader discrimination between stimuli in terms of their interpersonal meaning. However, we believe it safe to assume that not all individuals are exposed in daily interactions (Study 2) to the same range of interpersonal situations, unlike the standardized hypothetical scenarios in Study 1. Rather, some well-adapted individuals engage in interpersonal processes that create greater consistency within and across interactions. For instance, agreeable persons find affiliative interactions particularly reinforcing (Moskowitz & Coˆte´, 1995), and pursuing affiliation goals evokes affiliation from others (Crocker & Canevello, 2008); agreeable individuals thus exhibit behavior that remains highly agreeable with low variability (Moskowitz & Zuroff, 2004). In other words, affiliative individuals constrain their social worlds (and therefore perceptions) to be more homogeneously affiliative. In contrast, distressed individuals report that portions of their interactions are highly negative (Nezlek, Hampton, & Shean, 2000); they create some of this negativity (Coyne, 1976). This would mean that a disproportionate number of their interactions fall outside the baseline of normal friendliness, presumably leading to higher variability of perceptions (and behavior) across situations (meaning a
909
broader range of interactions). This is precisely the finding we obtained in naturalistic interactions permitting selection and influence of partners (Study 2). An alternative explanation, that individuals with high distress fluctuate highly in their perceptions independent of their partners’ behavior, appears very unlikely given that Study 1 showed low variability of perceptions vis-a`-vis standardized scenarios. Future research must further examine differences between perceptual variability in controlled and naturalistic settings. We should note that, although several personality theorists’ descriptions of links between maladjustment and intraindividual variability directly imply high or low variability (e.g., rigidity is defined as using a narrow range of behaviors across situations), variability itself is not equated with pathology (Leary, 1957; Paulhus & Martin, 1988; Tracey, 2005). As Leary (1957) noted, it remains difficult to distinguish rigidity from consistency and flexibility from chaotic reactivity in terms of variability alone, which is crudely descriptive. Various theorists have worked around the issue by stating that behavior must be situationally appropriate (Carson, 1969; Leary, 1957; Kiesler, 1996), often lacking further definition. Appropriate behavior is sometimes defined in terms of complementarity. However, although complementarity may serve as a normal baseline, often one’s most adaptive response may be noncomplementary, such as responding to coldness with conciliatory friendliness rather than retribution (e.g., Kiesler, 1996). Alternatively, a sense of being overwhelmed by situational pressures (Paulhus & Martin, 1988) because one lacks a stable core sense of self (Campbell, 1990; Lecky, 1945) may define pathological variability, a hypothesis worth testing in future research. We admit that descriptive indices of variability should be viewed as a placeholder until the specific situations, self-concept features, goals, or emotions that give rise to it are better understood. Several study limitations should be noted. Our results for hypothetical interactions (Study 1) apply only to same-sex targets, although results for naturalistic interactions (Study 2) had no such restrictions. Study 2 results may be vulnerable to bias because of the exclusion of low-responding participants. Also, although several effects were replicated across studies, cross-validation of our models is warranted because they included some modifications and were thus not fully confirmatory. In addition, because independent observers did not code participants’ behaviors, participant construal and bias cannot be ruled out; however, the studies used checklists of very specific behaviors, making them less susceptible to bias than the global self-ratings of personality used in other studies of intraindividual variability. We note as well that our correlational designs disallow firm causality statements. Personality indices temporally preceded other measures in Study 2, and results were consistent with causation flowing from perceptions to behavior, consistent with theoretical formulations of social cognition as a determinant of social behavior (e.g., Mischel et al., 2002). However, given that social behaviors themselves may influence mental or emotional processes (e.g., Fleeson, Malanos, & Achille, 2002), we cannot rule out the possibilities that social behavior influenced social perceptions (e.g., acting friendly may create positive views of others through cognitive processes or by eliciting friendliness from others) or that variability of perceptions or behavior causes distress. We note that in post hoc analyses, such models fit the data no better than the ones presented here. Additionally,
ERICKSON, NEWMAN, AND PINCUS
910
in the study of hypothetical interactions (Study 1), a post hoc model with distress as the outcome variable showed only Dominance Behavior Variability as a significant and medium-sized predictor; in a parallel model for naturalistic interactions (Study 2), no forms of intraindividual variability predicted distress, providing less support for this reverse model of causality in the present data. In summary, the present study provides converging evidence that intraindividual variability is a general personality process that occurs across the interpersonal dimensions of dominance and affiliation for perceptions and behaviors, different types of relationships, and in imagined and daily interactions. Little support emerged for the widespread thesis that poorly adjusted individuals overuse a narrow range of behaviors (Bem, 1974; Leary, 1957; Paulhus & Martin, 1987), whether through purported self-report indices (e.g., vector length) or the more dynamic indices of flux and spin. Interpersonally distressed individuals do show a narrowing of social perceptions overall and therefore may benefit from receiving training in discriminative social perception, but otherwise they appeared unpredictable, exhibiting high behavioral variability even apart from complementarity. Results generally held (except for two out of several dozen) even when controlling for gender and means of criterion variables, the latter being an overly conservative strategy. Beyond interpersonal distress in general, future research should examine whether specific types of interpersonal problems entail high versus low intraindividual variability. Similarly, some personality disorders may be epitomized by rigid narrowing of perceptions and behavior (e.g., avoidant, schizoid) or by high fluctuation of self- and social perceptions (e.g., borderline, histrionic, narcissistic; Fleeson & Leicht, 2006; Horowitz, 2004; Russell, Moskowitz, Zuroff, Sookman, & Paris, 2007). Furthermore, whereas some theorists advocate treating interpersonal problems by helping individuals learn to use a broader range of behaviors (Kiesler, 1996), perhaps some individuals should instead learn how to behave more consistently across contexts. In conclusion, future research must extend the study of interpersonal dysfunction by refining the measurement and conceptualization of the dynamic processes of intraindividual variability.
References Alden, L. E., Wiggins, J. S., & Pincus, A. L. (1990). Construction of circumplex scales for the Inventory of Interpersonal Problems. Journal of Personality Assessment, 55, 521–536. Allport, G. W. (1937). Personality: A psychological interpretation. New York: Holt. American Psychiatric Association. (2000). Diagnostic and statistical manual of mental disorders (4th ed.). Washington, DC: Author. Arbuckle, J. L. (2007). Amos 16.0 [Computer software]. Spring House, PA: Amos Development Corporation. Baird, B. M., Le, K., & Lucas, R. E. (2006). On the nature of intraindividual personality variability: Reliability, validity, and associations with well-being. Journal of Personality and Social Psychology, 90, 512–527. Bartholomew, K., & Horowitz, L. M. (1991). Attachment styles among young adults: A test of a four-category model. Journal of Personality and Social Psychology, 61, 226 –244. Beck, A. T. (1976). Cognitive therapy and the emotional disorders. New York: International Universities Press.
Bem, S. L. (1974). The measurement of psychological androgyny. Journal of Consulting and Clinical Psychology, 42, 155–162. Block, J. (1961). Ego identity, role variability, and adjustment. Journal of Consulting Psychology, 25, 392–397. Bollen, K. A. (1989). Structural equations with latent variables. Oxford, England: Wiley. Bowlby, J. (1988). A secure base. New York: Basic Books. Campbell, J. D. (1990). Self-esteem and clarity of the self-concept. Journal of Personality and Social Psychology, 59, 538 –549. Cantor, N., & Kihlstrom, J. F. (1987). Personality and social intelligence. Englewood Cliffs, NJ: Prentice Hall. Carson, R. C. (1969). Interaction concepts of personality. Chicago, Aldine. Caspi, A., & Roberts, B. W. (2001). Personality development across the life course: The argument for change and continuity. Psychological Inquiry, 12, 49 – 66. Chiu, C., Hong, Y., Mischel, W., & Shoda, Y. (1995). Discriminative facility in social competence: Conditional versus dispositional encoding and monitoring-blunting of information. Social Cognition, 13, 49 –70. Coyne, J. C. (1976). Depression and the response of others. Journal of Abnormal Psychology, 85, 186 –193. Crocker, J., & Canevello, A. (2008). Creating and undermining social support in communal relationships: The role of compassionate and self-image goals. Journal of Personality and Social Psychology, 95, 555–575. Dekeyser, M., Raes, F., Leijssen, M., Leysen, S., & Dewulf, D. (2008). Mindfulness skills and interpersonal behavior. Personality and Individual Differences, 44, 1235–1245. Donahue, E. M., Robins, R. W., Roberts, B. W., & John, O. P. (1993). The divided self: Concurrent and longitudinal effects of psychological adjustment and social roles on self-concept differentiation. Journal of Personality and Social Psychology, 64, 834 – 846. Eid, M., & Diener, E. (1999). Intraindividual variability in affect: Reliability, validity, and personality correlates. Journal of Personality and Social Psychology, 76, 662– 676. Epstein, S. (1973). The self-concept revisited or a theory of a theory. American Psychologist, 28, 404 – 416. Erickson, T. M. (2008). [Trait mindfulness and interpersonal problems]. Unpublished raw data. Erickson, T. M., & Newman, M. G. (2007). Interpersonal and emotional processes in GAD analogues during social interaction tasks. Behavior Therapy, 38, 364 –377. Fleeson, W. (2001). Toward a structure- and process-integrated view of personality: Traits as density distributions of states. Journal of Personality and Social Psychology, 80, 1011–1027. Fleeson, W., & Leicht, C. (2006). On delineating and integrating the study of variability and stability in personality psychology: Interpersonal trust as an illustration. Journal of Research in Personality, 40, 5–20. Fleeson, W., Malanos, A. B., & Achille, N. M. (2002). An intraindividual process approach to the relationship between extraversion and positive affect: Is acting extraverted as “good” as being extraverted? Journal of Personality and Social Psychology, 83, 1409 –1422. Foltz, C., Barber, J. P., Weinryb, R. M., Morse, J. Q., & Chittams, J. (1999). Rigidity of themes across interpersonal relationships. Journal of Social and Clinical Psychology, 18, 204 –222. Fournier, M. A., Moskowitz, D. S., & Zuroff, D. C. (2008). Integrating dispositions, signatures, and the interpersonal domain. Journal of Personality and Social Psychology, 94, 531–545. Gosling, S. D., Vazire, S., Srivastava, S., & John, O. P. (2004). Should we trust Web-based studies? A comparative analysis of six preconceptions about Internet questionnaires. American Psychologist, 59, 93–104. Gurtman, M. B., & Balakrishnan, J. D. (1998). Circular measurement redux: The analysis and interpretation of interpersonal circle profiles. Clinical Psychology: Science and Practice, 5, 344 –360. Gurtman, M. B., & Pincus, A. L. (2000). Interpersonal circumplex scales:
PREDICTORS OF INTRAINDIVIDUAL VARIABILITY Confirmation of circumplex structure from multiple perspectives. Personality and Social Psychology Bulletin, 26, 374 –384. Gurtman, M. B., & Pincus, A. L. (2003). The circumplex model: Methods and research applications. In W. F. Velicer & J. A. Schinka (Eds.), Handbook of psychology: Research methods in psychology: Vol. 2 (pp. 407– 428). New York: Wiley. Hayes, S. C., Strosahl, K. D., & Wilson, K. G. (1999). Acceptance and commitment therapy: An experiential approach to behavior change. New York: Guilford. Hofsess, C. D., & Tracey, T. J. G. (2005). The interpersonal circumplex as a model of interpersonal capabilities. Journal of Personality Assessment, 84, 137–147. Horowitz, L. M. (2004). Interpersonal foundations of psychopathology. Washington, DC: American Psychological Association. Horowitz, L. M., Alden, L. E., Wiggins, J. S., & Pincus, A. L. (2000). IIP: Inventory of Interpersonal Problems manual. San Antonio, TX: Psychological Corporation. Kashdan, T. B., Uswatte, G., Steger, M. F., & Julian, T. (2006). Fragile self-esteem and affective instability in posttraumatic stress disorder. Behaviour Research and Therapy, 44, 1609 –1619. Kiesler, D. J. (1985). The 1982 Interpersonal Circle: Acts version. Unpublished manuscript, Virginia Commonwealth University, Richmond, VA. Kiesler, D. J. (1987). Check List of Psychotherapy Transactions–Revised (CLOPT-R) and Check List of Interpersonal Transactions-Revised (CLOIT-R). Richmond: Virginia Commonwealth University. Kiesler, D. J. (1996). Contemporary interpersonal theory and research: Personality, psychopathology, and psychotherapy. New York: Wiley. Kline, R. B. (2005). Principles and practice of structural equation modeling (2nd ed.). New York: Guilford. La Guardia, J. G., Ryan, R. M., Couchman, C. E., & Deci, E. L. (2000). Within-personal variation in security of attachment: A selfdetermination theory perspective on attachment, need fulfillment, and well-being. Journal of Personality and Social Psychology, 79, 367–384. Langer, E. J. (1989). Mindfulness. Cambridge, MA: Perseus. Leary, T. (1957). Interpersonal diagnosis of personality. New York: Ronald Press. Lecky, P. (1945). Self-consistency: A theory of personality. New York: Anchor Books. Main, M., & Solomon, J. (1986). Discovery of an insecure– disorganized/ disoriented attachment pattern: Procedures, findings, and implications for the classification of behavior. In T. B. Brazelton & M. Yogman (Eds.), Affective development in infancy (pp. 95–124). Norwood, NJ: Ablex. Mardia, K. V. (1972). Statistics of directional data. New York: Academic Press. Markus, H., & Nurius, P. (1986). Possible selves. American Psychologist, 41, 954 –969. Mendoza-Denton, R., Ayduk, O., Mischel, W., Shoda, Y., & Testa, A. (2001). Person ⫻ Situation interactionism in self-encoding (I am . . . when . . .): Implications for affect regulation and social information processing. Journal of Personality and Social Psychology, 80, 533–544. Mischel, W. (1968). Personality and assessment. New York: Wiley. Mischel, W., Shoda, Y., & Mendoza-Denton, R. (2002). Situation– behavior profiles as a locus of consistency in personality. Current Directions in Psychological Science, 11, 50 –54. Morrison, R. L., & Bellack, A. S. (1981). The role of social perception in social skill. Behavior Therapy, 12, 69 –79. Moskowitz, D. S. (1994). Cross-situational generality and the interpersonal circumplex. Journal of Personality and Social Psychology, 66, 921–933. Moskowitz, D. S., & Coˆte´, S. (1995). Do interpersonal traits predict affect? A comparison of three models. Journal of Personality and Social Psychology, 69, 915–924. Moskowitz, D. S., & Zuroff, D. C. (2004). Flux, pulse, and spin: Dynamic
911
additions to the personality lexicon. Journal of Personality and Social Psychology, 86, 880 – 893. Moskowitz, D. S., & Zuroff, D. C. (2005a). Assessing interpersonal perceptions using the interpersonal grid. Psychological Assessment, 17, 218 –230. Moskowitz, D. S., & Zuroff, D. C. (2005b). Robust predictors of flux, pulse, and spin. Journal of Research in Personality, 39, 130 –147. Nezlek, J. B., Hampton, C. P., & Shean, G. D. (2000). Clinical depression and day-to-day social interaction in a community sample. Journal of Abnormal Psychology, 109, 11–19. O’Connor, B. P., & Dyce, J. (1997). Interpersonal rigidity, hostility, and complementarity and musical bands. Journal of Personality and Social Psychology, 72, 362–372. Paulhus, D. L., & Martin, C. L. (1987). The structure of personality capabilities. Journal of Personality and Social Psychology, 52, 354 – 365. Paulhus, D. L., & Martin, C. L. (1988). Functional flexibility: A new conception of interpersonal flexibility. Journal of Personality and Social Psychology, 55, 88 –101. Pincus, A. L. (1994). The interpersonal circumplex and the interpersonal theory: Perspectives on personality and its pathology. In S. Strack & M. Lorr (Eds.), Differentiating normal and abnormal personality (pp. 114 – 136). New York: Springer. Pincus, A. L., & Gurtman, M. B. (2006). Interpersonal theory and the interpersonal circumplex: Evolving perspectives on normal and abnormal personality. In S. Strack (Ed.), Differentiating normal and abnormal personality (2nd ed., pp. 83–111). New York: Springer. Ruiz, M. A., Pincus, A. L., Borkovec, T. D., Echemendia, R. J., Castonguay, L. G., & Ragusea, S. A. (2004). Validity of the Inventory of Interpersonal Problems for predicting treatment outcome: An investigation with the Pennsylvania Practice Research Network. Journal of Personality Assessment, 83, 213–222. Russell, J. J., Moskowitz, D. S., Zuroff, D. C., Sookman, D., & Paris, J. (2007). Stability and variability of affective experience and interpersonal behavior in borderline personality disorder. Journal of Abnormal Psychology, 116, 578 –588. Sadler, P., & Woody, E. (2003). Is who you are who you’re talking to? Interpersonal style and complementarity in mixed-sex interactions. Journal of Personality and Social Psychology, 84, 80 –95. Sheldon, K. M., Ryan, R. M., Rawsthorne, L. J., & Ilardi, B. (1997). Trait self and true self: Cross-role variation in the Big-Five personality traits and its relations with psychological authenticity and subjective wellbeing. Journal of Personality and Social Psychology, 73, 1380 –1393. Shoda, Y., Mischel, W., & Wright, J. C. (1994). Intraindividual stability in the organization and patterning of behavior: Incorporating psychological situations into the idiographic analysis of personality. Journal of Personality and Social Psychology, 65, 1023–1035. Snyder, M. (1974). Self-monitoring of expressive behavior. Journal of Personality and Social Psychology, 30, 526 –537. Strupp, H. H., & Binder, J. L. (1984). Psychotherapy in a new key: A guide to time-limited dynamic psychotherapy. New York: Basic Books. Tracey, T. J. (1994). An examination of the complementarity of interpersonal behavior. Journal of Personality and Social Psychology, 67, 864 – 878. Tracey, T. J. G. (2005). Interpersonal rigidity and complementarity. Journal of Research in Personality, 39, 592– 614. Tracey, T. J. G., & Schneider, P. L. (1995). An evaluation of the circular structure of the Checklist of Interpersonal Transactions and the Checklist of Psychotherapy Transactions. Journal of Counseling Psychology, 42, 496–507. Vittengl, J. R., Clark, L. A., & Jarrett, R. B. (2003). Interpersonal problems, personality pathology, and social adjustment after cognitive therapy for depression. Psychological Assessment, 15, 29 – 40. Wheeler, L., & Nezlek, J. (1977). Sex differences in social participation. Journal of Personality and Social Psychology, 35, 742–754.
912
ERICKSON, NEWMAN, AND PINCUS
Wiggins, J. S. (1979). A psychological taxonomy of trait descriptive terms: The interpersonal domain. Journal of Personality and Social Psychology, 37, 395– 412. Wiggins, J. S. (1995). Interpersonal Adjective Scales: Professional manual. Odessa, FL: Psychological Assessment Resources. Wiggins, J. S., Phillips, N., & Trapnell, P. (1989). Circular reasoning about interpersonal behavior: Evidence concerning some untested assumptions
underlying diagnostic classification. Journal of Personality and Social Psychology, 56, 296 –305.
Received January 2, 2008 Revision received May 1, 2009 Accepted May 4, 2009 䡲
New Editors Appointed, 2011–2016 The Publications and Communications Board of the American Psychological Association announces the appointment of 3 new editors for 6-year terms beginning in 2011. As of January 1, 2010, manuscripts should be directed as follows: ● Developmental Psychology (http://www.apa.org/journals/dev), Jacquelynne S. Eccles, PhD, Department of Psychology, University of Michigan, Ann Arbor, MI 48109 ● Journal of Consulting and Clinical Psychology (http://www.apa.org/journals/ccp), Arthur M. Nezu, PhD, Department of Psychology, Drexel University, Philadelphia, PA 19102 ● Psychological Review (http://www.apa.org/journals/rev), John R. Anderson, PhD, Department of Psychology, Carnegie Mellon University, Pittsburgh, PA 15213 Electronic manuscript submission: As of January 1, 2010, manuscripts should be submitted electronically to the new editors via the journal’s Manuscript Submission Portal (see the website listed above with each journal title). Manuscript submission patterns make the precise date of completion of the 2010 volumes uncertain. Current editors, Cynthia Garcı´a Coll, PhD, Annette M. La Greca, PhD, and Keith Rayner, PhD, will receive and consider new manuscripts through December 31, 2009. Should 2010 volumes be completed before that date, manuscripts will be redirected to the new editors for consideration in 2011 volumes.