Price Setting during Low and High Inflation: Evidence from Mexico Etienne Gagnon∗ Federal Reserve Board October 2007
Abstract This paper provides new insight into the relationship between inflation and the setting of individual prices by examining a large data set of Mexican consumer prices covering episodes of both low and high inflation, as well as the transition between the two. When the annual rate of inflation is low (below 10-15%), the frequency of price changes comoves mildly with inflation as movements in the frequency of price decreases partly offset movements in the frequency of price increases. By contrast, the average magnitude of price changes correlates strongly with inflation because it is sensitive to changes in the relative occurrence of price increases and decreases. When inflation rises beyond 10-15%, there are few price decreases left in the economy and both the frequency and average magnitude of price changes are important determinants of inflation. I show that a menu-cost model embedding a distribution of idiosyncratic technology shocks predicts remarkably well the level of the average frequency and magnitude of price changes over a range of inflation similar to that experienced by Mexico. JEL classification: E31, D40, C23. Keywords: Price setting, consumer prices, frequency of price changes, time-dependent pricing, state-dependent pricing. ∗
E-mail:
[email protected]. I would like to thank the members of my dissertation committee, Lawrence J. Christiano, Alexander Monge-Naranjo, Sergio Rebelo, and my chairperson Martin Eichenbaum, for their continuous guidance and support. I also am grateful to Martin Bodenstein, Jeff Campbell, Reinout DeBock, Rodrigo García Verdú and Nicolas Vincent for their insightful comments and suggestions. Chris Ahlin and José Antonio Murillo Garza offered valuable help with the data while Martha Carillo, Matthew Denes and Guthrie Dundas offered excellent research assistance. Financial support for this research was provided in part by the Northwestern University Center for International Economics and Development and the Fonds québécois pour les chercheurs et l’aide à la recherche (FCAR). The views expressed in this paper are solely the responsibility of the author and should not be interpreted as reflecting the views of the Board of Governors of the Federal Reserve System or any other person associated with the Federal Reserve System.
1
1
Introduction
This paper presents new evidence on the setting of consumer prices during low and high inflation and sheds light on the empirical plausibility of competing models of price rigidities. It uses a new storelevel data set containing more than three million individual price quotes that are representative of more than half of Mexican consumers’ expenditures. The data start in January 1994 and end in June 2002. Over that nine-year period, CPI inflation rose from 6.8% in 1994 to a peak of 41.8% in 1995, before falling to a low of 3.9% in 2001.1 Given these considerable fluctuations, this data set can be used to discriminate among competing models of nominal price rigidities, as these models’ predictions diverge most in the presence of large shocks. Many macroeconomic models assume that price rigidities exist. There is, however, no consensus on how to model these rigidities. In time-dependent models, the set of firms optimizing their prices is fixed exogenously within each period. Firms must wait to change their prices until an opportunity presents itself to respond to shocks to their environment that have occurred since their last adjustment opportunity. Most commonly, it is assumed that a constant fraction of firms can optimize their price in each period.2 In state-dependent models, on the other hand, the timing of price changes is an endogenous decision. In these models, price stickiness results from frictions such as menu costs, imperfect or costly information, and shifts in demand that accompany price changes.3 Recently, several authors have argued that variants of time-dependent models can deliver empirically plausible predictions despite their simplicity.4 Even advocates of time-dependent models would agree, however, that the performance of these models should decline as inflation becomes high or volatile. The inflation level at which time-dependent models break down remains an open question, as does the more general question of which price-setting models are empirically plausible at both low and high inflation levels. My data set captures considerably more variation in inflation than do other studies of consumer 1
Unless otherwise indicated, all inflation figures are annualized and computed using logarithmic differences. Time-dependent models include Taylor’s (1980) staggered pricing model, in which firms optimize every n periods, and the Calvo (1983) model, in which firms face a time-invariant probability 1/n of optimizing their price. 3 For a modern treatment of menu-cost models, see, for example, Dotsey, King, and Wolman (1999); Danziger (1999); Golosov and Lucas (2007); Burstein (2006); and Gertler and Leahy (2006). Recent developments in models of information frictions includes Mankiw and Reis (2002); Sims (2003); and Mackowiak and Wiederholt (2007). Other state-dependent approaches include fair-pricing models (Rotemberg (2005); Rotemberg (2006)) and uncertain and sequential trading (e.g., Eden (1994); Lucas and Woodford (1993)). 4 See Klenow and Kryvtsov (2007), Burstein (2006) and Eichenbaum and Fisher (2004). 2
2
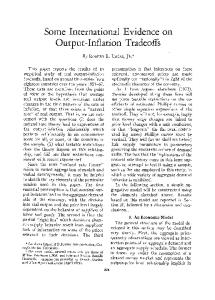
prices with comparable product coverage.5 As Figure 1 indicates, inflation is low and stable in the United States and Euro area relative to Mexico throughout the periods covered by these studies. In the case of high-inflation economies, the evidence is limited mainly to food products in Israel (Lach and Tsiddon (1992); Eden (2001); Baharad and Eden (2004)) and Poland (Konieczny and Skrzypacz (2005)), and to supermarket products in Argentina (Burstein, Eichenbaum, and Rebelo (2005)). My paper differs from these studies because my data set is representative of a much larger set of goods and services in the CPI. The monthly frequency of price changes varied much during my sample period. It rose from an average of 22.1% in 1994 to a high of 61.9% at the peak of inflation in April 1995, before leveling off around 27.4% in the last year of the sample. I find some important differences in pricesetting behaviors across low- and high-inflation periods. When inflation is low (below 10-15%), the frequency of price changes is only mildly correlated with inflation, especially when I restrict the sample to goods, in which case the correlation almost entirely disappears. On the other hand, the average magnitude of price changes in such low-inflation environment displays a tight and almost linear relationship with the level of inflation. As a result, movements in the frequency of price changes account for little of the inflation variance: at most 11% for the full sample and 6% for the subsample of goods, figures that are similar to that of Klenow and Kryvtsov (2007) for the United States (about 5%). In contrast, when inflation is high (above 10-15%), both the frequency and average magnitude of price changes are strongly correlated with inflation. Movements in the frequency of price changes then comprise an important component of inflation variance. When I decompose price changes between price increases and decreases, I find that the frequency of price increases rises steadily as inflation rises from 0 to 10-15%. This rise is partly offset by a simultaneous decline in the frequency of price decreases, thereby dampening movements in the overall frequency of price changes. This offsetting effect stems from goods, which have the largest proportion of price decreases. By comparison, relatively few price decreases are observed among services. As inflation rises from a low level, the decline in the occurrence of price decreases relative to price increases exacerbates movements in the average magnitude of price changes. In my data set, the change in the composition of price changes largely explains the strong correlation between 5
For studies on the United States, see Bils and Klenow (2004), Klenow and Kryvtsov (2007) and Nakamura and Steinsson (2007). Dhyne et al. (2005) review the main findings for the Euro area.
3
inflation and the average magnitude of price changes when inflation is low. Once inflation moves beyond 10-15%, price decreases have largely disappeared from most sectors of the economy with the exception of some fresh produce. The frequency of price increases continues to rise steadily with inflation, however, and the frequency of price changes thus becomes highly correlated with inflation. My data set also sheds light on how shocks to value-added taxes (VAT) are passed through to individual prices. In April 1995, the Mexican government raised the VAT from 10 to 15%. This hike differs in three important ways from other VAT changes documented in the literature: it was relatively large, broadly unexpected, and was implemented only in a subset of Mexican regions. This last feature allows me to compute statistics both with and without the tax change for similar groups of products, thereby offering a clearer assessment of the degree of tax pass-through. Interestingly, the adjustment occurred almost entirely through an increased frequency of price changes – not an increased magnitude – and was completed within a month of the tax change, two indications of strong state dependence with respect to this type of shock. In this case, a 1-percent increase in the annual inflation rate is associated with a rise of roughly 0.5 percentage-point in the monthly frequency of price changes for consumer products. Overall, my results suggest that pricing models should endogenize the timing of price changes if they wish to make realistic predictions at both low and high inflation levels. They also present the challenge of finding a model offering empirically plausible predictions at all levels of inflation. To investigate whether menu-cost models are consistent with my findings, I calibrate a discrete-time version of the Golosov and Lucas (2007) model. The model features idiosyncratic technology shocks giving rise to a distribution of both positive and negative nominal price changes. I show that the model performs well in terms of predicting the average frequency and magnitude of price changes for levels of inflation similar to the ones experienced by Mexico over my sample period. The model generates an initially slower increase in the frequency of price changes as inflation takes off from a low level. The success of the model comes in part from the presence of offsetting movements in the frequency of price increases and decreases, and highlights the importance of idiosyncratic shocks in this class of models for delivering empirically plausible predictions. The paper is organized as follows. In the next section, I provide a brief overview of the Mexican macroeconomic context over the sample period. In Section 3, I describe the assemblage of my data 4
set and discuss features of the data that are important for interpreting my results. Section 4 defines the statistics computed in this paper. The main empirical findings are presented in Section 5 and are then compared to other studies done in high-inflation environments in Section 6. In Section 7, I calibrate a discrete-time version of the Golosov-Lucas model and investigate its consistency with some key empirical features reported in the paper. The last section provides concluding remarks.
2
Macroeconomic Context
The sample period was marked by a severe economic downturn in the wake of the December 1994 peso devaluation. To most observers of the Mexican economy, however, 1994 opened rather positively.6 Inflation had been stabilized successfully below 10%, a major achievement in light of the three-digit rates of the late 1980s, and the real interest rate also had decreased. The excess return on the three-month, dollar-denominated Tesobonos was only two percentage points above the American T-Bill. The budget deficit, seen by many as the culprit of previous economic crises, had been eliminated in 1992. Moreover, the North American Free Trade Agreement had taken effect on January 1, 1994. This treaty was part of a broad set of Mexican government initiatives to deregulate the country’s economy and open it to foreign trade and capital. Foreign capital entered abundantly with a net inflow over 8% of GDP in 1993. However, growth in real GDP per capita remained modest, averaging 2.5% from 1991 to 1993. Many observers saw this situation as part of a restructuring process that soon would bring strong growth to the country. The devaluation brought a radical change of mood. On December 22, 1994, the exchange rate collapsed and lost more than 40% of its value vis-à-vis the U.S. dollar in the week that followed.7 As depicted in Figure 2, interest rates were pushed upward substantially as Banco de México tightened the supply of money to prevent further erosion of the peso and a capital flight. The devaluation left a major stagflation in its wake. Inflation took off almost immediately, increasing from 6.4% in November 1994 to 44.3% in January 1995 before peaking at 92.0% in April 1995. Real output per capita contracted by 9.5% in 1995, while private consumption per capita fell by a solid 13.2%. Mexicans would have to wait until 1998 for real GDP per capita to surpass its 1994 level and until 6
See Edwards (1998) for a review of observers’ opinions in 1994. Mexico pegged its exchange rate to the dollar in May 1992. In February 1994, the country switched to preannounced crawling bands around the U.S. dollar. 7
5
1999 for inflation to settle below 10%. The decline in aggregate income, coupled with a rise in fiscal evasion, brought a sharp decline in government revenues.8 To prevent further revenue erosion, the government raised the general rate of the value added tax rate (VAT) from 10% to 15% on April 1, 1995. This change affected all Mexican regions, with the notable exceptions of Baja California and a corridor along the country’s southern and northern borders where the rate remained at 10%.
3
Mexican Micro Data on Consumer Prices
3.1
Description of Sources
The data comprise price quotes collected by Banco de México for computing the Mexican CPI. Most price quotes correspond to narrowly defined items sold in specific outlets (e.g., corn flour, brand Maseca, bag of 1 kg, sold in outlet 1100 in Mexico City). A limited number of quotes are city-wide indexes, or the average price of a small sample of narrowly defined items belonging to the same category and outlet. Since January 1994, the official gazette of the Mexican government, the Diario Oficial de la Federación, has published price quotes. This publication releases each quote with a key linking the item to a specific outlet, city and good category; these keys allow me to track individual prices over time.9 In this paper, I refer to an item’s complete price history as its price trajectory. A price trajectory comprises one or several successive price spells, episodes when the price remained constant. The raw data set contains a total of 4.7 million price quotes from January 1994 to June 2002. Banco de México makes individual prices available up to six months after their publication, but it does not keep a historical data set of individual prices. The data set was assembled by merging the information released in the Diario. The data for the months of January 1994 to February 1995 could not be extracted electronically, so they were typed from original hard paper copies of the Diario using double-entry keying, a process ensuring a character-wise accuracy in excess of 99.998%.10 About 430,000 price quotes were added to the database in this way. Precise item descriptions were published in March 1995. The Diario also includes lists of 8
See OECD economic surveys, 1999-2000: Mexico for a detailed description of the taxation system. Items from the same outlet are attributed store keys independently to ensure confidentiality. 10 I thank Chris Ahlin for lending me original copies of the Diario. 9
6
items that are periodically added, dropped or substituted from the CPI basket. Unlike additions, substitutions are not planned events. They occur when the characteristics of an item (weight, size, model, presentation, etc.) change, when an outlet stops carrying an item or, in rarer cases, when an outlet goes out of business. The weights used in the CPI are derived from the Survey of Households’ Income and Expenditures (ENIGH). The CPI categories are representative of all ENIGH categories accounting for at least 0.02% of households’ expenditures. This ensures a coverage well above 95% of Mexican households’ expenditures.
3.2
Sample coverage
In January 1994, the CPI contained 30,692 price quotes spread over 302 product categories. By June 2002, the last month in my sample, it had expanded to nearly 50,000 price quotes distributed over 313 product categories. A major revision of the basket occurred in March 1995 when the number of cities covered in the CPI grew from 35 to 46. At the same time, 29 new product categories were introduced into the basket, and 18 were abandoned. This revision had been planned long before the peso’s devaluation. In July 2002, Banco de México updated the basket again to reflect the structure of Mexican households’ consumption in 2000. I cannot link items before and after the 2002 basket revision because of a change to the item keys. I consider only items whose prices are not regulated. To ensure the greatest comparability across time, I compute my results for a sample covering the January 1994 to June 2002 using the expenditure weights implemented in March 1995.11 The sample is further restricted to the product categories comprising individual prices that were unaffected by the 1995 basket revision. In addition, most education services and clothing items were dropped for reasons detailed below. The final sample contains 3.2 million price quotes from over 44, 000 price trajectories and covers 54.1% of CPI expenditures. The main groups of products excluded are rents and homeowners’ imputed rents, clothing (except for a few product categories containing individual observations) and education services, whose weight in the CPI are respectively 14.0%, 6.0% and 3.5%. Food items represent just under half of expenditures in the final sample, a proportion higher than in most U.S. and Euro area studies. Summary statistics are 11
These weights are derived from the 1989 ENIGH survey. They were updated using relative prices to reflect consumer expenditures in 1993.
7
presented in Table 1.
3.3
Other Aspects of the Data
I now address features of the data that are important to consider when interpreting of the results. The most significant issue is price averaging. Banco de México collects prices twice monthly for all items but food; food price collection occurs four times per month.12 The collected prices are then averaged to produce the monthly figures reported in the Diario. Observing the monthly average rather than the actual price of an item complicates the inference about price changes. For example, an average price of $2 for an item is consistent with an actual price of $2 throughout the month. It also is consistent with an actual price of $1.50 in the first half of the month and $2.50 in the second, or any combination of prices with $2 as their average. Moreover, changes to an average price series are typically more frequent and smaller in magnitude than changes to an actual price series. For example, a price hike from $1.50 to $2.50 in the middle of the month results in an average price of $2, which is $0.50 short of the new actual price, so that another change to the average price series will likely be recorded in the next month. To make my results as comparable as possible to other studies, which typically do not use averaged price quotes, I have constructed alternative price trajectories that filter out the effect of averaging observations whenever possible. These new series correspond to the end-of-month series which are both consistent with the published average prices and minimize the number of price changes. In the Appendix, I provide an extensive discussion of how averaging observations affect the inference about the timing and magnitude of price changes, and of how the filter was implemented. I was provided with unpublished semi-monthly data by Banco of México which allows me to directly assess the performance of the filter. Overall, the filtered series are much closer to the end-of-period price series that they aim to reproduce. More importantly, the filtered series capture the timing of price changes with great accuracy. All the main patterns described in this paper go through whether prices are filtered or not. Another data issue is that price collectors do not always directly observe prices. Sometimes an item is out of stock, out of season or, in rarer cases, the outlet is closed when the CPI agent 12
In the United States, the BLS collects prices monthly for food consumed at home, energy, and a few additional items with volatile prices. Other prices are collected monthly for the three largest metropolitan areas (New York, Los Angeles, and Chicago) and every other month for the remaining areas.
8
visits. In such situations, the price from the previous period is carried forward. Although I cannot identify prices that were imputed in my sample, I do find clear indications that the number of imputations was larger at the beginning of the sample. Item substitutions represented less than 0.1% of all published price quotes in 1994, a proportion that rose to 1.2% in 2001. A more systematic treatment of substitutions was implemented in 2001. Prices can now be carried forward for at most a month and a half before a substitution is sought. If the scarcity is generalized, this allowance can be extended up to three months. This methodological change likely creates a slight downward bias in the estimated frequency of price changes at the beginning of the sample. Prices are inclusive of sales as long as they are conditional on the purchase of a single item. For example, in a 3-for-2 promotion, the regular price would be reported. In the United States, the BLS reports prices net of sales and promotions whenever possible. For example, the same 3-for-2 promotion would result in a temporary 33% price decrease. There is no variable in the Mexican data set signaling that an item is on sale or that a promotion is ongoing. Most price quotes for the product categories of textiles, clothing, shoes and their related accessories are an average of a small sample of item prices; all items within a sample pertain to the same outlet whenever possible. Banco de México uses store samples to alleviate the problems associated with rapidly appearing and disappearing items due to changes in fashion and the seasons. A store sample typically contains two to four items (e.g., two cotton-based pants for men, brands Lee and Cimarron), with a mode of three for the number of both items and brands. Price changes generally are more frequent and of smaller magnitude for a sample than for its individual components, and the severity of this divergence depends on the price synchronization within the sample. All store samples were dropped from my analysis to limit the discussion to individual price changes. The decision to include or exclude store samples has little impact on the main findings. All education services observations, which covers registration and tuition fees, were also dropped from the sample. No transactions are recorded during most months of the year for these services. Prices are mechanically carried forward until the start of the next registration period, semester or academic year. For this reason, one cannot directly interpret the absence of price changes as evidence of price stickiness. A final issue is that item substitutions often accompany changes in product characteristics, thereby raising the question of whether substitutions should be treated as price changes. The 9
Inflation Persistence Network’s approach is to assume that all substitutions not previously planned by CPI agencies involve a price change. In this paper, all substitutions were excluded from the computation of price changes because their treatment varied over the sample period. The main conclusions are not affected by this choice.
4
Inflation Accounting Principles
Whenever a price is reported for two consecutive months, an indicator that a price change has occurred is created:
⎧ ⎪ ⎨ 1 if pit = 6 pit−1 Iit = ⎪ ⎩ 0 if pit = pit−1
where pit is the price of item i (in logs) during month t. Inflation is defined as π t =
X
i∈Υt
ω it π it ,
where π it = pit − pit−1 , ω it is the weight of item i, and Υt is the set of all items for which Iit is defined. For ωit , I use the weight of the CPI category to which item i belongs, divided by the number of items in that category for which I can compute a price change at t. Inflation also can be expressed as
πt =
⎛X ⎞ ´ ω it Iit ∆pit i∈Υt ⎠ ω it Iit ⎝ X i∈Υt ω I {z } it it i∈Υt {z } | f rt
³X
|
dpt
The term frt , henceforth referred to as the frequency of price changes, is the total CPI weight of items whose price changes at t. The term dpt is the average magnitude of those price changes. In the popular Calvo and Taylor models with uniform staggering of price changes, dpt is the only possible source of variation in π t . It is convenient to decompose inflation further into a weighted sum of price increases and decreases:
πt =
⎛X ⎞ ⎛X ⎞ ´ ´ ³X ω it Iit+ ∆pit ω it Iit− ∆pit i∈Υt i∈Υt ⎠+ ⎠ ω it Iit+ ⎝ X ωit Iit− ⎝ X + − i∈Υt i∈Υ t ω it Iit ωit Iit {z } {z } | i∈Υt i∈Υt {z } {z } | | f rt+ f rt−
³X
|
dp− t
dp+ t
10
This decomposition carries information about the relationship between the distribution of price changes and inflation. In the next section, the frequency of price increases and decreases, f rt+ and f rt− , will play a central role in the dynamics of inflation.
5
Main Empirical Results
This section presents the key empirical results regarding the average frequency and magnitude of price changes and focuses on their relationship to inflation. I treat (nonregulated) goods and services separately throughout the discussion because there are some key differences in the way prices are set between the two groups.13 In addition, I place a special emphasis on the results for goods given their predominance in my sample.
5.1
Frequency of Price Changes
I first present the results for the subsample of goods. These items represent 74.9% of all expenditures in my basket. As seen in the upper-panel of Figure 3, movements in the frequency of price changes and inflation were very large over the sample period. In April 1995, the rate of inflation for goods peaked at 86.0% (7.2% in monthly terms). This rate is much greater than the average in 1994 (7.5%) and during the last year of the sample (1.5%). The frequency of price changes also peaked in April 1995, when the price of 64.7% of goods, measured in CPI weights, changed during that month. This number is more than twice the average frequency of 26.8% in 1994. There were large variations in the composition of price changes over the sample period, as shown in the lower panel of Figure 3. At the peak of inflation, only 8.9% of price changes were negative, a proportion that rose to 46.0% in the last year of the sample. The corresponding proportion for the full sample of goods and services over the last year of the sample is 43.4%, a figure echoing those from U.S. and Euro-area studies. Positive comovement between frt and π t is clearly visible in Figure 3. The correlation coefficient between the two series is 0.91 for the whole period.14 This correlation is largely driven by the highinflation episode, however; it is about zero if I consider only the last three years of the sample. After 13
For the products in my sample, the COICOP goods/services classification is almost identical to the Bank of Mexico’s tradeables/nontradeables classification. The results reported in the paper for goods and services thus have an alternative interpretation in terms of tradeables and nontradeables. 14 All correlation statistics presented in this section are computed using linearly-detrended series.
11
mid-1996, it is difficult to spot any downward trend in the frequency of price changes even though inflation trends down. The reason behind this loose relationship is apparent in the lower panel of Figure 3, where I break down frt into f rt+ and frt− . As inflation declined, so did the frequency of price increases. At the same time, price decreases became more frequent, thereby dampening movements in the frequency of price changes. A look at the correlation between frt+ , frt− and π t provides further evidence of these offsetting movements. In the last three years of the sample, the correlation is 0.59 between frt+ and π t , and −0.74 between frt− and π t . The net result is a relative absence of correlation between f rt and π t for my sample of goods over that period. There are a few apparent large negative movements in the inflation series of goods over the lowinflation period, in particular in March 1999, February 2001, July 2001, and February 2002. These spikes are associated with unusually large changes in fresh produce prices. Shocks to the supply of fruits and vegetables, such as unusual weather conditions, can have a notable impact on the price of these items because they are perishable in nature. Some evidence of opposite movements in the frequency of price increases and decreases is apparent for these months. The scatterplot in the upper-left panel of Figure 4 offers a view from a different angle of the relationship between the frequency of price changes and inflation. Similar scatterplots for price increases and decreases are shown in the middle-left and lower-left panels, respectively. All panels display linear regression lines that use as explanatory variables linear, quadratic and cubic inflation terms, as well as a full set of year dummies. The dummies are included to account for potential shifts in the relationships over time that are unrelated to inflation, such as fluctuation in aggregate demand, basket composition and methodology. I present regression lines for two sets of observations. The dashed lines include all observations in the sample. The thick lines exclude the April 1995 VAT hike as well as all periods with negative inflation, which effectively removes all large shocks to food produce mentioned above. Variations in the supply of fresh fruits and vegetables and tax changes are shocks that differ in nature from a general rise in the price level. For this reason, my discussion of the scatterplots focuses on the results for the smaller sample as it likely better captures the overall relationship between inflation and its components. All regression statistics can be found in Table 2. When inflation is zero, each percentage-point increase in the rate of nonregulated-goods inflation is associated with a 0.35 (0.13) percentage point rise in the frequency of price increases, and an 12
opposite 0.22 (0.06) percentage point decline in the frequency of price decreases.15 These opposite movements have dampening effects on the frequency of price changes, whose corresponding slope is 0.14 (0.13). As inflation increases from a low level, the frequency of price increases becomes more responsive to changes in inflation while the frequency of price decreases becomes less so, resulting in greater sensitivity of the frequency of price changes to inflation. At an inflation rate of 15%, a one-percent change in inflation is associated with a 0.56 (0.04) percentage point rise in the frequency of price increases, and a 0.13 (0.01) percentage point decline in the frequency of price decreases. As inflation increases further, few price decreases are left in the economy; the rise in the frequency of price changes is then mainly driven by the steady growth in the occurrence of price increases. At all levels of inflation, I find that the response of the frequency of price increases to a change in inflation is larger than that of price decreases. A similar asymmetry is found in U.S. data, as reported by Nakamura and Steinsson (2007), but pooled regressions from Dhyne et al. (2006) using Euro-area data suggest a slightly greater response of the frequency of price decreases than increases. The findings are very similar when all observations are included in the regressions. The year dummies appear to capture some key changes in methodology and the economic environment over time. In particular, they are the lowest at the beginning of the sample, when maintaining a fixed basket was seen as important, and highest for 2001 and 2002, which had systematic substitutions of unavailable items to keep the basket up-to-date. No major change in methodology occurs over the 1996 to 2000 period and I cannot reject the hypothesis that the year dummies for 1996 to 2000 are jointly identical at the 10% confidence level. Imposing such equalities results in slightly more sensitive responses of the frequency of price increases and decreases at low levels of inflation but the overall sensitivity of the frequency of price changes of goods to inflation is largely unchanged. Interestingly, the year dummies for price increases and decreases have a tendency to rise over time. It is thus possible that factors not directly related to inflation, such as innovations in the technology used by outlets to changes prices, moderated the fall in the frequency of price changes as inflation declined in the latter years of the sample. Services represent a much smaller share of expenditures (25.1%) than goods in my basket. They 15
Standard deviations are shown in parentheses. They were computed using the Huber-White estimator of variance. As a check, I also computed standard errors using the autocorrelation-robust Newey-West estimator for the entire sample period (consecutive observations are required) with negligible impact on the estimates. Moreover, the fit of the linear model is virtually identical to that obtained using the nonlinear estimator of Papke and Wooldrige (1996), which directly accounts for the zero-one bounds on the frequency.
13
are also less representative of services as a whole because some important product categories are excluded due to the lack of individual data (such as homeowners’ imputed rents) or because prices are regulated (such as electricity and taxi fares). The upper panel of Figure 5 displays the frequency of price changes of services over the sample period. As was the case for goods inflation, services inflation peaked in April 1995, reaching 65.7% (5.5% in monthly terms), while the corresponding frequency of price changes rose to a sample high of 53.7%. There are several notable differences between the setting of services and goods prices, however. First, price changes are much less frequent among services at all level of inflation. Second, price changes are much less uniformly distributed over time than they are for goods; nominal adjustments tend to be clustered at the beginning of each year. Finally, price decreases are much less frequent than price increases even when inflation is low. In the last year of the sample, less than one out of every six nominal adjustments is negative.
5.2
Average Magnitude of Price Changes
The average magnitude of price changes comoves strongly with inflation in my subsample of goods, regardless of whether inflation is low or high. As shown in the upper panel of Figure 6, dpt and π t follow similar patterns over the sample period.16 Both series registered sharp increases during the Tequila crisis, followed by a protracted decline and ultimately a stabilization. The correlation between the two series is 0.95 over the full sample period. The high-inflation episode does not drive this strong correlation, as was the case with the frequency of price changes; indeed, the correlation actually rises over the last three years of the sample. As the scatterplot of dpt against π t clearly indicates (see the upper-right panel of Figure 4), dpt and π t have a tight, almost linear relationship when inflation is low. When inflation is elevated, this relationship is still strongly positive, although a bit noisier and somewhat concave. The figure also displays linear regression lines computed using the same set of observations and regressors employed for the frequency of price changes. The corresponding regression statistics are presented in Table 2. The average size of price increases and decreases are much less sensitive to the level of inflation than dpt . Except for a short period around the peak of inflation, the two series show relatively small oscillations around their respective sample mean: 9.0% for price increases and 9.8% for price 16
The inflation series displayed is the nonannualized monthly inflation rate to facilitate visual comparisons.
14
decreases.17 In the case of price decreases, I cannot reject the hypothesis that the coefficients associated with the three inflation terms in the regression are jointly equal to zero. The middleright panel is consistent with a mild rise in the size of price increases as inflation moves from a low to a high level. One cannot exclude, however, that this positive relationship partly reflects a rise in the occurrence of multiple price increases during the month. When this is the case, dp+ t overstates the size of individual price increases. The finding of a tight relationship between the average magnitude of price changes and inflation should come as no surprise given the behavior of the frequency of price changes documented earlier. By definition, π t = frt · dpt . When inflation is low, frt moves little with inflation, implying that dpt moves strongly and almost linearly with π t . By contrast, when inflation is high, frt comoves strongly and positively with π t . This second source of variation in π t introduces some curvature in the relationship between π t and dpt . To better understand what drives dpt , it is convenient to express it as ¯ ¯ ¯ −¯ ¯ ¯ ¯ dpt = st · ¯dp+ t − (1 − st ) · dpt ,
¡ ¢ where st = frt+ / frt+ + frt− is the share of price increases among price changes. As this equation
makes clear, fluctuations in dpt can originate from two sources: changes in the relative occurrence
of price increases and decreases (the composition effect) and variations in their respective size. To assess the importance of each margin, I compute two counterfactual series which are displayed in the lower panel of Figure 6. I obtain the first by holding st at its sample mean to show how ¯ ¯ ¯ ¯ ¯ ¯ ¯ ¯ movements in ¯dp+ ¯ and ¯dp− ¯ alone affect dpt . In the second series, ¯dp+ ¯ and ¯dp− ¯ are held at their t
t
t
t
respective sample mean so that the relative occurrence of price increases and decreases is the only source of variation in dpt . The main finding indicates that the composition effect drives dpt when inflation is below 10-15%, whereas movements in both the composition and absolute magnitude of price changes are important when inflation is high. Had st been constant, dpt would have shown a counterfactual gentle rise in the last three years of the sample because of a mild upward trend in dp+ t after 1999. By contrast, the series allowing only for the composition effect predicts remarkably well the level of dpt over that period. When inflation nears its peak, the composition effect alone is 17
The few large spikes in dp− t correspond to large variations in the price of a some fresh produce.
15
insufficient to match the level of dpt , but it is a better predictor than merely allowing for changes in the average absolute magnitude.
5.3
Inflation Variance Decomposition
In order to gauge the relative importance of movements in the frequency and magnitude of price changes for the variance of inflation, Klenow and Kryvtsov (2007) proposed the following decomposition:
2
2
var (π t ) = f r · var (dpt ) + dp · var (f rt ) + 2f r · dp · cov (dpt , f rt ) + Ot2 , | {z } | {z } Intensive margin
Extensive margin
where Ot2 are high-order terms that are functions of f rt . If price changes are perfectly synchronized (staggered), then the intensive margin accounts for none (all) of the variance of inflation. The relative shares of variance accounted for by the intensive and extensive margin terms are thus informative about the degree of staggering in price change decisions in the economy. Using monthly data from the U.S. CPI for the 1988 to 2004 period, Klenow and Kryvtsov find that the intensive margin accounts for about 95% of the inflation variance, while the extensive margin terms, collectively or individually, are small. As shown in Table 3, the Mexican data also points to a minor role for movements in the frequency of price changes when restricted to the low-inflation period after mid-1999. The intensive margin’s share of inflation variance is 89% over that period for the full sample, a proportion that reaches 95% among goods. Over the entire sample period, the intensive margin’s share is only 41.9% of the inflation variance. This finding clearly indicate that fluctuations in f rt play an important role in the dynamics of inflation over the full sample period.
5.4
Effects of the April 1995 VAT Change
On April 1, 1995, the general rate of the VAT rose from 10 to 15%. Changes to value-added taxes are observable shocks that can reveal precious information about the adjustment of individual prices. In Mexico, retailers are required to include the VAT in their sales prices. All else equal, an increase in the VAT squeezes profit margins, thereby creating an incentive to adjust prices upward. In time-dependent models, this adjustment occurs only through larger price changes while in state-dependent models the frequency of price changes is also free to respond. 16
Three features make the April 1995 VAT increase particularly interesting. First, it was relatively large, five percentage points, compared to most changes documented in the related price-setting literature.18 Second, it was largely unexpected. The decree was adopted in a hurry on March 18 and officially published in the Diario on March 27. A large number of price quotes for March 1995 had been collected already when the public learned of the change. The new tax was in full force when price collection started in April. Third, cities located within a corridor along the northern and southern borders, as well as the whole Baja California region, were not subject to the tax change. This geographical variation in the applicability of the tax makes it possible to compute statistics for similar groups of products, both with and without the tax change. I can therefore obtain direct measures of the degree VAT change pass-through to individual prices. The results are presented in Figure 7. The sample is divided into four groups according to whether items are taxed at the general rate or tax-exempt (respectively labeled “general rate” and “excluded items”) and whether they are located in cities affected or unaffected by the change (labeled “Center” and “Border”, respectively). Inflation rates, expressed in the graph as monthly rates, differed markedly across regions and groups of items in April 1995. The inflation rate of center cities exceeded the rate for border cities by 2.9 percentage points in the case of items affected by the general rate. That same month, the difference was −0.7 percentage points between regions for items exempted from the VAT. These differences clearly indicate that most of the tax pass-through occurred within a month. Notably, the adjustment operated mainly through more frequent, rather than larger, price changes. For the items taxed under the general rate, the frequency of price changes in April is 76.5% for the cities affected by the change, and 47.1% for the cities where the rate remained at 10%. For items that are tax-exempt, the frequency of price changes is similar between regions where the general tax rate increased (52.3%) and where it did not (54.2%). The sharp increase in the frequency of price changes was the main channel of inflation passthrough. Direct proof of this conclusion appears at the bottom of Figure 7, where three inflation rates are reported. The first is the actual inflation rate for the cities affected by the tax, π center ; t this rate is the product of the frequency and magnitude of price changes, f rtcenter · dpcenter . The t with their respective values for cities other two series are obtained by replacing f rtcenter and dpcenter t 18
Tax changes have been documented in Spain (Alvarez and Hernando (2006)), Belgium (Aucremanne and Dhyne (2004 and 2005)), France (Baudry et al. (2007)), Portugal (Dias, Dias, and Neves (2004)), Germany (Hoffmann and Kurz-Kim (2006)) and the Netherlands (Jonker et al. (2004)).
17
along the borders. The three series are computed first for items under the general rate (lower-left panel) and then repeated for tax-exempt items (lower-right panel). The predicted inflation rate is almost identical to the actual rate when I replace the magnitude of price changes. However, when I use the frequency of border cities, there is almost no increase in inflation. By contrast to a general rise in inflation, the adjustment to a large, unexpected tax change features a prominent role for the frequency and negligible one for the average magnitude of price changes. Finally, note that inflation rose somewhat more rapidly in border cities over the first few months following the devaluation. This behavior is consistent with the greater exchange rate pass-through along the border. I found the difference in inflation to be particularly large for Food and nonalcoholic beverages and Restaurants and hotels. Although items in the latter category usually are classified as nontradeables, the importance of international tourism in border cities and Baja California might have contributed to the greater pass-through.
6
International Comparisons
Overall, the findings for the low-inflation portion of my sample are broadly consistent with the results reported in U.S. and Euro area studies.19 Evidence on the setting of consumer prices under high inflation is more limited, however, and this section provides a brief review and comparison of the work in this area. Table 4 lists the main empirical studies in high-inflation environments and shows, for each one, the composition of the basket, the average inflation rate and the mean frequency of price changes. In comparison to my Mexican data set, the samples from these studies are relatively small and predominantly composed of food items. In particular, my sample represents a significant broadening of the sample of food prices from the Mexican CPI used by Ahlin and Shintani (2007) in their analysis of price dispersion. Moreover, the sample periods from previous studies are typically restricted to a few consecutive years, which limits the performance of time series analysis. The first study of individual consumer price setting in a high-inflation context was done by Lach and Tsiddon (1992). They considered a sample of 26 food products from the Israeli CPI (mainly meat and alcohol products) during two time periods: 1978-1979 and 1981-1982. For the former 19
See Dhyne et al. (2006) for a review of the main U.S. and Euro area findings
18
period, they found that 46.5% of prices changed every month while inflation averaged 77%.20 The frequency of price changes rose to 60.4% in 1981-1982 as inflation reached an impressive 116%.21 Their results clearly indicate that the frequency of price changes can be very responsive to the rate of inflation. Konieczny and Skrzypacz (2005) study the transition from a planned to a market economy in Poland. They use monthly data on 52 products whose prices were collected from January 1990 to December 1996. Their data set has both larger product and inflation coverage than Lach and Tsiddon (1992). At the peak of inflation in 1990, the price of 59% of items in their basket changed every month, a proportion that halved as inflation fell to just under 20% in 1996. Their results thus confirm that the frequency of price changes is increasing with the level of inflation. Their findings are also consistent with a nonlinear relationship. Inflation moderated 22.8 percentage points as it fell from 60.4% in 1991 to 37.6% in 1993, before falling another 19.1 percentage points from 1993 to 1996. The corresponding declines in the frequency were 9 and 5 percentage points, respectively. The frequency was thus decreasing about 0.4 percentage point for each percentage point of inflation from 1991 to 1993, but then only 0.25 percentage point from 1993 to 1996. One must be very careful when making cross-country comparisons, even when inflation rates are similar, because of large variations in basket composition and methodology. For example, the frequency of price changes reported by Ahlin and Shintani (2007) for their sample of food prices in Mexico in 1995 exceeds by 27 percentage points the one I find in my broader sample of goods and services. Similarly, Burstein, Eichenbaum, and Rebelo (2005) report a frequency of price changes that is similar to that reported by Konieczny and Skrzypacz (2005) for Poland in 1990 (54.5% versus 59%, respectively), even though the rate of inflation in Poland was over six times that of Argentina.22 The studies of Eden (2001) and Baharad and Eden (2004) are possibly the closest in spirit to mine as they make comparisons between low and high inflation periods while controlling for basket composition. They consider a relatively large data set of Israeli CPI data for 1991-1992, a period of relatively low inflation, from which they construct a basket matching up to 23 of the 26 food 20
To facilitate comparisons, all inflation figures in this section are computed in the standard way rather than using logarithmic differences. 21 The figures for the samples considered by Lach and Tsiddon (1992) are taken from Eden (2001). 22 This relatively higher frequency of price changes in Argentina may be related to the type of establishments surveyed (supermarkets). Baudry et al. (2007) report that the outlet size is positively correlated with the frequency of price changes in French CPI data.
19
products in the Lach and Tsiddon (1992) study. Even though the resulting sample is much smaller than mine for Mexico, the findings are very similar. In particular, the frequency of price changes at the peak of inflation (60.4%) is nearly double that for the relatively low inflation sample (34.6%), indicating a major role for the frequency of price changes in the adjustment to a higher inflation rate.
7
Empirical Performance of Menu-Cost Models
In this section, I investigate whether a menu-cost model can correctly predict the average magnitude and frequency of price changes at levels of inflation similar to the ones observed in Mexico over my sample period. The model embeds a distribution of idiosyncratic technology shocks, as originally proposed by Danziger (1999), and has a structure very similar to the model of Golosov and Lucas (2007). This particular model was chosen because it has three desirable features. First, the presence of menu costs gives rise to infrequent, lumpy nominal price adjustments. Second, it leaves the frequency of price changes free to vary with inflation, a feature not found in most time-dependent models and in state-dependent models in which nominal prices adjust every period. Third, it contains idiosyncratic technology shocks generating a distribution of both positive and negative price changes. The first two features imply that, a priori, both the frequency and magnitude of price changes can respond to a change in inflation. The presence of idiosyncratic shocks ensures that individual price changes will be observed even when aggregate inflation is zero. Moreover, the simultaneous presence of price increases and decreases might help to generate offsetting movements in the frequency of price increases and decreases. Throughout the discussion, I focus on a stationary equilibrium with constant aggregate inflation. A discussion of the model’s calibration is relegated to Appendix B.
7.1
Economic Environment
The economy consists of three types of agents. An infinitely-lived representative household supplies labor and consumes a basket of differentiated consumption items. These items are produced by a continuum of monopolistically competitive firms subject to idiosyncratic technology shocks, the only source of uncertainty in the economy. Finally, there is a monetary authority whose sole
20
function is to expand the money supply at a constant rate g. 7.1.1
Households
The problem of the household is to choose a sequence for consumption, {ct }, and for hours worked, {nt }, in order to maximize its present discounted utility, max
{ct ,nt }
∞ X t=0
β t (log ct − ψnt ) ,
subject to a budget constraint, Pt ct = Wt nt + Pt Πt , and a simple money demand, Pt ct = Mt . The variable Pt is the price index at time t, Wt is the wage rate and Mt are the household’s cash balances. Real profits, Πt , are remitted every period by intermediate firms. The budget constraint states that consumption spending equals the sum of a household’s labor income and profits received from firms. Following Golosov and Lucas, I assume that utility is separable, logarithmic in consumption and linear in labor. Under the above assumptions, the intratemporal Euler equation implies that the wage ³R ´ θ θ−1 θ−1 Wt θ dj rate is proportional to the stock of money, ψ = PWt ctt = M . Consumption, c = (c ) , t j,t t is a composite of individual consumption items aggregated using a Dixit-Stiglitz specification. The
corresponding demand for individual items must satisfy cj,t = (pj,t /Pt )−θ ct , where the price index ³R ´ 1 1−θ is given by Pt = (pj,t )1−θ dj . 7.1.2
Intermediate Firms
There is a continuum of measure one of monopolistically competitive firms. At the beginning of each period, firms draw idiosyncratic productivity shocks. They then decide whether to keep selling their item at the same nominal price as in the previous period, or to incur a menu cost (expressed in units of labor), ξ, in order to optimize their price. Once prices are set for the period, firms must satisfy the demand at those prices. The production function of the j th firm is linear in labor, yj,t = φj,t nj,t . I assume that labor ¯ + ρ log φ + εj,t , where technological productivity, φj,t , evolves according to log φj,t = (1 − ρ) log φ j,t ¡ ¢ innovations, εj,t , are drawn from a normal distribution N 0, σ 2ε . Firms maximize the present
discounted value of their profits. It is convenient to express their problem recursively in order
to solve it using dynamic programming techniques. Let V (φ; p) be the Bellman equation of an
21
optimally-behaving firm just before it decides whether to change its nominal price or not. The state of the firm comprises its nominal price relative to the current price index, p, and its technological level, φ. The value function is given by
V (φ; p) = max
{Vnc (φ; p) , Vc (φ)} ,
where Vnc (φ; p) is the value function associated with the firm’s decision to keep its nominal price constant in the current period and behave optimally thereafter, and Vc (φ) is the corresponding value function of a firm choosing to optimize its nominal price in the current period. These functions are expressed as Vnc (φ; p) = π (φ; p) + β and Vc (φ) = max p˜
π (φ; p˜) + β
Z
Z
µ V φ0 ;
µ V φ0 ;
p 1+g
p˜ 1+g
¡ ¢ dμ φ0 |φ .
¡ ¢ W dμ φ0 |φ − ξ , P
respectively. The first right hand-side term, π (φ; p), is the period gross profit function. Taking into account the above production function and demand curve, it is expressed as π (φ; p) = ³ ´ −θ p − φ1 W P p c. The integral gives the expected value function in the next period, taking into
account price erosion due to inflation and the distribution of technology shocks.
7.2
Main Predictions of the Model
As described in Appendix B, the model is calibrated to match the average frequency and magnitude of price changes over the last two years of the sample, a period when annual inflation averaged 4.0%. The model’s predictions are then recorded for steady state inflation rates ranging from 0 to 50%. Despite its relative simplicity, the model matches remarkably well the average frequency of price changes at various levels of inflation, as shown in Figure 8. The diamonds, squares and triangles represent the average monthly frequency of price changes, increases and decreases, respectively, for each calendar year in the sample. The lines indicate the corresponding predictions of the model. As inflation is increased from a low to a high level, the model produces an initially slow rise in the monthly frequency of price changes similar in magnitude to that observed in the data. The model also fares well at reproducing the underlying opposite movements in the frequency of price increases
22
and decreases. The frequency of price increases rises steadily and almost linearly in the model over the range of inflation considered. The corresponding decline in the frequency of price decreases is fastest at low levels of inflation. Overall, the model predicts that the frequency of price increases is more sensitive to a change in steady-state inflation than the frequency of price decreases, consistent with the presence of an asymmetry in the responses, as documented in Section 5. As shown in Figure 9, the model fits equally well the average magnitude of price changes. When inflation is low, the average magnitude of price changes responds almost linearly to a change in steady-state inflation, a counterpart to the weak response of the frequency of price changes. Interestingly, the average absolute magnitude of price increases and decreases vary much less with inflation. Figure 9 thus hints that in the model, as it is the case in the data, movements in the average magnitude of price changes are driven mainly by changes to the relative occurrence of price increases and decreases, not by variation in the absolute size of individual price changes. It has been argued by Rotemberg (2006) that menu-cost models often imply movements in the size of price changes that are too large compared to the data. Rotemberg illustrates this point using a version of the Sheshinski and Weiss (1977) menu-cost model in which idiosyncratic shocks are absent. Under standard specification of demand, he finds that this model overpredicts the response of the size of individual price changes to a variation in steady state inflation. This conclusion does not apply to the menu-cost model considered above: The average absolute magnitude of price changes moves little with inflation. This is despite a clear prediction of menu-cost models that the width of the Ss band widens when steady-state inflation increases23 . In the steady state of the Sheshinski and Weiss model, the average and absolute magnitude of price changes are identical because all price changes are positive whenever inflation is positive. In the Golosov-Lucas model, the two statistics are disconnected due to the simultaneous presence of price increases and decreases. As I have shown, the Golosov-Lucas model is consistent with key features of individual consumer price setting at both low and relatively high levels of inflation. Despite this success, the model suffers from several known inconsistencies with the data. As discussed by Golosov and Lucas (2007) and Midrigan (2006), the model generates too few small price changes and has an implausibly small 23
The gentle fall in the average magnitude of price decreases in Figure 9 seems inconsistent with this prediction. It occurs in the model because the proportion of very large price decreases falls with inflation. As inflation takes off, technology shocks must be increasingly large to generate price decreases of any given magnitude due to greater relative price erosion. Depending on the idiosyncratic shock distributional assumptions, the average magnitude of price decreases might therefore fall over some range of inflation despite a widening of the Ss band.
23
amount of intrinsic persistence. Nevertheless, my findings offer hope that state-dependent models addressing these short-comings, such as models in which the hypotheses of constant and timeinvariant menu costs are relaxed, might provide a good fit for the average magnitude and frequency of price changes if it embeds a distribution of positive and negative price changes.
8
Conclusion
In this paper, I provide new evidence on the setting of individual consumer prices under low and high inflation. To do so, I assembled a large data set of store-level prices that is representative of over half of Mexican consumer expenditures. The number of observations in my sample, over thirty thousand per month, is more than an order of magnitude larger than in other high-inflation studies currently available. Moreover, the sample covers periods of both low and high inflation as well as the transition between the two. The sample starts in January 1994, one year before the Tequila crisis and the sharp increase in inflation that accompanied it, and ends in June 2002, a few years after inflation had been successfully stabilized at a low level. Throughout the paper, I focus on a decomposition of inflation into the product of the frequency and average magnitude of (nonzero) price changes. This decomposition is a useful tool for discriminating between several of the price-setting models suggested in the literature. In particular, models such as Calvo and Taylor contracts, which are widely used in the literature, assume that the frequency of price changes is constant over time. This assumption implies that any adjustment to a change in inflation occurs through the size of price changes. As I have shown, this assumption is clearly problematic for an environment in which inflation is as volatile as it was in Mexico over my sample period because both the frequency and the magnitude of price changes displayed large variations. I find some key differences between the low- and high-inflation periods. When inflation is low (below 10 − 15%), most of the adjustment to inflation occurs through changes in the average magnitude of price changes. The latter is connected to inflation by a tight and near-linear relationship. The frequency of price changes, on the other hand, is only weakly correlated with inflation. By contrast, when inflation is high (above 10 − 15%), both the frequency and magnitude of price changes comove strongly and positively with inflation. Behind these different behaviors of the low- and
24
high-inflation economies lies a key role for idiosyncratic shocks. These disturbances help generate a whole distribution of both positive and negative price changes. As inflation rises from a low level, positive nominal adjustments become increasingly common, while negative ones become less so. These opposite effects of inflation on the frequency of price increases and decreases dampen variations in the overall frequency of price changes. At the same time, they exacerbate movements in the average magnitude of price changes because of its sensitivity to the shares of price increases and decreases. As inflation rises further to a high level, the frequency of price increases continues to rise steadily with inflation. The rate of decline in the frequency of price decreases moderates, however, as few price decreases are left in the economy. Consequently, the frequency of price changes then comoves strongly with inflation. One important challenge is to design price-setting models that offer empirically plausible predictions at both low and high levels of inflation. I showed that a menu-cost model with idiosyncratic technology shocks predicts remarkably well the level of the average frequency and magnitude of price changes over a wide range of inflation. The joint presence of menu costs and idiosyncratic shocks is key to this good fit. Menu costs ensure that nominal adjustments are lumpy and infrequent, two characteristic of price changes shared by most goods and services in my sample. The addition of idiosyncratic shocks helps generate a distribution of both positive and negative price changes that is free to move with inflation. Consistent with the data, my calibration of the model predicts that a large number of price increases and decreases are observed when inflation is close to zero. As inflation increases, the model generates a steady rise in the occurrence of price increases and a simultaneous decline in the occurrence price decreases. Note that the baseline Calvo and Taylor models are not inconsistent with the simultaneous presence of infrequent and lumpy nominal adjustments and a distribution of positive and negative price changes; one could simply augment these models with idiosyncratic shocks. Unless the assumption of a constant frequency of price changes is relaxed, however, these models will inexorably fail to capture an important margin by which individual prices adjust from a low- to a high-inflation environment. Finally, my analysis suggests that the appropriate price-setting model may depend importantly on the characteristics of the underlying shocks. I documented that a large and unexpected hike in the value-added tax was passed-through very rapidly to individual prices. Moreover, most of the adjustment occurred through more frequent, as opposed to larger, price changes. This finding 25
is consistent with other empirical studies showing an important role for the frequency of price changes, even though these shocks were typically smaller and anticipated well in advance. The speed of transmission of such observable tax shocks is much higher than commonly assumed for monetary and technology shocks. Price-setting models generating highly persistent responses to all types of shocks would mispredict the price adjustment entirely.
26
References Ahlin, C. and M. Shintani (2007). Menu costs and markov inflation: A theoretical revision with new evidence. Journal of Monetary Economics 54 (3), 753—784. Alvarez, L. J. and I. Hernando (2006). Price setting behaviour in spain: Evidence from consumer price micro-data. Economic Modelling 23 (4), 699—716. Aucremanne, L. and E. Dhyne (2004). How frequently do prices change? Evidence based on the micro data underlying the Belgian CPI. European Central Bank, Working Paper Series: 331. Aucremanne, L. and E. Dhyne (2005). Time-dependent versus state-dependent pricing - a panel data approach to the determinants of Belgian consumer price changes. European Central Bank, Working Paper Series: 462. Baharad, E. and B. Eden (2004). Price rigidity and price dispersion: Evidence from micro data. Review of Economic Dynamics 7 (3), 613—41. Baudry, L., H. L. Bihan, P. Sevestre, and S. Tarrieu (2007). On inflation and output with costly price changes: A simple unifying result. Oxford Bulletin of Economics and Statistics 69 (2), 139—83. Bils, M. and P. J. Klenow (2004). Some evidence on the importance of sticky prices. Journal of Political Economy 112 (5), 947—985. Burstein, A., M. Eichenbaum, and S. Rebelo (2005). Large devaluations and the real exchange rate. Journal of Political Economy 113 (4), 742—84. Burstein, A. T. (2006). Inflation and output dynamics with state-dependent pricing decisions. Journal of Monetary Economics 53 (7), 1235—1257. Calvo, G. A. (1983). Staggered prices in a utility-maximizing framework. Journal of Monetary Economics 12 (3), 383—98. Danziger, L. (1999). A dynamic economy with costly price adjustments. American Economic Review 89 (4), 878—901. Dhyne, E., L. J. Alvarez, H. L. Bihan, G. Veronese, D. Dias, J. Hoffmann, N. Jonker, P. Lunnemann, F. Rumler, and J. Vilmunen (2005). Price setting in the euro area: some stylized facts 27
from individual consumer price data. European Central Bank, Working Paper Series: 524. Dhyne, E., L. J. Alvarez, H. L. Bihan, G. Veronese, D. Dias, J. Hoffmann, N. Jonker, P. Lunnemann, F. Rumler, and J. Vilmunen (2006). Price changes in the euro area and the united states: Some facts from individual consumer price data. Journal of Economic Perspectives 20 (2), 171—192. Dias, M., D. Dias, and P. Neves (2004). Stylised features of price setting behaviour in Portugal: 1992 - 2001. European Central Bank, Working Paper Series: 332. Dotsey, M., R. G. King, and A. L. Wolman (1999). State-dependent pricing and the general equilibrium dynamics of money and output. Quarterly Journal of Economics 114 (2), 655—90. Eden, B. (1994). The adjustment of prices to monetary shocks when trade is uncertain and sequential. Journal of Political Economy 102 (3), 493—509. Eden, B. (2001). Inflation and price adjustment: An analysis of microdata. Review of Economic Dynamics 4 (3), 607—36. Edwards, S. (1998). The mexican peso crisis: How much did we know? when did we know it? World Economy 21 (1), 1—30. Eichenbaum, M. and J. D. M. Fisher (2004). Evaluating the Calvo Model of Sticky Prices. National Bureau of Economic Research, Working Papers: 10617. Gertler, M. and J. Leahy (2006). A Phillips Curve with an Ss Foundation. National Bureau of Economic Research, Working Papers: 11971. Golosov, M. and R. E. Lucas (2007). Menu costs and phillips curves. Journal of Political Economy 115 (2), 171—199. Hoffmann, J. and J.-R. Kurz-Kim (2006). Consumer price adjustment under the microscope Germany in a period of low inflation. European Central Bank, Working Paper Series: 652. INEGI (various editions). Síntesis metodológica de la encuesta nacional de ingresos y gastos de los hogares. Mexico City, Mexico: Instituto Nacional de Estadística Geografía e Informática. Jonker, N., C. Folkertsma, and H. Blijenberg (2004). An empirical analysis of price setting behaviour in the Netherlands in the period 1998-2003 using micro data. European Central Bank, Working Paper Series: 413. 28
Klenow, P. J. and O. Kryvtsov (July 2007). State-Dependent or Time-Dependent Pricing: Does it Matter for Recent U.S. Inflation? Unpublished manuscript. Konieczny, J. D. and A. Skrzypacz (2005). Inflation and price setting in a natural experiment. Journal of Monetary Economics 52 (3), 621—32. Lach, S. and D. Tsiddon (1992). The behavior of prices and inflation: An empirical analysis of disaggregated price data. Journal of Political Economy 100 (2), 349—89. Lucas, R. E. and M. Woodford (1993). Real Effects of Monetary Shocks in an Economy with Sequential Purchases. National Bureau of Economic Research, Working Papers: 4250. Mackowiak, B. and M. Wiederholt (2007). Optimal Sticky Prices under Rational Inattention. C.E.P.R. Discussion Papers: 6243. Mankiw, N. G. and R. Reis (2002). Sticky information versus sticky prices: A proposal to replace the new keynesian phillips curve. Quarterly Journal of Economics 117 (4), 1295—1328. Midrigan, V. (2006). Menu Costs, Multi-Product Firms, and Aggregate Fluctuations. Unpublished manuscript, Ohio State University. Nakamura, E. and J. Steinsson (October 2007). Five Facts About Prices: A Reevaluation of Menu Cost Models. Unpublished manuscript. Organisation for Economic Co-operation and Development (2000). OECD economic surveys, 1999-2000: Mexico. Paris and Washington, D.C. Rotemberg, J. J. (2005). Customer anger at price increases, changes in the frequency of price adjustment and monetary policy. Journal of Monetary Economics 52 (4), 829—852. Rotemberg, J. J. (2006). Fair Pricing. Unpublished manuscript, Harvard Business School. Sheshinski, E. and Y. Weiss (1977). Inflation and costs of price adjustment. Review of Economic Studies 44, 287—303. Sims, C. A. (2003). Implications of rational inattention. Journal of Monetary Economics 50 (3), 665—90. Taylor, J. B. (1980). Aggregate dynamics and staggered contracts. Journal of Political Economy 88 (1), 1—23.
29
A
Price Averaging
In Mexico, price collectors visit outlets four times every month to collect prices of food items, and they visit twice per month to collect prices for all other items. The prices published in the Diario are an average of the prices collected over the month. In this appendix, I first discuss how observing a price’s average rather than its actual value at a particular point in time impacts inferences about the timing and magnitude of price changes. I then describe how I filtered the data to make the results in this paper more directly comparable to those from studies using prices collected once per month.
A.1
Effects of Averaging on Frequency and Magnitude
Suppose a price collector observes the price of an item twice every month and then computes two monthly time series. The first series is a simple average of the two prices collected over the month (the average-price series). The other series contains the actual price observed at the second visit (the point-in-time series). The average-price series corresponds to Banco de México’s current method, whereas point-in-time series are used in the United States and Euro area. Changes to the monthly average-price series typically are more frequent and of a smaller magnitude than changes to the monthly point-in-time series. To illustrate this point, consider an item whose price is constant over the months t − 1 to t + 1, with the exception of a single adjustment at t. If the price change occurs before the price collector’s first visit at month t, then both prices collected over that month equal the new price. In that case, the average-price and the point-in-time series are identical and correctly reflect the timing and magnitude of the actual nominal adjustment. Similarly, if the price change occurs after the price collector’s second visit during month t, then both the average-price and point-in-time series display a unique price change of the correct magnitude detected at month t + 1. Only when the price change takes place between the two price collections do the average-price and point-in-time series differ. When this is the case, the pointin-time series still accurately matches the timing and size of the actual change in the item’s price. The average-price series, on the other hand, displays two price changes: one at month t and one at t + 1. The second price change is recorded because the average price at t has increased by only half of the change in the actual price.
30
If several price changes occur within a month, then both the average-price and the point-in time series provide an inaccurate description of individual price changes. The change in the end-ofperiod series corresponds to the cumulative change in the price over the period, while the change in the average-price series reflects the change in the average price over the previous period. Under both approaches, the change in the monthly series may be smaller, equal or larger than the price changes that would be recorded were prices collected continuously.
A.2
Filtration of Average Price Trajectories
In the above example, a price change occurring between two price collections created two consecutive price changes of equal magnitude in the average-price series. My strategy for filtering out the impact of averaging entails finding such patterns and then constructing a series for the last price collected during the month that (a) minimizes the number of price changes and (b) is consistent with the observed average prices. More formally, let p1t and p2t be the prices of a nonfood item recorded during month t by the price collector during her first and second store visits, respectively. The ¡ ¢ published monthly average is given by p¯t = p1t + p2t /2. Consider the case of two consecutive
changes in the published average-price series starting at month t. If both changes have the exact same magnitude, that is if p¯t =
p¯t+1− p¯t−1 , 2
then I construct a sequence of semi-monthly observations,
(1) ©¡
p1τ , p2τ
¢ªt+1
τ =t
, that is consistent with
the observed average-price sequence {¯ pτ }t+1 τ =t and features no price change at t + 1. I simply assume that a single nominal adjustment was detected at the collector’s second visit, so that p1t = p¯t−1 and p2t = p¯t+1 . Whenever the filter finds such pattern, it replaces p¯t by p¯t+1 , thus eliminating a potentially spurious price change. A similar approach is used when the published average-price series features up to four consecutive price changes. Considering longer sequences, which are very few, does not improve the fit. Rounding issues aside, there is always at most one sequence of end-of-period prices that is consistent with the published sequence of average prices and features no price change in the last period.24 The filtering of individual food prices, which are collected four times per month, follows the 24
In practice, the filter verifies that both sides of equations 1 and 2 are within 0.005 of each other to allow for possible price rounding.
31
same approach. Suppose the price of a food item is constant during month t − 1, changes once during month t, and then stays constant during month t + 1. If the actual price change is recorded at the collector’s second, third, or fourth visit, then the published average price is
p¯t =
(5 − dt ) p¯t−1 + (dt − 1) p¯t+1 4
(2)
for some visit time dt ∈ {2, 3, 4}. The change in the published price at t is exactly 1/4, 1/2 or 3/4 the total change from t − 1 to t + 1. For such cases, the filter replaces p¯t by p¯t+1 in the same way it is done for nonfood items. When more than two consecutive price changes are observed, there may be more than one combination of detection times {dt+τ }t+N−1 and end-of-period prices that τ =t is consistent with the published average-price series and features no price change in the last period. Filtering these longer sequences of food prices did not appear to improve accuracy.
A.3
Example of Individual Price Trajectory and Filtering
Figure 10 illustrates how the filtering procedure is implemented. The upper-panel displays two years of monthly average prices for a copy of the book “The Universal History of Literature” sold in a Mexico City outlet. From January 1994 to December 1995, there were six changes to this unfiltered series. The first happened in August 1994 when the average price increased from $23 to $25. Because the average price remained at $25 in September, the filter leaves the series unchanged. The next two changes occurred in January and February 1995. The published price for January, $28.5, is the exact average of the published prices for December and February ($25 and $32, respectively). This figure is thus consistent with the occurrence of a single change in the actual price from $25 to $32 during the second half of January. The last three price changes occurred in May, June and July of 1995; the published price increased from $32 to $36.5, then to $47 and finally to $53. This sequence is consistent with a change in the actual price from $32 to $41 after the first price collection in May and then from $41 to $53 after the first price collection in June. The filtered series corresponding to the last observation of each month is displayed at the bottom of Figure 10 (the thick line). It contains only four price changes, and their magnitude is greater on average than those in the unfiltered series (the dotted line).
32
A.4
Discussion of the Filter
Banco de México provided me with unpublished semi-monthly observations for the months of October and November 2006. These data allow me to compare directly filtered and unfiltered prices of nonfood items to a monthly series of actual end-of-period prices, which the filters aims to reproduce. In order to do so, I first extended the data base to December 2006. I then created unfiltered and filtered series in the same way I do for the January 1994 to June 2002 sample.25 For these items, published prices were identical to end-of-period prices observed by price collectors in the vast majority of cases (92.3%, weighted by product categories). The filter correctly left all but a tiny fraction (0.02%) of these observations unchanged. For the remaining cases (7.7%), published prices differed from actual end-of-period prices. Of these observations, about 44.6% were correctly modified by the filter, 54.6% were left unchanged, and 0.9% were replaced by values that still did not match actual end-of-period prices. In short, filtering brings nonfood average-price data closer to actual end-of-period prices while introducing very few mistakes. More importantly, the filtered series capture the timing of individual price changes very well. In 98.4% of nonfood observations, the filtered series either indicated a price change when one was observed in the actual end-of-period series, or indicated no price change when none was observed. Most of the remaining observations are associated with within-period sales for which an end-ofperiod series, contrary to an average-price series, would fail to signal the occurrence of a price change. The filtered series also offer a much better description of nonzero price changes than the unfiltered data. The change in the unfiltered series matched the change in the end-of-period series of actual prices in about a third of all cases, a proportion that rises to 62.0% after filtering. Half of the remaining cases display two price changes within the period, in which case inference about the magnitude of individual price changes is problematic whether one uses end-of-period or average-price series. In the case of food prices, the unpublished semi-monthly data are an average of two weekly prices. A direct comparison with actual price observations is therefore impossible. Inference about the magnitude of individual price changes is likely to be less accurate than for nonfood observations because a much larger proportion of food items witness several price changes within the month. 25
Semi-monthly data are not available for the sample period considered in the paper. Individual items cannot be linked before and after June 2002 due to a change in the nomenclature of item keys.
33
Filtering the data has almost no effect on the main patterns reported in the paper. The number of price changes filtered out in any given period is roughly proportional to the number price changes observed in the unfiltered series. Consequently, movements in the unfiltered and filtered average frequency of price changes are highly correlated. Similarly, filtering raises the average (absolute) magnitude of price increases and decreases rather uniformly. To sum up, even after replacing a large share of the average-price data by their actual end-of-month values, there is almost no change to the pattern of month-on-month changes.
B
Calibration of the Golosov-Lucas Model
Some parameters of the model are taken directly from the literature while others are chosen to match particular moments of the distribution of price changes. For the elasticity of substitution across items, I pick a value of 2, a value lowered than considered by Golosov and Lucas but similar to Klenow and Kryvtsov (2007). The discount factor is set to (1.05)−1/12 , while the log of inflation is calibrated to 0.04/12, its sample average over the July 2000 to June 2002 period. The persistence of technology shocks is set to 0.75, a value similar to that implied by Golosov and Lucas’ quarterly calibration (0.551/3 ≈ 0.82 per month) but higher than Midrigan’s (0.5 per month). The remaining free parameters are the marginal disutility of labor, ψ, the variance of technological innovations, σ 2ε , and the size of menu costs, ¯ξ. The parameter ψ is chosen so that households would work exactly 25% of the time if menu costs were zero. The other two parameters are calibrated so that the model matches exactly the average frequency of price changes and the average absolute magnitude of nonzero price changes over the last two years of the sample. The calibrated values are 0.00302 and 0.00461 for σ 2ε and ¯ξ, respectively. The model is solved using dynamic programming techniques. As a first step, I guess a value for the price index from which I derive aggregate consumption and the real wage. The value functions are then approximated using Chebyshev polynomials. Conditional on the aggregate variables, a fixed point is found by value function iteration and the policy functions are recovered. A long Markov chain is then generated by sampling from the distribution of shocks and by assuming that firms behave according to the policy functions. A price index is computed from the Markov chain and the associated aggregate quantities are derived. Finally, the initial guess for the price index is
34
updated. The procedure is repeated until numerical convergence occurs.
35
Table 1: Main sample Statistics Period
January 1994 - June 2002
Price quotes Total Average per month Trajectories Substitutions Product categories
3,209,947 31,470 44,272 10,457 227
CPI coverage (%)
54.1
Sample composition (%) Unprocessed food Processed food Energy Nonenergy industrial goods Services
26.4 21.7 0.4 26.4 25.1
Table 2: Linear regression results (nonregulated goods) fr All
Restricted
All
Constant
0.252 (0.005)
0.250 (0.008)
0.147 (0.004)
π
0.128 (0.040)
0.136 (0.126)
π2
0.983 (0.162)
π3
fr+ Restricted
fr-
dp Restricted
All
dp+ Restricted
All
dpRestricted
All
Restricted
All
0.140 (0.007)
0.106 (0.002)
0.110 (0.004)
0.006 (0.001)
0.003 (0.001)
0.082 (0.002)
0.079 (0.003)
0.106 (0.004)
0.098 (0.005)
0.265 (0.047)
0.354 (0.132)
-0.137 (0.020)
-0.218 (0.061)
0.242 (0.010)
0.301 (0.015)
0.075 (0.011)
0.127 (0.048)
-0.226 (0.047)
-0.081 (0.094)
1.293 (0.546)
0.888 (0.164)
0.943 (0.568)
0.095 (0.066)
0.350 (0.256)
-0.200 (0.034)
-0.419 (0.078)
0.011 (0.035)
-0.196 (0.185)
0.645 (0.116)
0.195 (0.361)
-0.739 (0.163)
-1.310 (0.589)
-0.740 (0.162)
-1.083 (0.616)
0.001 (0.059)
-0.227 (0.274)
0.065 (0.030)
0.280 (0.088)
-0.028 (0.033)
0.189 (0.195)
-0.462 (0.086)
-0.063 (0.398)
1995
0.012 (0.010)
0.007 (0.011)
0.013 (0.010)
0.005 (0.010)
0.000 (0.006)
0.002 (0.006)
0.003 (0.002)
0.003 (0.002)
-0.006 (0.004)
-0.007 (0.004)
-0.014 (0.006)
-0.019 (0.005)
1996
0.050 (0.009)
0.041 (0.009)
0.049 (0.008)
0.038 (0.008)
0.000 (0.003)
0.003 (0.004)
-0.001 (0.001)
-0.002 (0.001)
-0.010 (0.003)
-0.011 (0.003)
0.013 (0.006)
0.008 (0.005)
1997
0.050 (0.007)
0.047 (0.007)
0.044 (0.006)
0.041 (0.006)
0.005 (0.003)
0.007 (0.003)
-0.002 (0.001)
-0.003 (0.000)
-0.011 (0.003)
-0.012 (0.003)
0.004 (0.003)
0.001 (0.003)
1998
0.056 (0.010)
0.050 (0.009)
0.051 (0.008)
0.043 (0.008)
0.005 (0.003)
0.007 (0.004)
-0.002 (0.001)
-0.003 (0.001)
-0.008 (0.003)
-0.009 (0.003)
0.015 (0.005)
0.011 (0.005)
1999
0.047 (0.007)
0.046 (0.007)
0.039 (0.008)
0.035 (0.007)
0.009 (0.004)
0.011 (0.003)
-0.004 (0.001)
-0.003 (0.000)
-0.008 (0.002)
-0.008 (0.002)
0.010 (0.009)
0.005 (0.008)
2000
0.054 (0.008)
0.054 (0.008)
0.028 (0.005)
0.030 (0.005)
0.026 (0.005)
0.025 (0.005)
-0.004 (0.001)
-0.003 (0.000)
0.001 (0.003)
0.001 (0.003)
0.002 (0.003)
0.004 (0.003)
2001
0.076 (0.006)
0.078 (0.007)
0.033 (0.006)
0.036 (0.007)
0.043 (0.003)
0.041 (0.003)
-0.005 (0.001)
-0.004 (0.000)
0.011 (0.003)
0.011 (0.003)
0.006 (0.003)
0.010 (0.003)
2002
0.085 (0.006)
0.082 (0.005)
0.029 (0.005)
0.027 (0.004)
0.056 (0.003)
0.055 (0.004)
-0.004 (0.001)
-0.004 (0.000)
0.016 (0.002)
0.018 (0.002)
-0.001 (0.004)
0.003 (0.004)
0.92
0.90
0.95
0.95
0.92
0.90
0.99
0.99
0.79
0.77
0.48
0.31
Year Dummies
R2 Notes:
The numbers in parentheses are standard deviations based on the Huber-White estimator of variance. The restricted sample excludes the value-added tax change of April 1995, and all observations associated with negative inflation rates.
36
Table 3: Inflation variance decompositions Inflation Mean Std. Dev.
TDP's Share of Inflation Variance (%)
Full Sample Period (January 1994 - June 2002) Full Sample 14.4 14.2 Nonregulated goods 14.3 16.1 Nonregulated services 14.5 10.0
41.2 48.1 10.5
Crisis (January 1995 - June 1999) Full Sample 21.7 Nonregulated goods 22.5 Nonregulated services 19.1
15.3 17.2 11.0
34.5 41.5 9.8
Postcrisis (July 1999 - June 2002) Full Sample 5.0 Nonregulated goods 3.5 Nonregulated services 9.2
4.4 5.6 4.1
89.2 93.9 18.0
Table 4: Comparison of high-inflation studies Observations a per month
Sample periodb
Inflation c (%, a.r.)
Mean monthly frequency (%)
58 goods sold in 8 supermarkets in Buenos Aires and 10 services
563
Mar. to Dec. 2002
39.7
54.5
Lach and Tsiddon (1992)
26 food products (mostly meat and alcoholic beverages)
258
1978-1979
77.0
46.5
Israel
Lach and Tsiddon (1992)
26 food products (mostly meat and alcoholic beverages)
278
1981-1982
116.0
60.4
Israel
Eden (2001)
23 food products (mostly meat and alcoholic beverages)
254
1991-1992
13.6
34.6
Israel
Eden (2001), Baharada and Eden (2004)
up to 390 narrowly-defined products from the Israeli CPI
2,802
1991-1992
13.6
24
Mexico
Ahlin and Shintani (2006)
44 food products sold in Mexico City
573
1994-1995 (1994) (1995)
7.1 52.0
49.3 66.0
Mexico
Gagnon (2007)
227 product categories, representing 54.1 percent of Mexican consumption expenditures
31,500
1994-2002 (1995) (1996) (1997) (1999) (2001)
52.0 27.7 15.7 12.3 4.4
39.2 32.2 28.3 27.5 27.3
Poland
Konieczny and Skrzypacz (2005)
52 goods, including 37 grocery items, and 3 services
up to 2,400
1990-1996 (1990) (1992) (1994) (1996)
249.3 44.3 29.5 18.5
59 39 32 30
Country
Authors
Argentina
Burstein et al. (2005)
Israel
Sample product coverage
Notes: (a) Author's calculations for Poland. The figures for the Lach and Tsiddon samples are taken from Eden (2001). (b) Selected subsample periods are shown in parentheses. (c) Author's calculations based on the change in the official CPI over the sample period for Argentina, Israel, and Mexico. The figures are not in logarithmic changes, as in the remainder of the paper.
37
Figure 1: Inflation and time coverage of U.S., Euro-area and Mexican CPI studies 45 Austria Belgium Finland France Luxemburg Portugal Spain United-States Mexico
40
Four-quarter change in official CPI (%)
35
30
25
20
15
10
5
0 1988
1989
1990
1991
1992
1993
1994
1995
1996 1997 1998 1999 Period covered by country studies
2000
2001
2002
2003
2004
2005
2006
Notes: The studies shown are representative of at least 50% of consumer expenditures. Data on inflation comes from the OECD Main Economic Indicators, Banco de México, and the BLS. The sample period for the United States corresponds to the study of Nakamura and Steinsson (2007). Full references to the Euro-area country studies can be found in Dhyne et al. (2005).
38
Figure 2: Main macroeconomic indicators a) Pesos per USD (logs, end-of-month, 1994M1=0)
b) Inflation rate 100
100 %
%
50
50
0
0 94 95 96 97 98 99 00 01 02 03 04
-50 94 95 96 97 98 99 00 01 02 03 04
c) Interest rate on 91-day Cetes (annualized)
d) Money aggregates (logs, 1994M1=0)
80
200 M1 M4
150
60
100 %
%
40 20
50 0
0 94 95 96 97 98 99 00 01 02 03 04
-50 94 95 96 97 98 99 00 01 02 03 04
e) Real output (logs, 1994Q1=0)
f) Real consumption (logs, 1994Q1=0)
60
40 30
40
20 %
%
20 0
10 0
-20 94 95 96 97 98 99 00 01 02 03 04
-10 94 95 96 97 98 99 00 01 02 03 04
Source: Banco de México.
Figure 3: Frequency of price changes (nonregulated goods) a) Frequency of price changes and inflation
90
frequency inflation
80 70 60
%
50 40 30 20 10 0 -10 1994
1995
1996
1997
1998
1999
2000
2001
2002
b) Frequency of price changes, increases and decreases
70
changes increases decreases
60 50
%
40 30 20 10 0 1994
1995
1996
1997
1998
39
1999
2000
2001
2002
Figure 4: Scatterplot of the average frequency and magnitude of price changes and inflation (nonregulated goods) Frequency of price changes
Magnitude of price changes
70
15
10
Magnitude (%)
Frequency (%)
60 50 40
5
0 30 20
−5 0
20 40 60 Inflation (%) Frequency of price increases
80
0
20 40 Inflation (%)
60
80
Magnitude of price increases
70
20
15
50
Magnitude (%)
Frequency (%)
60
40 30 20
10
5
10 0
0 0
20 40 60 Inflation (%) Frequency of price decreases
80
20 40 Inflation (%)
60
80
Magnitude of price decreases
25
20
20
15
Magnitude (%)
Frequency (%)
0
15 10
10
5 5 0
0 0
20 40 Inflation (%)
60
80
0
20 40 Inflation (%)
data Regression: all observations Regression: excluding π<0 and VAT change
40
60
80
Figure 5: Frequency of price changes (nonregulated services) a) Frequency of price changes and inflation
90
frequency inflation
80 70 60
%
50 40 30 20 10 0 -10 1994
1995
1996
1997
1998
1999
2000
2001
2002
b) Frequency of price changes, increases and decreases
60
changes increases decreases
50
%
40 30 20 10 0 1994
1995
1996
1997
1998
41
1999
2000
2001
2002
Figure 6: Average magnitude of price changes (nonregulated goods) a) Magnitude of price changes vs inflation 15
average change monthly inflation
%
10 5 0 −5 94
95
96
97
98
99
00
01
02
b) Magnitude of price changes, increases and decreases 20 changes increases decreases
15
%
10 5 0 −5 94
95
96
97
98
99
00
01
02
c) Predicted average change 15
actual fixed magnitude fixed share
%
10 5 0 −5 94
95
96
97
98
99
42
00
01
02
Figure 7: Effect of April 1, 1995 VAT change
a) monthly inflation − general rate
b) monthly inflation − excluded items
10
10 Center Border
8
Center Border
8 %
6
%
6 4
4
2
2
0 94m10
95m1
95m4
95m7
0 94m10
95m10
95m1
c) frequency − general rate 80
95m7
95m10
80 Center Border
Center Border
60 %
60 %
95m4
d) frequency − excluded items
40 20
40 20
0 94m10
95m1
95m4
95m7
0 94m10
95m10
95m1
e) magnitude − general rate
95m4
95m7
95m10
f) magnitude − excluded items
15
15 Center Border
Center Border %
10
%
10
5
5
0 94m10
95m1
95m4
95m7
0 94m10
95m10
g) predicted inflation − general rate (Center)
95m1
95m4
95m7
95m10
h) predicted inflation − excluded items (Border)
10
10 Actual Border fr Border dp
8
Actual Border fr Border dp
8 %
6
%
6 4
4
2
2
0 94m10
95m1
95m4
95m7
0 94m10
95m10
95m1
95m4
95m7
95m10
Figure 8: Average frequency of price changes predicted by the model compared to the sample annual averages 45%
40%
35%
Frequency
30%
25%
20%
15%
10%
5%
0% 0%
5%
10%
15%
20%
25%
30%
35%
40%
45%
Annual inflation Changes (data) Increases (model)
Increases (data) Decreases (model)
43
Decreases (data)
Changes (model)
50%
Figure 9: Average magnitude of price changes, increases and decreases predicted by the model compared to the sample’s annual averages 12%
10%
6%
4%
2%
0% 0%
5%
10%
15%
20%
25%
30%
35%
40%
45%
Annual inflation Changes (data) Increases (model)
Increases (data) Decreases (model)
Decreases (data)
Changes (model)
Figure 10: Illustration of a price trajectory correction Observed average price series 60
$
50
40
30
20
Mar-94
Jun-94
Sep-94
Dec-94
Mar-95
Jun-95
Sep-95
Dec-95
Jun-95
Sep-95
Dec-95
Corrected series 60
50
$
Average magnitude
8%
40
30
20
Mar-94
Jun-94
Sep-94
Dec-94
Mar-95
Note: The dashed line represents the actual monthly average price published in the Diario of a single copy of the book "The Universal History of Litterature" sold in a Mexico City outlet. The solid line represents the filtered point-in-time series.
44
50%