Primary Elections and Candidate Ideology: Out-of-Step with the Primary Electorate?*
David W. Brady Stanford University Hahrie Han Wellesley College Jeremy C. Pope Brigham Young University
* The authors would like to thank Will Bullock, Shawn Chen, Kenneth Gerold, Jonathan Ma, Justin Ma, Julia McKinney, and Sam Tyre for their invaluable assistance in collecting the data. We would also like to thank John Aldrich, Steve Ansolabehere, Mo Fiorina, and three anonymous reviewers for their very helpful comments on the paper.
Abstract
This paper draws on a new dataset of House primary and general election outcomes (1956-1998) to examine the relationship between primary elections and candidate ideology. We find that like presidential candidates, congressional candidates face a strategic positioning dilemma between their general and primary election constituencies. Relative to general election voters, primary voters favor more ideologically extreme candidates. This creates a strategic dilemma for incumbents. We find that congressional candidates handle the dilemma by positioning themselves closer to the primary electorate. This paper thus supports the idea that primaries pull candidates away from median district preferences.
Congressional primaries have recently received more attention as a potential source of increasingly polarized candidate behavior (e.g. Hacker and Pierson 2005; Galderisi, Ezra, and Lyons 2001; McCarty, Poole, and Rosenthal 2006; Ansolabehere, Snyder, and Stewart III 2001; Fiorina 1999). Yet, we still lack a systematic exploration of congressional primary elections and their effect on candidate behavior. Some formal models specify the conditions under which candidates are likely to diverge ideologically (e.g. Wittman 1977; Aldrich 1983; Calvert 1985; Alesina 1988) and some early empirical work indicates that candidates respond to primary election constituencies differently from general election constituencies, especially in the Senate (e.g. Francis et al. 1994; Gerber and Morton 1998; Schmidt, Kenny, and Morton 1996; Brady and Schwartz 1996; Burden 2001). This paper builds on this literature and a newly assembled dataset of all House primary election returns from 1956 to 1998 to systematically examine the relationship between primary elections and candidates’ policy positions. Much of the intuition about primary elections and their effect on candidate behavior comes from our knowledge of presidential primaries. In presidential elections, primary voters are often more ideologically extreme than general election voters (Polsby and Wildavsky 1978; Norrander 1989)1, and delegates to presidential nominating conventions are more extreme than the broader electorate (Stone and Rapoport 1994; Soule and McGrath 1975; McClosky, Hoffman, and O'Hara 1960). This divergence between the two constituencies presents presidential candidates with a strategic dilemma: how can they please the primary constituency enough to secure the nomination, but still maintain electability in the general election? Existing research indicates that presidential candidates respond to this strategic dilemma by moving towards their primary base to secure the nomination (Aldrich 1995; Schlesinger 1991; Polsby and Wildavsky 2004).2
In principle, this story should also apply at the congressional level, where candidates face a similar two-stage election. Do congressional candidates also diverge from the general election constituency and steer towards their primary base? To understand this, we must answer two questions. First, do congressional candidates face a strategic positioning dilemma between divergent primary and general electorates? Second, if the primary and general election constituencies diverge in congressional elections, then how do congressional candidates respond to the strategic dilemma? This paper examines each question in turn. First, we argue that congressional candidates do, in fact, face an important strategic positioning dilemma. We show that primary constituencies tend to favor more extreme candidates than general election constituencies, and that challengers create a credible electoral threat for incumbents by catering to the primary constituency. Second, given this strategic dilemma, we argue that congressional candidates hew to the preferences of the primary constituency. We show that primary losses are most likely to occur among ideologically moderate legislators who diverge from the primary constituency—but that these losses are strikingly rare. In addition, we find that candidates learn, over time, to position themselves close enough to the primary constituency to ward off electoral defeat. The paper proceeds as follows: the next section goes into greater depth on the strategic dilemma faced by congressional candidates. The third section empirically examines the nature of the strategic positioning dilemma, including the divergence between the primary and general election constituencies, and the behavior of primary challengers. The fourth section addresses the question of candidate response to this strategic dilemma. Both sections rely primarily on data collected from America Votes, which includes the vote totals of all candidates running in congressional elections (primaries and generals) between 1956 and 1998.3 The final section
4
concludes and outlines the continuing research project.
Strategic Choices in Congressional Primaries Examining the relationship between congressional primaries and candidate positioning involves a two-part argument. Before considering what the rational ideological position of the candidate is, we must first consider whether congressional candidates face a real strategic dilemma in how to position themselves between the two constituencies. Are there truly two distinct constituencies that force the candidate into a strategic choice? For a strategic dilemma to exist for congressional candidates, the preferences of the primary electorate should be distinct from the preferences of the general electorate, and there must be a credible threat of electoral loss presented by primary challengers. Previous research on the Senate finds some empirical support for this two-constituency hypothesis (Francis et al. 1994; Gerber and Morton 1998; Schmidt, Kenny, and Morton 1996; Brady and Schwartz 1996), but research on the House remains scant. In part, this is because finding consistent data on House primary constituencies and challengers is difficult. Nonetheless, we can derive three key observable hypotheses. For congressional candidates to face a strategic positioning dilemma, three observable conditions should be true. First, candidates who are at or too close to the preferences of their general election constituency should fare worse in primary elections. Previous research has shown that candidates who are out of line with the general district constituency are more likely to lose in the general election (Canes-Wrone, Brady, and Cogan 2002). If there are two distinct constituencies, then candidates who do well in one (the general) should do worse in the other (the primary). Second, ideologically moderate candidates should be more likely to attract primary opposition. Divergent preferences in the primary electorate present a threat to the
5
incumbent only if primary challenges are somehow tied to ideology. If primary challengers never punished incumbents for ideological moderation, the strategic dilemma would not exist even if preferences diverged. Third, primary challengers should position themselves close to the preferences of the primary election constituency. Incumbents face a credible threat of loss only when challengers cater to the primary constituency. Then, incumbents are punished for ideological moderation with more ideologically-based challenges in the primary. Together, these three conditions substantiate the idea that congressional candidates face a strategic positioning dilemma. The first demonstrates a divergence in the preferences of the two constituencies, and the last two show that a credible threat of electoral loss exists (in spite of the fact that few incumbents actually lose primary elections).4 Given the existence of a strategic dilemma, the basic problem becomes one of candidate positioning. If the primary and general election constituencies diverge, then candidates must decide where to position themselves between the two constituencies. Obviously, candidates might try to use Nixon’s strategy of “run to the right” in the primaries and then “run to the middle” in the general election. But this seems challenging for congressional candidates since congressional incumbents (the focus of this study and most others in the congressional elections literature) build up a single, much longer legislative record than presidential candidates. In addition, because most congressional elections are low-salience affairs for the general public, they become even more salient for small groups of primary voters (Key 1956) who would recognize—and likely punish—a candidate who tried to straddle the line between the two constituencies. This punishment could occur in the primary or the general election, where elite activists often mobilize other voters, and candidates who are “out of step” with the electorate are more likely to lose (Canes-Wrone, Brady, Cogan 2002). Thus, tacking back and forth between
6
the two constituencies presents a risky choice for risk-averse legislators (see Mann 1978 for a description of nervous incumbents). Moreover, candidates have to protect their reputation for reliability. Perceptions of “flip-flopping” or even a lack of clarity about candidate positions can hurt candidates in elections (Alvarez 1997).5 It is certainly possible that under some circumstances candidates can portray their record one way in a primary election and in a different light for the general election, but there are grave risks involved. At a minimum, candidates will do what they can to avoid those risks. How, then, will candidates position themselves? We argue that congressional candidates, like their presidential counterparts, are forced to please their primary election constituency by positioning themselves away from the median voter. The Downsian model (1957) predicts that rational candidates will converge to the median voter. However, a large body of empirical research has demonstrated that congressional candidates and parties consistently diverge from each other (e.g. Ansolabehere, Snyder, and Stewart III 2001; Erikson and Wright 2005; Erikson and Wright 1997; Shapiro et al. 1990; Poole and Rosenthal 1991).6 Formal theory has specified a variety of reasons why candidate divergence might emerge from spatial competition, including factors like differential turnout, party activists, potential third-party candidates, and the policy preferences of candidates themselves (e.g. Grofman 2004; Wittman 1977; Aldrich 1983; Enelow and Hinich 1982; Snyder 1994; Fiorina 1974).7 In particular, work by Aranson and Ordeshook (1972), Coleman (1971), and Owen and Grofman (2004) find that a two-stage electoral process can lead to divergence of candidate positions, particularly when the model allows for some strategic voting among primary voters. When faced with two separate constituencies, in other words, the rational choice for candidates can be, under many circumstances, to choose an ideologically more extreme position.8
7
This strategic choice is challenging to demonstrate empirically, since the observable implications of candidates catering to a primary constituency are difficult to disentangle from other potentially polarizing effects (such as partisanship or personal ideology). Nonetheless, we can examine data on primary losses and candidate responses to historical shifts in the number of primary losses. If candidates respond to the strategic dilemma by steering towards their primary base, we should observe two conditions: first, primary losses should occur primarily among ideologically moderate candidates. These candidates are punished for making the wrong choice, while candidates who cater to the primary constituency are not. Second, historical data can illuminate the extent to which primary elections exert an effect on candidate behavior. In the post-WWII era, the number of primary losses increased significantly around the late 1960s and early 1970s. This historical change should have an impact on the decision calculus of congressional candidates: as candidates learn that primary losses can be a serious threat (perhaps due to the explosion of electioneering among organized interests) the number of primary losses should decline relative to the number of general election losses. In addition, we expect that members after the 1970s position themselves closer to their primary constituencies. In sum, there are two main parts to our argument. First, many congressional candidates face a strategic dilemma in how to position themselves between the general and primary electorates. Second, candidates generally respond to this dilemma by hewing to the primary electorate. Showing each of these empirically is difficult, but we rely on a set of observable conditions that should be true. To show that the strategic dilemma exists, we demonstrate that (1) the dynamics of candidate ideology and election outcomes are opposite in primary elections from general elections, (2) that ideologically moderate candidates are more likely to draw challengers, and (3) that primary challengers position themselves to the left of Democratic
8
incumbents and to the right of Republican incumbents. To show that candidates respond to this dilemma by steering towards their primary base we show that (1) primary losses are most likely to occur among ideologically moderate candidates, and (2) that congressional candidates learned over time to cater to the primary base.
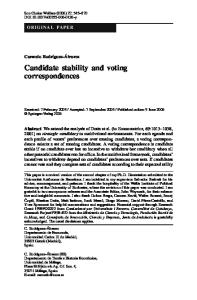
The Strategic Dilemma between Primary and General Election Constituencies To examine whether a difference exists in the preferences of the primary constituency and the general constituency, we look first at the kinds of candidates who tend to do well in the primary election. As previously noted, candidates who ideologically stray from their general election constituency will do worse in general elections (Canes-Wrone, Brady, and Cogan 2002). The opposite should be true for primaries. We start by developing a measure of the candidate’s distance from the general election constituency. Consistent with earlier research (Erikson and Wright 1997; Erikson and Wright 1993; Ansolabehere, Snyder, and Stewart III 2000; CanesWrone, Brady, and Cogan 2002), we use presidential vote as a measure of the district’s general preferences.9 To measure distance from the general electorate, we regress candidate ideology, measured by 1st dimension DW-Nominate scores, on presidential vote in the district. Figure 1 presents a graph of the results for one fairly representative year.
(Insert Figure 1 about here) In the graph, candidates who are perfectly in-step with their constituency fall very close to the predicted line. Candidates who diverge from their general district preferences fall above or below the line. The distance between a legislator’s actual position and the line (the residual) is a measure of the member’s ideological distance from the general election constituency. The larger the residual, the further the member is from the general election constituency.10 Note that the
9
sign of the residual also matters. In particular, we expect that Republicans pulled by their primary constituencies will (on average) be more conservative than their district and fall above the line (positive residuals). Conversely, Democrats pulled by their primary constituencies should generally be more liberal and fall below the line (negative residuals). Thus, candidates who have positioned themselves away from the more moderate general election constituency in the expected direction should win a larger share of the primary vote than their counterparts who voted closer to the district median. Thus, the basic model is a regression of the incumbent’s percentage of the primary vote on the incumbent’s ideological position relative to the general electorate.11 We run the regressions separately for each party, since the direction of the expected effects are opposite for Republicans and Democrats—Democrats who are more liberal should be safer in the primary election, while Republicans who are more conservative are likely to be safer. In both models, we restricted the sample to contested races.12 The main independent variable of interest in all three models is a measure of distance from the general election constituency (described above). All three models also include a dichotomous variable for Southern states (defined as the Confederacy) to control for the possibility that the effects of primary elections are different in the one-party South (Black and Black 2002), and a second dummy variable for redistricting,13 since this can effectively give the incumbent a new constituency base and alter the relationship between the incumbent and her constituents. We also include a variable for the number of terms the incumbent has served in the House, since less experienced candidates have had less time to build up their primary constituencies (Fenno 1978). Because some previous research has found that the ideology of winning candidates in closed primaries is more extreme than the ideology of winning candidates in open primaries (Gerber and Morton 1998), we include two variables for
10
the type of primary election: open primaries (where voters need not be registered partisans to participate) and closed primaries (where voters must be a declared partisan ahead of time). Semiclosed primaries (where voters may register on the day of the primary) are the omitted category.14 Finally, to ensure that our results are not confounded by the level of competitiveness in the race (Jacobson 2001), we examine two measures of competitiveness: the total number of challengers in the race and the total amount of money raised in the election (included as a logged variable).15 Because more competitive races have more challengers and higher fundraising levels, we can see how competitiveness affects the relationship between candidate positioning and primary vote outcomes. Table 1 presents the results of these regressions. We find that the results are largely consistent with our predictions, particularly among Democrats.
(Insert Table 1 about here.) In the first model, the key variable—distance from the general election constituency—is significant in the expected direction for both parties: Republicans who are more conservative than their district and Democrats who are more liberal have higher vote margins in the primary election. The substantive effect is modest, as becoming one standard deviation more conservative relative to the general election constituency is equivalent to a 1% increase in Republican vote shares and a 1% decrease in Democratic vote. Importantly, the main effect on our key variable of interests is opposite from what we observe in general elections and implies that there is a divergence between the two constituencies. The coefficients on the other variables are also consistent with our predictions. Southern Democrats and incumbents affected by redistricting generally have lower primary vote margins. Southern Democrats generally received 4% less than their counterparts. This is consistent with
11
the history of the one-party South, during which the general election was meaningless and, instead, the Democratic primary was the actual deciding election (Black and Black 2002). Redistricting also lowers incumbent vote percentages by about 4% in both parties, as new voters are brought into the district. In addition, we find that holding member ideology constant, seniority helps. Members who have had time to build up a primary constituency in the district gain about half a percentage point with each year of experience. Closed primaries have a negative effect on vote margins, producing more contested races, but open primaries have no statistically significant effect.16 The variable with the largest substantive impact in the first model in Table 1 is the total number of challengers. Obviously, the more challengers there are, the more difficult it is to garner large majorities. For both parties, each additional challenger lowers the incumbent’s primary vote percentage by approximately 12%. This variable has an interesting relationship to money. Because of the relatively small number of years of data available from the FEC, we lose approximately half of the cases when we add total amount raised into the model (2nd model in Table 1). Nonetheless, we can see that money is associated with competitiveness because margins are lower in the races with high levels of fundraising. In addition, among Democrats, the relationship between candidate ideology and primary vote margin remains the same— Democratic incumbents who are further from their district do better in the primary. Among Republicans, the sign for our key ideology variable is still in the right direction, but the significance has diminished. We suspect that this is because of the loss of a number of cases, and that with additional cases, the uncertainty surrounding this coefficient would diminish. In fact, adding total funds raised to the model increases uncertainty around all of our variables. Tests for multicollinearity indicated that total amount raised and the total number of challengers were
12
highly collinear. The third model thus drops the total number of challengers and includes just total amount raised. The explanatory power of the third model decreases considerably, and the substantive effect of variables like ideological positioning and redistricting increases considerably. In this model, a one standard deviation increase in conservatism relative to the general district results in a 2% jump for Republicans, and a 2.5% drop for Democrats. Redistricting now has a huge effect, decreasing Republican vote percentages by about 15% and Democratic vote percentages by 12%. These results indicate that a key factor in determining the incumbent’s primary vote margin is the number of challengers she draws, whether she is vulnerable because of redistricting or her ideological positioning. These findings thus lay the groundwork for examining the second condition necessary for a strategic dilemma to exist. We hypothesized that candidates who were ideologically more moderate rendered themselves vulnerable and would be more likely to draw primary opposition. The findings in Table 2 confirm this hypothesis. We ran a simple regression of the number of primary challengers on the incumbent’s ideological distance from the general election constituency. We also included controls for the South, redistricting, seniority, and the incumbent’s vote percentage in the previous general election and primary election. These variables all control for competitiveness, helping us to see the independent effect of candidate ideology.
(Insert Table 2 about here). As expected, Democrats who are conservative relative to their districts and Republicans who are liberal are significantly more likely to draw primary opposition. Interestingly, candidates with higher vote margins in the previous general election are slightly more likely to draw opposition in the primary, even though they are presumably safer in the general election. Additionally,
13
candidates with higher vote margins in the previous primary elections are less likely to draw challengers. This reinforces the idea that the two constituencies are, in fact, quite different. It also indicates that candidate ideology is closely tied to the number of challengers an incumbent faces. Because the number of challengers was found to be the key determinant of the incumbent’s primary vulnerability (each challenger could decrease the incumbent’s vote share by 12% in Table 1), it is important that the number of challengers is largely tied to the ideological positioning of the incumbent. Incumbents who veer away from their primary constituency are much more likely to draw challengers and, thus, are more vulnerable to primary defeat. The third condition necessary for a true strategic dilemma to exist is the presence of ideologically extreme primary challengers. In other words, the divergence of primary and general election constituencies is a problem for incumbents only if primary voters have an alternative candidate they could choose who is closer to their preferences. Unfortunately, since most primary challengers lose, we do not have any systematic measures of their ideological positions. We did, however, examine newspaper and journalistic accounts of congressional primary losses from 1982-2000 to determine the ideological location of challengers. To maintain consistency, we used two sources: the bi-annual Almanac of American Politics, and the weekly newspaper, Roll Call. These publications consistently covered all the primary races in which the incumbent lost. We found that in 71% of the cases, primary challengers were ideologically more extreme than the incumbent.17 For instance, in the race to defeat incumbent Michael Forbes (D, NY-1) in 2000, Roll Call reported that one of the challenger’s campaign ads read, “[Forbes is] 100 percent against a woman's right to choose…In fact, he is strongly supported by the nation's largest conservative anti-abortion group. Forbes received a 100 percent rating from Pat Robertson and the Christian Coalition. Regina Seltzer strongly supports a woman's right to choose. And will fight hard to preserve Roe v. Wade."18
14
In another race, incumbent Billy Lee Evans (D, GA-8) was beaten by challenger Roy Rowland in 1982. The Almanac of American Politics reports, “The 8th district is a lesson in point for those who thought that the safest political course for a southern Democrat was to support the Reagan administration…. [Evans’] support for Reagan ended up causing him a lot of political trouble—and helped defeat him in the 1982 Democratic primary…[His chief opponent, Rowland,] attacked Evans for supporting the Reagan budget and tax programs and called for reducing the deficit instead” (295). In these cases and most others, Democratic incumbents who were too conservative for their primary constituency were beaten by more liberal primary challengers (and vice versa for Republicans). Although this examination of media accounts is not a perfect test, it does substantiate our argument that the third condition is in place—namely, that primary challengers often challenge incumbents from the ideological extreme. It seems clear from our findings that a strategic dilemma does, in fact, exist for congressional candidates. Primary electorates favor different candidates than the general electorate, and challengers are quick to find ideologically vulnerable incumbents. Why are primary elections a better venue for more ideological interests? Key (1964) writes, “[I]t seems evident that certain classes of persons, by voting heavily in primaries, gain special influence at this crucial stage in the democratic process” (p. 581). Low turnout elections are a smaller electoral venue where small groups of ideological voters can have disproportionate impact on the outcome (Aldrich 1983). Figure 2 illustrates the average turnout for contested primary and general elections for the period 1956–1998. General election turnout is, on average, approximately three times the size of primary election turnout. Even in the most contested primaries—where the incumbent lost—average turnout was around 90,000 voters, still considerably lower than turnout in the general election. Although fewer voters do not necessarily imply different voters, it is clear that the subset of voters voting in the primary is
15
likely an unrepresentative subset of the general electorate. Moreover, unlike the general election, turnout is relatively stable across both on- and off-presidential election years in primaries, suggesting that primary elections draw a more stable base of voters. In the general election, turnout is consistently higher in presidential election years, and drops in off-years.
(Insert Figure 2 about here) In sum, to demonstrate that congressional candidates face a strategic positioning dilemma, we expected three conditions to be true. First, the effects of candidate ideology on vote margins are different in primary elections and general elections. While candidates who are closer to the preferences of the general election constituency do better in general elections, they do worse in primary elections. In fact, Democrats who are more liberal than their district, and Republicans who are more conservative than their district do better in primary elections. Second, threat of electoral loss in the primary is made credible by the fact that ideological moderation generally leads to more primary challengers and an increase in challengers makes an incumbent much more vulnerable. Finally, available data on primary challengers indicates that they do, in fact, tend to be ideologically more extreme than the incumbents. These three conditions support the idea that there is a strategic dilemma presented to congressional candidates.
The Response of Congressional Candidates to the Strategic Dilemma The question now is how do candidates position themselves between the divergent preferences of the primary and general electorates? In this section, we argue that congressional candidates respond by hewing closer to their primary constituency. It is observationally difficult to examine candidate positions and disentangle the effect of primary elections from things like
16
party pressure. We can, however, examine primary losses to see if candidate ideology contributes to primary loss. We begin with some descriptive data on incumbents who lost in the primary, and compare them to those who won. The data is broken out by decade to examine the possibility of historical trends in the data.
(Insert Table 3 about here) The first point to make is that primary losses are truly rare events. Across the 9,560 races in our dataset, there are only 122 primary losses, about 1% of all primary races. Consistent with our expectations, primary losers are generally more ideologically moderate than the winners. Losing Democrats are more conservative with respect to the general constituency than winning Democrats, and losing Republicans are more liberal than winning Republicans. Additionally, primary losers are generally quite junior. For instance, in the 1980s, the typical House Democrat had served almost six terms, but the average primary loser had served only 1.6 terms. Across all decades and in both parties, primary losers have, on average, served two fewer terms than their peers. The descriptive data supports our hypothesis that primary losses are most likely to happen among ideologically moderate candidates. We also run a simple logistic regression of primary loss on ideology and other measures of competitiveness. The dependent variable is coded 1 for a defeat and 0 for a victory. We subset the sample by party and present the results in Table 4. Like our analyses of vote percentage, we restrict the sample to contested races and run three different models.
(Insert Table 4 about here.) With respect to the ideological dynamics, the results are much as expected: liberal Democrats are
17
less likely to lose in their primary election.19 Holding all other variables at their mean, a one standard deviation increase in conservatism increases the probability of loss among Democrats by half a percentage point. Although these results initially seem negligible, given that only 1% of all incumbents lost, half a percentage point seems more significant. Among Republicans, the results move in the expected direction, but are not statistically significant—perhaps because primary losses are such a rare event among Republicans. Interestingly, throughout all the models, the effect of seniority on primary loss is clear and statistically significant. Democrats and Republicans who have served more terms in office are much less likely to lose. Predicted probabilities show that a Democrat who has only served one House term has a 4% chance of primary loss, while a Democrat who has served two terms has only a 2% chance. In other words, one term’s difference cuts the Democrat’s chance of primary loss in half. For Republicans, a freshman member has a 2% chance of losing, while a member who has served two terms has a less than 1% chance of primary loss. Senior members, in other words, are less likely to lose— presumably because they have had time to build up a primary constituency. Increased competitiveness due to redistricting and an increased number of challengers can also have a statistically significant effect on increasing the probability of loss. Here, the primary election system variables appear not to matter for incumbent losses: neither open nor closed primaries have anything approaching a statistically significant effect, no doubt in large part because primary losses are very rare events. This is also mostly true for money raised in primary elections. Although the variable moves in the expected direction, the results are not significant (except in the third model for Democrats). Given the extremely small number of losses, the fact that this statistical procedure turns up a significant effect at all (even if only for Democrats) is impressive. These results suggest that legislators—though adept at avoiding a
18
serious primary challenge—do need to respect the possibility of primary election defeat. Though it is a low probability event, a moderate legislator, particularly among Democrats, is in danger of losing her seat in the primary election. To think further about the pattern of primary losses, we turn to some qualitative data on the history of primary elections. There is reason to believe that the social movements of the 1960s and 1970s spawned a greater number of ideological voters and the rise of new issues on the public agenda. Research has shown a burgeoning of organized interests emerging from this time period (Berry 1984; Berry 1989; Schlozman and Tierney 1986) and there is speculation that these activists are more likely to play a role in primary elections. Qualitative data on primary losses during this time period indicates that candidates who did not appeal to an ideological base fared worse in the primary. In 1970, a number of the incumbents who lost in the primary lost because of the opposition of an organized interest.20 In California’s district 7 (Berkeley), Ronald V. Dellums defeated liberal incumbent Jeffery Cohelan (a former labor organizer) by emphasizing his affiliation with the Black Panthers. In Colorado’s district 1, Democrat Byron Rogers had held the seat since 1950. Craig Barnes organized an effective primary challenge against him by taking advantage of disaffected environmentalists and peace activists in the district, who were disillusioned with Rogers. In Maryland’s district 4, Democratic incumbent George Fallon, who had served from 1944-1970, was defeated by the insurgent Paul Sarbanes, who took advantage of his personal friendship with Ralph Nader and financial and volunteer support from peace and ecology groups. In Maryland’s district 7, Parren Mitchell also relied on the support of activist peace groups and his brother’s affiliation with the NAACP to defeat the incumbent. In New York’s district 19, long-time civil rights activist Bella Azbug campaigned hard to defeat incumbent Leonard Farbstein (Barone, Ujifusa, and Matthews 1972). In these and
19
multiple other cases around 1970, interest groups were able to organize for and against candidates, making themselves a potent force in primary elections. Two of the perhaps most striking stories come from 1972. In Colorado’s district 4, and Nevada’s at-large seat, environmental groups were able finally able to defeat long-standing environmental foes, Wayne Aspinall and Walter Baring. Aspinall was the powerful chair of the House Interior Committee and played a large role in blocking wilderness legislation through the 1960s. In 1970, he faced his first primary opposition in 22 years, and narrowly eked out a victory. In 1972, environmentalists were successful in defeating him. Environmentalists were similarly strategic in defeating Baring, who was the most conservative Democratic congressman outside the South and was dangerously climbing the congressional ladder to seniority in the House Interior Committee; in 1972, Baring was also defeated in the primary by environmental activists. 1970 is a particularly interesting year to examine, since it is the year of the most primary losses in a non-redistricting year. We suspect it is emblematic of the larger historical pattern in this period. Figure 3 plots the number of primary losses over time, without redistricting years. 21 From this graph, it is clear that the number of primary losses in a non-redistricting year never rises above 10. The number of losses, however, rises throughout the late 1960s and peaks in 1970, when 10 incumbents lose in primary elections. If we treat the relatively high number of losses in and around 1970 as an exogenous shock to the system where incumbents witness their colleagues losing in primaries because they did not appeal to organized interests, then we would expect the number of primary losses to decline after 1970 (see Aldrich 1995 for explication of a similar idea). Prior to 1970, primary losses accounted for approximately 26% of all incumbent losses in a given year. In 1970, primary losses accounted for a stunning 83% of all losses in that year. After 1970, primary losses accounted for less than 20% of incumbent losses each year.
20
(Insert Figure 3 about here.) It seems likely that candidates learned to respect the potential threat of primary losses by observing their colleagues in the early 1970s lose. Historical data on candidate positioning also indicates that members have increasingly distanced themselves from the district median over time. Descriptive data in Table 3 shows some of this. T-tests also indicate that members’ positions relative to the general electorate are statistically greater after 1970 than before 1970. This, coupled with our brief exploration of the qualitative data, supports the idea that candidates who do not appeal to an ideological base of organized voters are more likely to lose in the primaries, and that there is some evidence that the explosion of organized interests in the late 1960s prompted candidates to worry about the threat of a primary defeat.22 Together with our analysis of primary losses, this provides evidence consistent with the idea that primary elections can pull candidates to ideological extremes. Candidates who have not served many terms and are ideologically moderate are more likely to lose and our examination of historical data indicates that candidates may be adjusting their behavior in response to historical trends.
Conclusions This paper has established several key facts about primary elections. First, congressional candidates face a strategic positioning dilemma. Low turnout in primary elections creates the conditions necessary for a small group of ideologically extreme voters to have a greater impact. Our analysis shows that candidates who fare well in general elections often do poorly in primary elections. Democrats who are more liberal than their general election constituency do better in the primary election, and vice versa for Republicans who are more conservative than their general election constituency. In addition, ideologically moderate incumbents are more likely to
21
draw primary challengers, which greatly increases their vulnerability in primary elections. Our examination of challengers who defeat incumbents in primary elections also shows that these challenges tend to be ideologically more extreme than the incumbents, thus creating an important strategic dilemma for the candidates. Second, our analysis of patterns of primary losses provides support for the expectation that congressional candidates who face a strategic dilemma between primary and general election constituencies will work to build up a primary election constituency (Fenno 1978). We find that more ideologically moderate incumbents are more likely to lose, especially if they have not served many terms in the House. Finally, a look at over-time trends in primary losses intimates that candidates who observed the striking number of primary losses around 1970 were likely to “learn” from this observation and adjust their behavior accordingly—thus we see fewer losses after the early 1970s. The combination of these findings leads us to believe that a primary election effect in House primary elections is not only plausible, but quite likely. This substantiates some speculation that changing trends in primary elections may be a source of increased polarization in Congress over the past several decades. Our ability to make broader claims is limited by the lack of better measures of each district’s primary election constituency. Nonetheless, our data provides the best available estimates of the relationship between candidate ideology and primary elections over time. With better measures, however, we could perform better tests of the kinds of strategic choices candidates make under a variety of electoral circumstances. This suggests that future studies of congressional elections should also focus on primary constituencies. In sum, our findings on the relationship between candidate ideology and primary election outcomes offer the possibility of a fruitful research agenda in the future.
22
Endnote 1
Although some scholars (Geer 1988; Stone and Abramovitz 1983; Stone and Rapoport 1994) argue that the
ideological extremity of the primary electorate does not make a difference in candidate selection, they still find that the views of presidential primary voters are more extreme. Other work on primaries shows that presidential candidates react to this strategic dilemma by catering to the primary electorate (e.g Polsby and Wildavsky 2004). 2
It is worth noting that popular accounts of presidential campaigns often recognize presidential candidates trying to
move back towards the ideological middle ground after winning the party nomination. For reasons that we discuss later, moving back and forth between the two constituencies is probably more difficult for congressional candidates. 3
The general elections dataset is based on data collected by David W. Brady and used in multiple publications (e.g.
Canes-Wrone, Brady, and Cogan 2002; Brady 1988; Brady, Cooper, and Hurley 1979). That dataset was originally collected from America Votes, and checked against state electoral records (for more recent years) and other sources, such as the Almanac of American Politics, and Congressional Quarterly’s Guide to Elections. We then used a similar process to build the primary elections dataset. We began by collecting the data from America Votes, then checked the results against state electoral records (where available), and the same sources listed above. This iterative process of checking and cleaning the data gives us confidence that it is an accurate representation of electoral outcomes. 4
Although incumbents are defeated far less often in primary elections than in the general election, some may say
that congressional primaries are not very important affairs, merely a pro forma exercise required to win the nomination. But many rare events—such as presidential vetoes—produce important effects in politics. 5
Though this book is about presidential elections, there is no reason to believe that the argument does not apply
equally well to congressional elections. 6
This phenomena is also true within the party leadership. As far back as the 1890s, party leaders have been further
left and further right than the median voter (Cooper and Brady 1981). 7
Central to this literature are findings by Calvert (1985) and Alesina (1988), who demonstrate that even when
candidates have ideological preferences, policy divergence results only when where is uncertainty about voter preferences and/or a lack of constraint in policy choices once elected. See Grofman 2004 for a review of this work.
23
8
It is important to note that ideological positioning is one part of a larger process through which candidates seek
votes. A broad range of scholarly research examines other ways in which candidates generate votes (e.g. Canon 1999; Bianco 1994; Cain, Ferejohn, and Fiorina 1987; Mayhew 1974; Fenno 1978). All of this work, however, notes the importance and centrality of ideological positioning in the larger process of vote getting. 9
See Levendusky, Pope and Jackman (2004) for a more formal discussion of presidential-vote-in-the-district as a
measure of constituency preference. 10
Alternative polynomial specifications of the regression and additional control variables did little or nothing to
change the model. For a more extended discussion of this model and its application to polarization in Congress see Canes-Wrone, Brady, and Cogan (2002) and Han and Brady (Forthcoming). 11
We ran this regression and all the other regressions presented in this paper using adjusted ADA scores and DW-
Nominate. For simplicity, we only present the DW-Nominate results in the body of the paper. The results from the ADA regressions are completely consistent with the results found here and are available upon request. 12
“Contested” is defined as having at least one primary opposition candidate who received any votes and whose
name was on the ballot. 13
Any district that was redistricted at all was counted as being redistricted, regardless of the extent of
reapportionment. 14
We collected this data in each state for each year in our dataset by examining relevant legal codes. Though there
are some gaps in our data (where we were unable to conclusively determine the relevant law) we have close to 95% of the cases classified in the data. 15
This data was collected from the FEC archives and was obviously available only for recent elections (we were
able to collect 1980 – 1998). The FEC classifies this fundraising by date and for this model we have only included funds raised before the primary election. Although most models studying the effect of money on elections uses expenditures instead of revenue, we were not able to find historical data that indicated how much money was spent in a primary election, relative to a general election. 16
It is important to note that the dependent variable in Gerber and Morton’s study (1998) is candidate ideology. Our
dependent variable is vote margins and is therefore examining a different set of relationships. 17
This excludes cases in which there was redistricting or a scandal. In both of those cases, the incumbent is
rendered vulnerable not because of ideological positioning, but because of a change in the district composition or a
24
personal scandal. In other words, an exogenous event interrupts the expected pattern and changes the dynamics of the race. Even including redistricting and scandals, however, the challengers were more extreme than the incumbent almost 60% of the time. 18
Quoted in Roll Call, 9/14/2000 'Forbes Ousted In New York Primary" by Rachel von Dongen.
19
This is true for the first and third models presented in Table 4. The results in the second model (with both money
raised and the number of challengers) are not statistically significant, presumably because multicollinearity increases the uncertainty around our estimates (as discussed with respect to Table 1). 20
We should note that this is also consistent with our expectation that primary challenges tend to be ideologically
extreme. A number of these incumbents were beaten by challengers supported by ideologically extreme organized interests. 21
We should expect that redistricting produces more primary losses, since there are newly created districts win
which two incumbents must run against each other. If they were of the same party, then one must necessarily lose in the primary election. 22
Of course this is not a definitive explanation, since any number of other things can account for the change after
the 1970s. One alternative explanation is that new issues came up on the legislative agenda, such as women’s issues, environmentalism, and the Vietnam War. Examining the relationship between the rise of new issues and the mobilization of interest groups and their impact on primary elections is something we intend to pursue in further research. For now, however, it is clear that the primaries of the 1970s were distinctive—either in terms of the new issues they brought up or the increased use of interest group mobilization.
25
Table 1: Regressions of Incumbent Primary Vote Percentage on Candidate Ideology, 1956-1998
Basic Model with # of Challengers B Dem
Std. Error
B
Basic Model with Total Spending
Std. Error
(Constant)
90.31
(0.77) **
117.08
(2.80) **
114.79
(4.30) **
Incumbent Distance from General Election Constituency*
-0.96
(0.33) **
-1.07
(0.45) **
-2.98
(0.69) **
South
-4.21
(0.63) **
-2.91
(0.86) **
-4.24
(1.32) **
Redistricting
-3.96
(0.63) **
-6.25
(0.91) **
-12.70
(1.37) **
# House Terms Served
0.52
(0.06) **
0.35
(0.08) **
0.91
(0.12) **
Open Primary
0.67
(0.68)
-1.29
(0.89)
-3.44
(1.37) **
Closed Primary
-0.97
(0.31) **
-1.86
(0.44) **
-3.46
(0.68) **
Total # of Challengers
-11.58
(0.24) **
-12.56
(0.32) **
-2.00
(0.24) **
-3.34
(0.36) **
Total Amount of Money Raised (logged) Adjusted R-Squared N Rep
Basic Model with # of Challengers and Total Spending
0.556
0.668
2426
0.215
1119
1119
(Constant)
88.20
(1.23) **
102.41
Incumbent Distance from General Election Constituency*
1.62
(0.60) **
0.05
South
2.35
(1.37)
1.83
Redistricting
-4.08
(1.11) **
-6.18
(1.35) **
-15.49
(2.27) **
# House Terms Served
0.50
(0.12) **
0.46
(0.15) **
1.65
(0.24) **
Open Primary
-1.14
(1.11)
-2.27
(1.21)
-1.46
(2.07)
Closed Primary
-1.31
(0.52) **
-1.82
(0.59) **
-3.34
(1.01) **
Total # of Challengers
-12.26
(0.37) **
-13.99
(0.41) **
-0.61
(0.38)
-2.76
(0.64) **
Total Amount of Money Raised (logged)
(4.61) **
106.23
(7.87) **
(0.71)
2.92
(1.21) **
(1.33)
2.64
(2.27)
Adjusted R-Squared
0.518
0.722
0.188
N
1274
628
628
** Significant at p < .05 * Distance from the General Election Constituency is measured as the value of the residual of regressing DW-Nominate scores on presidential vote in the district.
26
Table 2: Regression of the Number of Primary Challengers on Candidate Ideology Dependent Variable: Total # of Challengers B Dem
(Constant)
(0.09) **
Incumbent Distance from General Election Constituency*
0.124
(0.02) **
South
-0.150
(0.03) **
Redistricting
0.164
(0.03) **
# House Terms Served
-0.028
(0.00) **
Incumbent Vote Share, Previous General Election
0.002
(0.00) **
Incumbent Vote Share, Previous Primary Election
-0.006
(0.00) **
Adjusted R-Squared N Rep
Std. Error
1.294
0.243 5225
(Constant)
0.838
(0.10) **
Incumbent Distance from General Election Constituency*
-0.041
(0.02) **
South
-0.253
(0.04) **
Redistricting
0.046
(0.04)
# House Terms Served
-0.054
(0.00) **
Incumbent Vote Share, Previous General Election
0.003
(0.00) **
Incumbent Vote Share, Previous Primary Election
-0.003
(0.00) **
Adjusted R-Squared
0.213
N
3726
** Significant at p < .05 * Distance from the General Election Constituency is measured as the value of the residual of regressing DW-Nominate scores on presidential vote in the district.
27
50s
Dem Rep
60s
Dem Rep
70s
Dem Rep
80s
Dem Rep
90s
Dem Rep
Win
465
71.5%
-0.42
0.5
6.1
58,208
Loss
8
54.3%
0.03
1.9
1.4
55,201 47,222
Win
409
64.2%
0.48
0.5
5.1
Loss
1
38.7%
0.37
1.0
1.0
74,227
Win
1299
70.4%
-0.47
0.6
6.3
54,756
Loss
26
51.8%
-0.34
1.8
2.6
74,526
Win
826
70.9%
0.72
0.3
5.0
49,131
Loss
9
52.5%
0.26
1.9
1.2
69,918
Win
1301
68.7%
-0.47
0.8
6.1
59,373
Loss
28
49.7%
-0.18
2.0
1.4
70,346
Win
849
67.3%
0.72
0.4
4.6
51,650
Loss
5
49.3%
0.54
1.8
1.4
99,052
Tot al $
rais ed
urn out ary T Prim
#T erm s
Ser ved
s alle nge r #o f Ch
Inc um b Vot ent P r eP erc imary ent age Inc . Di Gen stance era fro Con l Elec m tion stit uen cy*
Par ty Inc um Ele bent P ctio r n O imary u tc om e N
Inc um ben t
Dec ade
Table 3: Descriptive Statistics on Incumbent Primary Losses versus Primary Victories
Win
1301
75.7%
-0.55
0.6
5.8
58,102
Loss
14
51.0%
-0.14
2.5
1.6
82,931
$46,129 $89,502
Win
862
70.5%
0.82
0.3
4.7
48,794
$52,022
Loss
7
51.6%
0.60
1.4
1.1
81,388
$119,945 $132,614
Win
1159
82.6%
-0.64
0.6
5.9
63,645
Loss
16
55.2%
-0.23
2.3
1.6
95,663
$192,631
Win
967
83.3%
0.76
0.5
4.9
67,101
$151,117
Loss
8
52.8%
0.74
2.9
1.5
89,405
$753,754
* Distance from the General Election Constituency is measured as the value of the residual of regressing DW-Nominate scores on presidential vote in the district.
28
Table 4: Logit Regression of Primary Losses on Candidate Ideology, 1956-1998
Basic Model with # of Challengers B Dem
Std. Error
B
Std. Error
Basic Model with Total Spending B
Std. Error
(Constant)
-3.13
(0.40) **
-6.80
(2.11) **
-7.57
(2.14) **
Incumbent Distance from General Election Constituency*
0.30
(0.13) **
0.34
(0.24)
0.47
(0.22) **
South
0.09
(0.26)
-0.52
(0.50)
-0.61
(0.49)
Redistricting
1.00
(0.23) **
1.92
(0.42) **
1.94
(0.41) **
# House Terms Served
-0.64
(0.10) **
-0.50
(0.15) **
-0.66
(0.17) **
Open Primary
0.14
(0.33)
0.50
(0.60)
0.80
(0.59)
Closed Primary
0.27
(0.14)
0.28
(0.28)
0.32
(0.28)
Total # of Challengers
0.39
(0.08) **
0.38
(0.17) **
Total Amount of Money Raised (logged)
Rep
Basic Model with # of Challengers and Total Spending
0.46
(0.15) **
0.23
(0.17)
Adjusted R-Squared
0.28
0.347
0.316
N
5412
2131
2132
(Constant)
-3.02
(0.73) **
-4.34
(3.02)
-5.43
(3.14)
Incumbent Distance from General Election Constituency*
-0.29
(0.25)
-0.14
(0.38)
-0.29
(0.38)
South
-0.45
(0.63)
0.01
(0.69)
-0.10
(0.68)
Redistricting
0.85
(0.40) **
0.93
(0.61)
0.89
(0.60)
# House Terms Served
-1.10
(0.31) **
-0.91
(0.44) **
-1.32
(0.46) **
Open Primary
0.32
(0.52)
0.37
(0.80)
0.27
(0.78)
Closed Primary
0.01
(0.24)
0.22
(0.36)
0.21
(0.36)
Total # of Challengers
0.42
(0.13) **
0.28
(0.23)
Total Amount of Money Raised (logged)
0.51
(0.21) **
0.05
(0.24)
Adjusted R-Squared
0.264
0.283
0.244
N
3828
1568
1568
** Significant at p < .05 * Distance from the General Election Constituency is measured as the value of the residual of regressing DW-Nominate scores on presidential vote in the district. The dependent variable is coded as "1" for primary loss and "0" for victory.
29
Figure 1: Scatterplot of Candidate Ideology (DW-Nominate scores) and District Preference (Republican presidential vote in the district) in 1970
1.000
DW-Nominate
0.500
0.000
-0.500
-1.000
0%
20%
40%
60%
Republican Presidential Vote in District
80%
Figure 2: General election turnout is approximately three times the size of primary election turnout. 250000
General Election Turnout
Primary Election Turnout
200000
150000
100000
50000
0
1956
1960
1964
1968
1972
1976
1980
1984
1988
1992
1996
31
Figure 3: Number of Primary Losses per Year, 1956-1998 (without redistricting years) 10 9 8 7 6 5 4 3 2 1 0 1956
1958
1960
1966
1968
1970
1974
1976
1978
1980
1984
1986
1988
1990
1994
1996
1998
32
References Aldrich, John. 1983. A Downsian Spatial Model with Party Activism. American Political Science Review 77 (4):974-990. Aldrich, John. 1995. Why Parties? Chicago: University of Chicago Press. Alesina, Alberto. 1988. Credibility and Policy Convergence in a Two Party System with Rational Voters. American Economic Review 78:796-805. Ansolabehere, Stephen, James M. Jr. Snyder, and Charles Stewart III. 2000. Old Voters, New Voters, and the Personal Vote: Using Redistricting to Measure the Incumbency Advantage. American Journal of Political Science 44 (1):17-34. Ansolabehere, Stephen, James M. Jr. Snyder, and Charles Stewart III. 2001. Candidate Positioning in U.S. House Elections. American Journal of Political Science 45 (1):136159. Aranson, Peter, and Peter Ordeshook. 1972. Spatial Strategies for Sequential Elections. In Probability Models of Collective Decision Making, edited by R. Niemi and H. Weissberg. Columbus, OH: Charles E. Merrill. Barone, Michael, Grant Ujifusa, and Douglas Matthews. 1972. The Almanac of American Politics. Boston: Gambit Incorporated. Berry, Jeffrey M. 1984. The Interest Group Society. Boston: Little and Brown. Berry, Jeffrey M. 1989. The Interest Group Society. 2nd ed. Glenview, IL: Scott Foresman. Bianco, William. 1994. Trust: Representatives and Constituents. Ann Arbor: University of Michigan Press. Black, Earl, and Merle Black. 2002. The Rise of Southern Republicans. Cambridge, MA: Harvard University Press.
Brady, David W, Joseph Cooper, and Patricia Hurley. 1979. The Decline of Party in the U.S. House of Representatives, 1887-1968. Legislative Studies Quarterly 4 (3):381-407. Brady, David W, and Ed Schwartz. 1996. Abortion Politics in the U.S. Senate. Public Choice. Brady, David W. 1988. Critical Elections and Congressional Policy Making. Stanford: Stanford University Press. Burden, Barry C. 2001. The Polarizing Effects of Congressional Primaries. In Congressional Primaries and the Politics of Representation, edited by P. F. Galderisi, M. Ezra and M. Lyons. Lanham, MD: Rowman & Littlefield Publishers, Inc. Cain, Bruce E., John Ferejohn, and Morris P. Fiorina. 1987. The Personal Vote: Constituency Service and Electoral Independence. Cambridge: Harvard University Press. Calvert, Randall. 1985. Robustness of the Multidimensional Voting Model: Candidate Motivations, Uncertainty, and Convergence. American Journal of Political Science 29:69-95. Canes-Wrone, Brandice, David W. Brady, and John F. Cogan. 2002. Out of Step, Out of Office: Electoral Accountability and House Members' Voting. American Political Science Review 96 (1):127-140. Canon, David T. 1999. Race, Redistricting, and Representation: The Unintended Consequences of Black Majority Districts. Chicago: University of Chicago Press. Coleman, James S. 1971. Internal Processes Governing Party Positions in Elections. Public Choice 11 (Fall):35-60. Cooper, Joseph, and David W Brady. 1981. Institutional Context and Leadership Style: The House from Cannon to Rayburn. The American Political Science Review 75 (2):411-425. Downs, Anthony. 1957. An Economic Theory of Democracy. New York: Harper and Row.
34
Enelow, James, and Melvin Hinich. 1982. Ideology, Issues, and the Spatial Theory of Elections. American Political Science Review 76:493-501. Erikson, Robert S., and Gerald C. Wright. 1993. Voters, Candidates and Issues in Congressional Elections. In Congress Reconsidered, edited by L. Dodd and B. I. Oppenheimer. Washington DC: Congressional Quarterly Press. Erikson, Robert S., and Gerald C. Wright. 1997. Voters, Candidates, and Issues in Congressional Elections. In Congress Reconsidered, edited by L. Dodd and B. I. Oppenheimer. Washington DC: Congressional Quarterly Press. Erikson, Robert S., and Gerald C. Wright. 2005. Voters, Candidates, and Issues in Congressional Elections. In Congress Reconsidered, edited by L. Dodd and B. I. Oppenheimer. Washington DC: CQ Press. Fenno, Richard. 1978. Home style: House members in their districts. Boston: Little, Brown, and Co. Fiorina, Morris P. 1974. Representatives, Roll Calls, and Constituencies. Lexington, MA: D.C. Heath. Fiorina, Morris P. 1999. Whatever Happened to the Median Voter? Paper read at MIT Conference on Parties and Congress, October 2, 1999, at Cambridge, MA. Francis, Wayne L., Lawrence W. Kenny, Rebecca B. Morton, and Amy B. Schmidt. 1994. Retrospective Voting and Political Mobility. American Journal of Political Science 38 (4):999-1024. Galderisi, Peter F., Marni Ezra, and Michael Lyons. 2001. Congressional Primaries and the Politics of Representation. Lanham, MD: Rowman & Littlefield Publishers, Inc.
35
Geer, John. 1988. Assessing the Representativeness of Electorates in Presidential Primaries. American Journal of Political Science 32 (4):929-945. Gerber, Elizabeth, and Rebecca B. Morton. 1998. Primary Election Systems and Representation. Journal of Law, Economics and Organization 14 (2):304-324. Grofman, Bernard. 2004. Downs and Two-party Convergence. Annual Review of Political Science 7:25-46. Hacker, Jacob S., and Paul Pierson. 2005. Abandoning the Middle: The Bush Tax Cuts and the Limits of Democratic Control. Perspectives on Politics 3 (1):33-53. Han, Hahrie, and David W. Brady. Forthcoming. An Extended Historical View of Congressional Party Polarization. British Journal of Political Science. Jacobson, Gary C. 2001. The Politics of Congressional Elections. 5th ed. New York: Longman. Key, V. O. 1956. Politics, Parties, and Pressure Groups. 3rd. ed. New York: Thomas Crowell Co. Key, V. O. 1964. Public Opinion and American Democracy. New York: Alfred A. Knopf. McCarty, Nolan, Keith Poole, and Howard Rosenthal. 2006. Polarized America: The Dance of Political Ideology and Unequal Riches. Cambridge, MA: MIT Press. McClosky, Herbert, Paul J. Hoffman, and Rosemary O'Hara. 1960. Issue Conflict and Consensus Among Party Leaders and Followers. The American Political Science Review 54 (2):406427. Norrander, Barbara. 1989. Ideological Representativeness of Presidential Primary Voters. American Journal of Political Science 33:570-587.
36
Owen, Guillermo, and Bernard Grofman. 2004. Two-Stage Electoral Competition in Two-Party Contests: Persistent Divergence of Party Positions. Paper read at Annual Meeting of the Public Choice Society, March 24-26, 1995, at Long Beach, CA. Polsby, Nelson, and Aaron Wildavsky. 1978. Presidential Elections. New York: Charles Scribner and Sons. Polsby, Nelson, and Aaron Wildavsky. 2004. Presidential Elections: Strategies and Structures of American Politics. New York: Rowman and Littlefield. Poole, Keith, and Howard Rosenthal. 1991. Patterns of Congressional Voting. American Journal of Political Science 25:49-67. Schlesinger, Joseph A. 1991. Political Parties and the Winning of Office. Chicago: University of Chicago Press. Schlozman, Kay Lehman, and John C. Tierney. 1986. Organized Interests and American Democracy: Harper and Row. Schmidt, Amy B., Lawrence W. Kenny, and Rebecca B. Morton. 1996. Evidence on Electoral Accountability in the U.S. Senate: Are Unfaithful Agents Really Punished? Economic Inquiry 34:545-567. Shapiro, Catherine R., David W Brady, Richard Brody, and John Ferejohn. 1990. Linking Constituency Opinion and Senate Voting Scores: A Hybrid Explanation. Legislative Studies Quarterly 15 (4):599-621. Snyder, James M. Jr. 1994. Safe Seats, Marginal Seats, and Party Platforms: The Logic of Platform Differentiation. Economics and Politics 6:201-214.
37
Soule, J.W., and W.E. McGrath. 1975. A Comparative Study of Presidential Nomination Conventions: The Democrats of 1968 and 1972. American Journal of Political Science 19:501-517. Stone, Walter J., and Alan I. Abramovitz. 1983. Winning May Not Be Everything, But It's More than We Thought: Presidential Party Activists in 1980. The American Political Science Review 77 (4):945-956. Stone, Walter J., and Ronald B. Rapoport. 1994. Candidate Perception among Nomination Activists: A New Look at the Moderation Hypothesis. The Journal of Politics 56 (4):1034-1052. Wittman, Donald A. 1977. Candidates with Policy Preferences: A Dynamic Model. Journal of Economic Theory 14:180-189.
38
Author Information (* Corresponding Authors marked with asterisk)
David W. Brady Bowen H. and Janice Arthur McCoy Professor of Political Science and Leadership Values, Stanford Graduate School of Business Ph.D. University of Iowa Areas of Interest: political history of the U.S. Congress, U.S. elections, public policy processes Phone: 650-723-9702 Email:
[email protected] Hahrie Han* Knafel Assistant Professor of the Social Sciences Department of Political Science, Wellesley College Ph.D., Stanford University Areas of interest: political polarization, primary elections, political participation Phone: 781-283-2140 Email:
[email protected] Jeremy C. Pope* Assistant Professor Department of Political Science, Brigham Young University Ph.D., Stanford University Areas of interest: elections and electoral behavior, legislative processes and policy-making, methodology Phone: (801) 422-1344 Email:
[email protected]
39