LETTERS
The extracellular matrix guides the orientation of the cell division axis Manuel Théry1, Victor Racine2, Anne Pépin3, Matthieu Piel1, Yong Chen3, Jean-Baptiste Sibarita2 and Michel Bornens1,4 The cell division axis determines the future positions of daughter cells and is therefore critical for cell fate. The positioning of the division axis has been mostly studied in systems such as embryos or yeasts, in which cell shape is well defined1,2. In these cases, cell shape anisotropy and cell polarity affect spindle orientation3–5. It remains unclear whether cell geometry or cortical cues are determinants for spindle orientation in mammalian cultured cells6,7. The cell environment is composed of an extracellular matrix (ECM), which is connected to the intracellular actin cytoskeleton via transmembrane proteins8. We used micro-contact printing to control the spatial distribution of the ECM on the substrate9 and demonstrated that it has a role in determining the orientation of the division axis of HeLa cells. On the basis of our analysis of the average distributions of actin-binding proteins in interphase and mitosis, we propose that the ECM controls the location of actin dynamics at the membrane, and thus the segregation of cortical components in interphase. This segregation is further maintained on the cortex of mitotic cells and used for spindle orientation. Differentiating between the influence of cell shape geometry and of cortical cues associated with cell polarity is a recurrent problem in understanding how the spindle is orientated during cell division3–5. In mammalian cultured cells, both factors have been shown to impinge on spindle orientation. O’Connel and Wang performed micromanipulation experiments on NRK cells during mitosis to show that the spindle orients along the long cell axis. They proposed a mechanism by which spindle orientation was driven solely by the anisotropy of cell geometry6. However, in MDCK cells that form an epithelium-like structure — in which mitotic spindles lie in the plane of the epithelium, perpendicular to the long cell axis — Reinsch and Karsenti have concluded that either differences in cortical stiffness or the presence of some cortical sites drive spindle positioning7. We investigated the influence of cell geometry and cortical cues in individual HeLa cells. These cells completely round up during mitosis, enabling us to distinguish geometry from cortical cues. Cell shape and
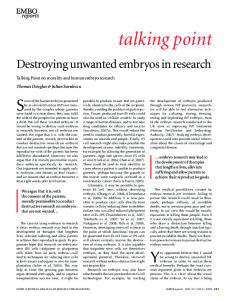
cortical heterogeneity were reproducibly manipulated through microprinting ECM patterns, onto which individual cells adhered. The micro-contact printing technique was adapted in order to print fibronectin — a major component of the ECM that interacts with integrins8 — on glass coverslips and follow cell behaviour with phasecontrast and epifluorescence video microscopy. HeLa cells were synchronized in G2 with a double-thymidine block, and plated on an array of fibronectin micro-patterns. Cell divisions on this array were recorded using automated multi-position time-lapse acquisitions in phase contrast. To analyse these data, we developed an automated numerical tool to detect each micro-pattern in the recorded field and the presence of a single cell attached to it. The position of the round mitotic cell centre and the spindle orientation, as judged by the orientation of the cell elongation at anaphase onset, were automatically detected and recorded (see Supplementary Information, Fig. S1). We first investigated the role of cell shape by using micro-patterns to experimentally control the cell shape factor (SF), defined as the ratio between the minor and the major axis of an ellipse fitting the cell outline. Cells were plated on rectangular (SF = 0.3), right-angled isosceles triangular (SF = 0.6) and discoid (SF = 1) adhesive micro-patterns. The vast majority of cells grown on rectangular micro-patterns had mitotic spindles aligned along the longest axis (65% in a 30 °-wide sector; Fig. 1a). The mitotic spindle orientation of cells plated on discs showed a random distribution (Fig. 1b). With cells grown on triangular micro-patterns, mitotic spindles were mainly orientated parallel to the hypotenuse, although the distribution was broader than on the rectangular patterns (42% in a 30 °wide sector; Fig. 1c). This confirms that the elongation of the cell before mitosis influences the angular distribution of the division axis. The variability allowed by the adhesive boundary conditions imposed by triangular micro-patterns can be reduced by limiting the adhesive area to an [L] shape. In such a situation, cells had the same cell shape as they did on a [triangle]. Strikingly, the orientation of the cell division axis was much more constrained. Indeed, the distribution of the orientation of the division axis around the hypotenuse was as sharp as was found on rectangles (65% in a 30 °-wide sector; Fig. 1d and see Supplementary Information, Movie S1, for a series of time-lapse recordings on the four micro-patterns).
1
Biologie du cycle cellulaire et de la motilité, 2Centre d’imagerie, UMR144, CNRS, Institut Curie, 26 rue d’Ulm 75248 Paris Cedex 05, France. 3Groupe nanotechnologie et dispositifs microfluidiques, UPR20, CNRS, Laboratoire Photonique et Nanostructures, Route de Nozay, 91460 Marcoussis, France. 4 Correspondence should be addressed to M.B. (e-mail:
[email protected]) Received 29 June 2005; accepted 30 August 2005; published online: 18 September 2005; DOI: 10.1038/ncb1307
NATURE CELL BIOLOGY VOLUME 7 | NUMBER 10 | OCTOBER 2005 ©2005 Nature Publishing Group
947
LETTERS a
c 65% 120 90º
120
30
60 180º
30
30% 20% 10%
330 240
330 270º
0º
30% 20%10%
210
0º
210 240
60
150
150 180º
90º
270º
300
42%
n = 430
300
d n = 147 [L] ≠ [triangle]
b
90º
120
60
150
30 120
180º
20%
0º
10%
270º
90º
60
150
330
210 240
**
30
180º 30% 20%
0º
10%
300 210
330 240
n = 316
270º
300
65%
n = 255
Figure 1 The interphase cell shape is not the only parameter that determines the division axis. (a–d) Large pictures show an interphase cell constrained on different micro-patterns (drawn in grey on the right). Small pictures were extracted from the time-lapse acquisitions used to measure the orientation of cell division (blue line). Circular graphs, superimposed on micro-pattern drawings, show the angular distribution of spindle orientations that were automatically
measured as described in the text and in Supplementary Information, Fig. S1, and counted in 10 °-wide sectors for cells plated on [rectangles] (a), [discs] (b), [triangles] (c) and [L] (d). The size (outer circle) and position of the graphs correspond to the actual size and average position of mitotic cells with respect to the corresponding micro-pattern. The distributions of spindle orientation were significantly different on [triangles] and on [L]. Scale bars represent 10 µm.
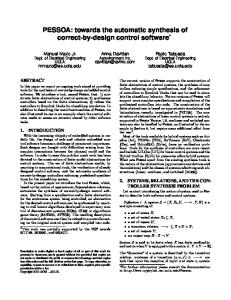
This difference shows that the interphase cell shape is not the only parameter that determines the division axis. The contribution of cell shape to spindle orientation was further analysed. Most cells in culture undergo large morphologic changes during cell rounding in mitosis. The influence of cell shape should be revealed by whether there is a correlation between cell elongation and spindle orientation over time. The HeLa cells we used stably expressed centrin1–GFP10. This allowed the monitoring of spindle formation in living cells. We performed z-acquisitions of centrin1–GFP in a multi-position time-lapse acquisition on cells plated on micro-patterns (Fig. 2a and see Supplementary Information, Movie S2). Cell rounding and spindle formation were reproducibly coordinated on micro-patterns. Centrosomes separated precisely when cells started to round up and the spindle reached its final length 5–10 min after nuclear envelope breakdown (NEB) (as judged by the disappearance of the nuclear exclusion of centrin1–GFP) and 10–15 min before the end of cell rounding (Fig. 2b). Interestingly, we observed the expected spindle orientation along the hypotenuse after the NEB, but the distribution was rather broad on [L], in spite of the pronounced cell elongation at this stage (Fig. 2c). This distribution became sharper 15–30 min later when cells had rounded up, and these orientations were maintained up to anaphase. The post-NEB reorientation of the spindles in [L] and [rectangles] was more pronounced than on [discs] (see Supplementary Information, Fig. S2). Although this post-NEB fine tuning of orientation occurred during the late stages of cell rounding when the elongated form of the cell was clearly reduced, it could still be due to this residual cell shape anisotropy.
Alternatively, cell cortex heterogeneity could regulate this fine tuning of spindle orientation. To test this hypothesis, mitotic spindles were forced to form in a completely round cell. Centrosome separation was inhibited during cell rounding by treating synchronized G2 cells with 100 nM nocodazole over 1 h. This treatment blocked cells in mitosis with unseparated centrosomes but did not prevent cell rounding (Fig. 2d). Immediately after nocodazole washout, centrosomes separated and formed a bipolar spindle. Even though much broader than for the non-treated cells — perhaps due to the necessarily brief and possibly incomplete nocodazole washout — the distribution of spindle orientations was not random but still preferentially orientated parallel to the hypotenuse of the triangle (Fig. 2d, e and see Supplementary Information, Movie S3). This small preference was significant and the absence of cell geometrical bias indicated that spindles were sensitive to some cortical signal. Therefore we conclude that spindle orientation is not solely driven by cell shape. How the cortex may influence spindle orientation was then further investigated. The cortex has been viewed as a heterogeneous actin network that regulates the stability of astral microtubules locally5. The role of these cytoskeleton components is well established in yeast and embryos1,11, whereas in individual cultured cells it has not been properly defined because spindle orientation has not been predictable. We used the ability of [L] to impose a well defined division axis to investigate the heterogeneity of the cell cortex and the role of actin and astral microtubules in spindle orientation. Micro-pattern angles have been shown to induce local membrane ruffling12. The confinement of membrane-associated actin polymerization
948
NATURE CELL BIOLOGY VOLUME 7 | NUMBER 10 | OCTOBER 2005 ©2005 Nature Publishing Group
LETTERS a
0 min
10 min
15 min
25 min
35 min
45 min
NEB
b
c NEB
1.0 0.8
Projected cell area
0.6
Projected distance inter-centrosomes
0.4 0.2 0
− 40 − 30 − 20 −10
1 0
10
20
30
9 8 7 6 5 4 3 2 1 2 3 40 50 0
1 Post-NEB Distance (µm)
Normalized area
1.2
2 Round cell
3 Pre-anaphase
n = 15
Time (min)
d
e
NZ, 100 nM
NZ, 100 nM n = 349
Washout
+ 25 min
NZ washout
+ 1 h 50 min
+2h
120
90º
60
150
Pre-anaphase
180º
30 0º
20% 10%
330
210 240
n = 13
270º
300
Figure 2 Cell rounding and spindle orientation. (a) Time-lapse sequence of spindle formation on [L]. Centrosomes (white asterisks) were visualized using z-acquisition and projection of centrin1–GFP. Note the late reorientation of the spindle after the NEB. (b) Temporal correlation between spindle assembly and cell rounding. Projected cell area (continuous blue line) and inter-centrosome projected distance (dashed red line) are plotted versus time for cells plated on [L] (n = 15). Cell area is normalized with respect to the initial area. Error bars represent the standard deviation. Time 0 corresponds to the beginning of cell rounding. Numbered arrows indicate the time at which the distribution of spindle orientation is shown in c. (c) Progressive modification of cell shapes and the distributions of spindle orientation on [L]. Spindle orientations were measured 5 min after NEB (left; arrow 1 in b), at the end of cell rounding (middle; arrow 2) and
before anaphase (right; arrow 3). (d) Spindle assembly in round cells after complete disruption of microtubules. Cells divided on [L] after a 100 nM nocodazole mitotic arrest and a brief washout. Pictures at the top are extracted from a time-lapse z-acquisition of centrin1–GFP after nocodazole (NZ) washout (as in Supplementary Information, Movie S5). Arrowheads point to centrosomes. Below, distributions of spindle pole positioning (n = 13) are shown just before nocodazole washout (left) and before anaphase (right). After washout, spindle poles aligned parallel to the [L] hypotenuse in spite of the spherical geometry of the cell body. (e) Distribution of spindle orientation after nocodazole washout, measured as described in the text and in Supplementary Information, Fig. S1. It confirms the preferential orientation of anaphase elongation along the hypotenuse over 349 cells. Scale bars represent 10 µm.
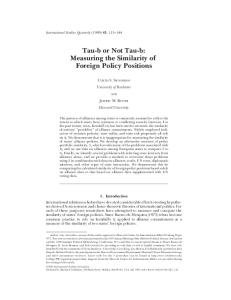
at these particular locations could thereby induce a cortical segregation of proteins in interphase, which might be maintained up to mitosis. We noted, for example, that these regions contain a subset of actin-binding proteins. Cortactin and ezrin were chosen as two markers of this actin activity. Cortactin is involved in actin polymerization in membrane ruffles13, and the activated form of ezrin is an early determinant of cell polarity14, which links the plasma membrane with cortical actin15,16. G2 cells were plated on [L] and fixed at various stages before and during spindle formation. As expected, cortactin and ezrin were preferentially located in membrane ruffles (Fig. 3a). Interestingly, cortactin and ezrin were found to accumulate in the retraction fibres that formed when cells rounded up17 (Fig. 3a). Cortactin was present in the retraction fibres and on the mitotic cell cortex. Ezrin was enriched in the more proximal part of the retraction fibres with respect to the cell body. The average location of
ezrin was distributed in a crescent on the cell cortex. Ezrin and cortactin were almost absent from the part of the cortex facing the non-adhesive area. These results demonstrate that the cortex is heterogeneous. This heterogeneity is established in interphase and maintained in mitosis. This was also observed in the nocodazole-treated cells (described above), where the orientation of spindles, assembled in a round cell, was not random (see Supplementary Information, Fig. S3). Actin was fully depolymerized by treating the cells on [L] with 0.1 µM latrunculin. Because the cells did not elongate upon anaphase onset, mitotic spindle orientation was measured manually on phase-contrast images in which metaphase plates were easily visible (data not shown). Mitotic spindles were almost randomly oriented with latrunculin treatment (Fig. 3b). Therefore membrane-associated filamentous actin is necessary to guide spindle orientation.
NATURE CELL BIOLOGY VOLUME 7 | NUMBER 10 | OCTOBER 2005 ©2005 Nature Publishing Group
949
LETTERS Cortactin
Ezrin
Cortactin
Ezrin
Average cortactin
Average ezrin
n = 36
n = 36
n = 18
n = 18
Mitosis
Interphase
a
b Control
Actin
Fibronectin Centrin DNA
Latrunculin
Actin
Fibronectin Centrin DNA
Latrunculin, 1 µM, n = 132 [L] + latrunculin ≠ [L]
**
120
90º
60 30
150 180º 20% 10%
0º 330
210 240
270º
300
c Control
NZ, 5 nM, n = 576
NZ, 5 nM
[L] + NZ 5nM ≠ [L] 120
90º 60 30
150 180º
**
0º
20% 10%
330
210 240
300
Figure 3 Distributions of actin-binding proteins and the role of actin and astral microtubules for spindle positioning on [L]. (a) Cortactin and activated ezrin distributions in G2 cells (top) and mitosis (bottom). On the left, individual cells fixed and immunolabelled for cortactin and activated ezrin are shown. On the right, the average distribution from several cells is shown. Note the accumulation of both proteins at cell apices in interphase and their specific accumulations in retraction fibres in mitosis. The average cortical distributions in mitosis formed a crescent. (b) Actin disruption affected spindle orientation. Cells were labelled with phalloidin–FITC in control conditions (left) and in the presence of 0.1 µM latrunculin A (right). Upon treatment, most retraction
fibres were disrupted and spindles were misorientated. The graph shows spindle pole orientation, measured by hand on phase-contrast pictures, as the direction perpendicular to the metaphase plate. (c) Disruption of astral microtubules perturbed spindle positioning. Pre-mitotic cells were treated with 5 nM nocodazole. Pictures show spindles in control (left) and treated cells (right). Note the absence of astral microtubules in treated cells. The graph shows the distribution of spindle orientation, measured as described in the text and in Supplementary Information, Fig. S1. In both cases (b, c) the distributions were significantly broader than in control cells (see Methods for the description of statistical analysis). Scale bars represent 10 µm.
Most astral microtubules were prevented from reaching the cell cortex by treating cells with 5 nM of nocodazole. At this low concentration the assembly of a bipolar spindle was not disrupted. Cells plated on [L] entered anaphase as in control conditions but the nocodazole treatment significantly broadened the angular distribution of the division axis (Fig. 3c), indicating that astral microtubules interacting with the cell cortex do indeed participate in spindle orientation. Altogether these results show that the round mitotic cell cortex is not homogeneous and contains cortical cues that modulate spindle orientation. These cues are associated with retraction fibres and originate from the cortical heterogeneity of the pre-mitotic cell. We further investigated whether the cortical heterogeneity affected spindle orientation. To reduce membrane-associated actin dynamics18 and hopefully disrupt the heterogeneity of the cell cortex, we inhibited
Src family tyrosine kinases with 10 µM of PP2 (ref. 19) (Fig. 4) or 5 µM of SU6656 (ref. 20) (see Supplementary Information, Fig. S3). The efficacy of these treatments was confirmed by observing the disappearance of cortactin and ezrin segregation at the cell apices in interphase. The effect of Src tyrosine kinase inhibition on promoting randomization of ezrin and cortactin distribution on the cell cortex was quantified during interphase and mitosis (compare Fig. 4a with Fig. 3a). A strong inhibition of membrane ruffling was also observed during the time-lapse acquisitions performed to measure cell division orientations. During mitosis, the retraction fibres were still present with Src tyrosine kinase inhibition but lacked most of the ezrin that was located at their attachment to the round cell body. Cells were blocked for a long time in metaphase. Some of the spindles were seen to erratically rotate within the round cells (see Supplementary Information,
950
NATURE CELL BIOLOGY VOLUME 7 | NUMBER 10 | OCTOBER 2005 ©2005 Nature Publishing Group
LETTERS Cortactin
Average cortactin
Ezrin
Average ezrin
n = 15
n = 15
n = 22
n = 22
PP2 Mitosis
PP2 Interphase
a
Mitosis
Cortactin Ezrin DNA
b PP2, n = 362
120
90º 120
60 30
150 180º
0º
30% 20% 10%
330
210 240
PP3, n = 353 [L] + PP2 ≠ [L] + PP3
270º
300
**
90º 60
150
30
180º 30%
0º
20% 10%
330
210 240 270º
300
Figure 4 The absence of cortical heterogeneity leads to spindle mispositioning. (a) Cells were treated with 10 µM of PP2. The cortical distributions of cortactin and ezrin were homogeneous in interphase (top) and mitosis (bottom). Note that cell staining was reduced in comparison
with the control cell (Fig. 3, same intensity scale). (b) Distribution of spindle orientations, measured as described in the text and in Supplementary Information, Fig. S1, were strongly impaired in the presence of PP2 but not with PP3, an inactive form of PP2. Scale bars represent 10 µm.
Movie S4). Eventually the orientation of cell elongation upon anaphase was strongly impaired (Fig. 4b and see Supplementary Information, Movie S5). Half of the cells showed a defect during the contraction of the actin furrow, leading to cells becoming binucleated. All these effects were not detected after treatment with 10 µM of PP3, a modified and inactive form of PP2. By promoting an apparent homogeneous cortex, Src inhibition supported the hypothesis that cortical marks guide and stabilize spindle orientation. Furthermore, these results also show that retraction fibres are structural components that position these cortical marks but are not sufficient by themselves to guide spindle orientation. The cues associated with the ezrin cortical patches seemed necessary for the correct positioning of the spindle. Our results also suggested that the spatial distribution of the ECM affects their location in interphase, and thereby spindle orientation in mitosis. Indeed, the ECM directly controls actin polymerization in membrane ruffles via the associated focal adhesions21,22. We therefore questioned whether the distribution of the ECM and hence the cortical heterogeneity could override the effect of cell geometry. We designed a new set of micro-patterns based upon a square template and composed of [cross], [L-dot] and [twin bars]. The cells grown on these patterns had similar square shapes in interphase, but distinct spatial distributions of actin-dependent membrane ruffles. These ruffles were preferentially distributed where the cell membrane attached to fibronectin (Fig. 5a) as judged by the location of focal adhesions (data not shown). These differences
in the distribution of membrane ruffles led to specific distributions of cortical marks during mitosis. Invariably, the cortactin or ezrin-rich domains, in which membrane ruffles were located, were geometrically projected as patches on the mitotic cell cortex through the retraction fibres (Fig. 5b). When the cells were plated on [cross], the ruffles were observed at the four cell apices. During mitosis, four ezrin clusters were observed on the cell body, in two pairs of opposing sites facing the tips of the cross. As expected, the spindle orientated on either one or the other of these axes (Fig. 5c), and because the two pairs of opposed patches of ezrin were equivalent, both corresponded to the longest cell axis of the cell in interphase. On [L-dot], unlike [cross], the two diagonals were no longer equivalent: ezrin clusters on the mitotic cell cortex consisted of a large angular sector forming a crescent, as on [L] (see Fig. 3), and a patch facing the dot (Fig. 5b). In this case, the spindle orientation was biased towards the diagonal connecting the ends of the L in the [L-dot] (Fig. 5c). This demonstrated that the spatial distribution of the ECM can impinge on mitotic cell cortical marks and spindle orientation. The [twin bars] induced the formation of two wide membrane ruffling regions on the bars during interphase, contrasting with the four distinct regions observed on [cross]. During mitosis, retraction fibres had a general orientation toward the bars. The spindle poles aligned perpendicular to the bars rather than along the diagonals (Fig. 5c and see Supplementary Information, Movie S6, for series of time-lapse recordings on the three micro-patterns). This orientation at 45 ° from the long cell axis in interphase confirmed the
NATURE CELL BIOLOGY VOLUME 7 | NUMBER 10 | OCTOBER 2005 ©2005 Nature Publishing Group
951
LETTERS a
b
Metaphase
Fibronectin
Cortactin Ezrin
Cortactin
Average ezrin
Interphase
Average cortactin
n=4
n=7
n = 14
n=6
n=4
n = 19
c 120
90º
60 120
30
150 180º
5% 10% 15%
210
0º
330 240
270º
90º
120 60
150
30
180º
5% 10% 15%
240
270º
60 30
180º 0º
330
210
300
90º
150 10%
210
20%
0º
330 240
270º
300
300
n = 387
n = 186
n = 185
Figure 5 The spatial distribution of ECM governs cortical heterogeneity and the orientation of the spindle. (a) Membrane ruffles in interphase, as decorated by cortactin, are located upon the adhesive cell periphery. Cells were plated on [cross] (left column), [L-dot] (middle column) and [twin bars] (right column). Bottom row shows the average staining of cortactin. (b) The location of ezrin cortical patches at the point of retraction fibre attachment on the mitotic cell cortex corresponds to the radial projection of membrane ruffles in interphase. Cells were fixed in mitosis, and stained for cortactin and ezrin. Projections of z-acquisitions are shown. Note the local enrichment
of cortactin in the lower part of the retraction fibres and of activated ezrin in the upper part, which form patches on the round cell body. The bottom row shows the average projected staining of ezrin. White circles show the average cell periphery in the middle of the z-acquisitions; retraction fibres contact the cortex below this section. (c) Distributions measured as described in the text and in Supplementary Information, Fig. S1, show a preferential spindle orientation along the two diagonals on [cross] (left), along one diagonal on [L-dot] (middle) and along one side of the square envelope on [twin bars] (right). Scale bars represent 10 µm.
dominance of the spatial distribution of the ECM over the geometrical shape of the interphase cell. In conclusion, the determination of spindle orientation in cultured cells is largely dependent on the spatial distribution of the ECM. Spindle orientation may be influenced by the cell shape anisotropy during cell rounding, but its final orientation is defined by the cortical marks that become associated with the retraction fibres. These cortical marks reflect the segregation of cortical proteins in the ruffles in interphase. Therefore our observations suggest a model in which the actin cytoskeleton associated with the membrane ruffles in interphase predetermines spindle orientation (see Supplementary Information, Fig. S4). Elsewhere it has been found that membrane ruffles contain proteins that stabilize microtubules such as APC23 and motors that pull on microtubules such as dyneins24,25. The corresponding sectors of the mitotic cell cortex could thus contain these proteins and selectively attract the spindle poles through astral microtubules26. Cell–cell contacts also influence cortical heterogeneity and thereby spindle orientation27,28 and such micro-patterning techniques should prove useful to identify what mechanistic similarities and differences exist between cell–cell contacts and cell–ECM adhesion signalling.
The approach we have developed allows quantitative studies of spindle orientation in cultured cells. Other cell types divide reproducibly on [L] micro-patterns such as RPE1, a human infinity telomerase-immortalized cell line that keeps most of the features of primary cells; and L929 cells, a murine transformed cell line (see Supplementary Information, Fig. S1). The reproducibility of cell behaviour in our device also allows us to accurately quantify the spatial distribution of proteins by defining the ‘average cell’ for a specific condition. Our methodology therefore should have a wide range of applications from the fundamental analysis of internal cell organization to the detection of abnormalities in mutated cells and the analysis of the effect of biochemical drugs on individual cells in high-throughput screens.
952
METHODS Micro-pattern fabrication. Micro-contact printing has been described in full previously9. We made the poly-dimethyl siloxane stamps (Sylgard kit; Dow Corning, Saint Laurent du Pont, France) using a previously described method29. The glass coverslip treatment we used was developed by P. Nassoy30. A stamp was inked with a 50 µg ml−1 fibronectin solution (Sigma-Aldrich, Saint Quentin Fallavier, France), 10% of which was labelled with Cy3 (Amersham Biosciences, Orsay, France) or AlexaFluor350 (Molecular Probes, Leiden, Netherlands) for 5 min,
NATURE CELL BIOLOGY VOLUME 7 | NUMBER 10 | OCTOBER 2005 ©2005 Nature Publishing Group
LETTERS dried, and placed in contact with a glass coverslip that had been previously coated with mercapto-propyulrimethoxy-silane (SIM6476; Roth Sochiel, Lauterbourg, France) for 5 min. After removal of the stamp, the printed coverslip was immersed in PBS containing 20 mg ml−1 maleimide-poly(ethyleneglycol) (2D2MOH01; Nektar Therapeutics, Huntsville, AL) for 1 h at room temperature. The coverslip was then washed in PBS before cell deposition. Cell culture and deposition. HeLa-B (human adenocarcinoma epithelial cell line) stably expressing centrin1–GFP10 and L929, a murine fibro sarcoma L-cell strain, were cultured in DME medium with 10% fetal calf serum and 2 mM glutamine at 37 °C. hTERT-RPE1, infinity telomerase-immortalized retinal pigment epithelial human cell line, was cultured in DMEM F-12. HeLa and L929 cells were synchronized at the G1/S transition using a double-thymidine block and then removed from their flask using VERSEN for 10 min at 37 °C. After centrifugation, cells were resuspended in DMEM with 1% FCS and deposited on the printed coverslip at a density of 104 cells per cm2. Inhibitor treatments. Nocodazole was used at 5 and 100 nM, cytochalasin D at 1 µg ml−1 (Sigma-Aldrich), latrunculin A at 0.5 µM (Invitrogen Life Technologies, Cergy Pontoise, France), PP2 and PP3 at 10 µM, SU6656 at 5 µM (Calbiochem, La Jolla, CA). Inhibitors were added 2 h after cell spreading on micro-patterns and about 1 h before entry into mitosis. Fixations and staining. Interphase cells were fixed in 3% paraformaldehyde, 0.25% glutaraldehyde and 1% Triton X-100 in cytoskeleton buffer17 for 15 min and treated with 0.1 M ammonium chloride for 10 min. Cells treated with 5 nM of nocodazole were fixed in methanol at –20 °C for 5 min. Round cells in metaphase were fixed using a method described by T. Mitchison17, which preserves retraction fibres. Actin and DNA were stained using 1 µM phalloidin–FITC (Sigma-Aldrich) and DAPI. Cortactin was immunolabelled with primary mouse antibodies (1:200; Transduction Labs, Lexington, KY) and secondary Cy5-conjugated goat anti-mouse antibodies (1:1,000; Jackson Immunoresearch, West Grove, PA). Phosphorylated ezrin on Thr 567 was immunolabelled with primary rabbit antibodies provided by M. Arpin15 and secondary Cy3-conjugated goat anti-rabbit antibodies (1:2,000; Jackson Immunoresearch). Video microscopy. We used an inverted Leica DMIRBE microscope (Leica Microsystèmes, Reuil Malmaison, France) with a heated and motorized stage combined with a home-made plastic cell chamber to hold the printed glass coverslip, which was covered by a porous membrane allowing CO2 buffering at pH 7.4. Metamorph software (Universal Imaging, Downingtown, PA) was used for image acquisition. Hundreds of divisions were recorded in a few hours using time-lapse phase-contrast microscopy on a multi-field acquisition at a frame rate of one picture every 3 min with a ×10 magnitude objective. Centrosome movements were followed during mitosis with a ×63 apochromat objective lens (Leica Microsystèmes) using fluorescent z-acquisitions through a green filter and a phase-contrast picture of the cell bottom every 5 min. Video analysis and processing. We developed a software that was able to automatically recognize a single fluorescent micro-pattern within a field and detect the presence of a single cell attached to it. Individual cell divisions were then extracted from the ×10 phase-contrast time-lapse recordings and every picture was automatically segmented using a wavelet decomposition (V.R., Salamero, J. & J.B.S., unpublished work) and fitted with an ellipse. The moment of cell elongation in anaphase was precisely detected, because the shape factor — defined as the ellipse length ratio — suddenly dropped from more than 0.9 to less than 0.6. The angle between the major axis of the ellipse, corresponding to spindle orientation, and a vertical reference was then recorded. The position of the centre of the round mitotic cell with respect to the pattern was also automatically recorded 6 min before anaphase (see Supplementary Information, Fig. S1). Distributions were compared using the non-parametric test of Kolmogorov– Smirnov. Dn (n = n1n2/(n1 + n2)), the maximal deviation between the two cumulative fraction functions, was compared to the dn value given by the Kolmogorov–Smirnov table. The distributions were considered as significantly different when Dn > dn. (∗dn = 1,518/√n confers a 2% error probability; ∗∗dn = 1,628/√n confers a 1% error probability). Note: Supplementary Information is available on the Nature Cell Biology website.
ACKNOWLEDGEMENTS We would like to thank Y. Bellaiche and P. Chavrier for helpful discussions, D. E. Ingber for technical help during preliminary experiments, and M. Morgan and J. Sillibourne for carefully reading this manuscript. Part of this work was carried out in the clean room facility of the UMR168 at the Institut Curie. Supported by CNRS, Institut Curie and by HSFP, grant Ref RGP0064/2004 to M.B. COMPETING FINANCIAL INTERESTS The authors declare that they have no competing financial interests. Published online at http://www.nature.com/naturecellbiology/ Reprints and permissions information is available online at http://npg.nature.com/ reprintsandpermissions/ 1. Palmer, R. E., Sullivan, D. S., Huffaker, T. & Koshland, D. Role of astral microtubules and actin in spindle orientation and migration in the budding yeast, Saccharomyces cerevisiae. J. Cell Biol. 119, 583–593 (1992). 2. Gonczy, P. Mechanisms of spindle positioning: focus on flies and worms. Trends Cell Biol. 12, 332–339 (2002). 3. Tsou, M. F., Ku, W., Hayashi, A. & Rose, L. S. PAR-dependent and geometry-dependent mechanisms of spindle positioning. J. Cell Biol. 160, 845–855 (2003). 4. Gray, D. et al. First cleavage of the mouse embryo responds to change in egg shape at fertilization. Curr. Biol. 14, 397–405 (2004). 5. Ahringer, J. Control of cell polarity and mitotic spindle positioning in animal cells. Curr. Opin. Cell Biol. 15, 73–81 (2003). 6. O’Connell, C. B. & Wang, Y. L. Mammalian spindle orientation and position respond to changes in cell shape in a dynein-dependent fashion. Mol. Biol. Cell 11, 1765–1774 (2000). 7. Reinsch, S. & Karsenti, E. Orientation of spindle axis and distribution of plasma membrane proteins during cell division in polarized MDCKII cells. J. Cell Biol. 126, 1509–1526 (1994). 8. Geiger, B., Bershadsky, A., Pankov, R. & Yamada, K. M. Transmembrane crosstalk between the extracellular matrix — cytoskeleton crosstalk. Nature Rev. Mol. Cell Biol. 2, 793–805 (2001). 9. Whitesides, G. M., Ostuni, E., Takayama, S., Jiang, X. & Ingber, D. E. Soft lithography in biology and biochemistry. Annu. Rev. Biomed. Eng. 3, 335–373 (2001). 10. Piel, M., Meyer, P., Khodjakov, A., Rieder, C. L. & Bornens, M. The respective contributions of the mother and daughter centrioles to centrosome activity and behavior in vertebrate cells. J. Cell Biol. 149, 317–330 (2000). 11. Hyman, A. A. & White, J. G. Determination of cell division axes in the early embryogenesis of Caenorhabditis elegans. J. Cell Biol. 105, 2123–2135 (1987). 12. Parker, K. et al. Directional control of lamellipodia extension by constraining cell shape and orienting cell tractional forces. FASEB J. 16, 1195–1204 (2002). 13. Weed, S. A. & Parsons, J. T. Cortactin: coupling membrane dynamics to cortical actin assembly. Oncogene 20, 6418–6434 (2001). 14. Louvet, S., Aghion, J., Santa-Maria, A., Mangeat, P. & Maro, B. Ezrin becomes restricted to outer cells following asymmetrical division in the preimplantation mouse embryo. Dev. Biol. 177, 568–579 (1996). 15. Fievet, B. T. et al. Phosphoinositide binding and phosphorylation act sequentially in the activation mechanism of ezrin. J. Cell Biol. 164, 653–659 (2004). 16. Bretscher, A., Edwards, K. & Fehon, R. G. ERM proteins and merlin: integrators at the cell cortex. Nature Rev. Mol. Cell Biol. 3, 586–599 (2002). 17. Mitchison, T. J. Actin based motility on retraction fibers in mitotic PtK2 cells. Cell Motil. Cytoskeleton 22, 135–151 (1992). 18. Angers-Loustau, A., Hering, R., Werbowetski, T. E., Kaplan, D. R. & Del Maestro, R. F. SRC regulates actin dynamics and invasion of malignant glial cells in three dimensions. Mol. Cancer Res. 2, 595–605 (2004). 19. Hanke, J. H. et al. Discovery of a novel, potent, and Src family-selective tyrosine kinase inhibitor. Study of Lck- and FynT-dependent T cell activation. J. Biol. Chem. 271, 695–701 (1996). 20. Blake, R. A. et al. SU6656, a selective src family kinase inhibitor, used to probe growth factor signaling. Mol. Cell. Biol 20, 9018–9027 (2000). 21. DeMali, K. A., Barlow, C. A. & Burridge, K. Recruitment of the Arp2/3 complex to vinculin: coupling membrane protrusion to matrix adhesion. J. Cell Biol. 159, 881–891 (2002). 22. Tilghman, R. W. et al. Focal adhesion kinase is required for the spatial organization of the leading edge in migrating cells. J. Cell Sci. 118, 2613–2623 (2005). 23. Etienne-Manneville, S. & Hall, A. Cdc42 regulates GSK-3β and adenomatous polyposis coli to control cell polarity. Nature 421, 753–756 (2003). 24. Busson, S., Dujardin, D., Moreau, A., Dompierre, J. & De Mey, J. R. Dynein and dynactin are localized to astral microtubules and at cortical sites in mitotic epithelial cells. Curr. Biol. 8, 541–544 (1998). 25. Dujardin, D. L. et al. A role for cytoplasmic dynein and LIS1 in directed cell movement. J. Cell Biol. 163, 1205–1211 (2003). 26. Faulkner, N. E. et al. A role for the lissencephaly gene LIS1 in mitosis and cytoplasmic dynein function. Nature Cell Biol. 2, 784–791 (2000). 27. Wang, S. W., Griffin, F. J. & Clark, W. H., Jr. Cell-cell association directed mitotic spindle orientation in the early development of the marine shrimp Sicyonia ingentis. Development 124, 773–780 (1997). 28. Goldstein, B. Cell contacts orient some cell division axes in the Caenorhabditis elegans embryo. J. Cell Biol. 129, 1071–1080 (1995). 29. Pépin, A. & Chen, Y. in Alternative Lithography (ed. Sotomayor Torres, C. M.) 305–330 (Kluwer Academic/Plenum, Boston/Dordrecht/London, 2003). 30. Cuvelier, D., Rossier, O., Bassereau, P. & Nassoy, P. Micropatterned “adherent/repellent” glass surfaces for studying the spreading kinetics of individual red blood cells onto protein-decorated substrates. Eur. Biophys. J. 32, 342–354 (2003).
NATURE CELL BIOLOGY VOLUME 7 | NUMBER 10 | OCTOBER 2005 ©2005 Nature Publishing Group
953
S U P P L E M E N TA R Y I N F O R M AT I O N
Figure S1 Automated numerical detection of anaphase and spindle orientation of cells platted on [L] micro-patterns. (a) Frames extracted from a 3 minutes time-lapse in phase contrast microscopy with a 10x objective. Numbers correspond to those reported on the time-curve in c. Mitotic cell centre indicated in frame 4 and anaphase spindle orientation shown in frame 5 are reported from the calculation on segmented pictures (b). (b) Wavelet segmentation of the pictures in a. Ellipsoidal fits are shown in black. Black dashed lines correspond to the major and minor ellipse axes. Mitotic cell centre is measured in frame 4, six minutes before anaphase in frame 5. The orientation of anaphase elongation is that of the ellipse major axis in frame
5 with respect to a vertical reference considering the pattern oriented as shown on Fig. 2. (c) Shape factor versus time. The shape factor is the ratio of the short over the long axis defined in b. Anaphase elongation in frame 5 is automatically detected by the shape factor shift from over 0.9 to less than 0.6. (d) Examples of detections and measurements of cell divisions on [L]. (e) Examples of automatically measured distributions of spindle orientation of RPE1 cells and L929 cells plated on [L]. Both cell types divided preferentially along the [L] hypotenuse, although RPE1 distribution was much more restricted. Bars represent 20 µm.
WWW.NATURE.COM/NATURECELLBIOLOGY
1
© 2005 Nature Publishing Group
S U P P L E M E N TA R Y I N F O R M AT I O N
Figure S2 Cell rounding and spindle orientations in [L] (already shown in Fig. 2c), [rectangle] and [disc]. Centrosomes were visualised using zacquisitions and projections of centrin1-GFP in time-lapse acquisitions every 5 minutes. Graphics show the progressive modification of cell shapes and the distributions of spindle orientation as described in the legend of
Fig. 2c. Spindle orientations were measured 5 minutes after the NEB (left), at the end of cell rounding (middle) and before anaphase (right). The average reorientations between the post-NEB and the pre-anaphase stages were calculated. The reorientation on disc is significantly lower than on [L] or [rectangle] (Student test, P=2.10-4).
2
WWW.NATURE.COM/NATURECELLBIOLOGY
© 2005 Nature Publishing Group
S U P P L E M E N TA R Y I N F O R M AT I O N
Figure S3 Cortical heterogeneity guides spindle orientation. (a) Cortical distribution of cortactin in a round mitotic cell treated with 1µM NZ before mitotic entry (as judged by the non-separation of the two centrosomes visualised by centrin1-GFP). The labelling of actin and cortactin showed the RFs and revealed the local accumulation of cortactin on the cell cortex
(arrows). The average location of cortactin on 10 cells demonstrate the existence of a cortical heterogeneity during NZ treatment. (b) 1 µM of SU6656 had the same effect than 10 µM PP2 on the randomisation of the distributions of cortactin or ezrin in interphase or mitosis and on spindle orientations. See Fig. 4 for a detailed legend. Bars represent 10 µm.
WWW.NATURE.COM/NATURECELLBIOLOGY
3
© 2005 Nature Publishing Group
S U P P L E M E N TA R Y I N F O R M AT I O N
Figure S4 Model for a two-step spindle orientation process. (a) In interphase, the distribution of the ECM induces the segregation of a subset of actinbinding proteins in membrane ruffles upon adhesives zones (small arrows, red outline) which are excluded from non-adhesive zones where stress fibers can be observed (large arrows, blue outline). (b) In the prometaphase cell rounding begins with membrane retraction being greater upon nonadhesive zones (arrows). The influence this has on cell shape anisotropy
may in turn influence the initial orientation of the spindle (asterisks). (c) In the metaphase the membrane further retracts and RFs form on adhesive zones. After NEB spindle poles interact preferentially with the cortical cues associated to RFs via astral microtubules. Selective stabilisation and pulling of microtubules by cortical motors (small black arrows) accurately tune spindle orientation along the direction defined by these cues.
Movie S1 Cell divisions on adhesive micro-patterns. Time-lapse acquisitions in 10x magnification phase contrast. HeLa cells were plated on different adhesive fibronectin micro-patterns after release from a thymidine bloc. Time frame = 3 minutes. Several movies are shown together in each case. Each movie has been chosen and disposed in space in order to illustrate the main behaviour of the entire population. Movies start in order to see anaphase onset on the same picture for each micro-pattern. The first image shows the underlying fibronectin-Cy3 patterns. First line: [rectangle], second line: [disc], third line: [triangles] and fourth line: [L]. Scales: rectangle major length is 56µm, disc diameter is 29µm, triangle horizontal edge is 32µm. Movie S2 Spindle formation in a cell plated on an [L] adhesive micropattern. Time-lapse acquisition in 63x magnification phase contrast focused at cell bottom (left) and z acquisition and projection of the centrin-GFP (right). Centrosome positions have been reported on the phase contrast images with green spots. Time frame = 5 minutes. Note the correlation between centrosomes separation and cell rounding as well as the formation of retracting fibers connecting the adhesive micro-pattern to the round cell body. Scale: triangle horizontal edge is 32µm.
Movie S3 Cells on [L] recovering the proper orientation for division after NZ washout. Time-lapse acquisition in 10x magnification phase contrast. Time frame = 3 minutes. Cells were allowed to spread on micro-patterns in usual conditions then treated with 100 nM NZ. Cells rounded up but failed to assemble a metaphase plate. After NZ washout metaphase plates formed and the majority of them were correctly orientated prior to anaphase. Scale: triangle horizontal edge is 32µm. Movie S4 Spindle rotations during metaphase upon Src tyrosine kinases inhibition. The acquisition and disposition of the movies are identical to the one for movie S1. Cells were plated on [L] and treated with 1 µM SU6656 before mitosis. Movie S5 Cell divisions upon Src tyrosine kinases inhibition. Cells were plated on [L] and treated with 10 µM PP2 before mitosis. The acquisition and disposition of the movies are identical to the one for movie S1. Note the mispositioning of metaphase plates and that half of the cells (lower panels) showed defects in cleavage furrow positioning and constriction leading to binucleated cells. Movies S6: Cell divisions on square adhesive micro-patterns. See detailed legend of movie S1. First line: divisions on [cross], second line: on [L+dot], third line: on [twin bars]. Scale: square edge is 29µm.
4
WWW.NATURE.COM/NATURECELLBIOLOGY
© 2005 Nature Publishing Group