Procedure for recording the simultaneous activity of single neurons distributed across cortical areas during sensory discrimination Adria´n Herna´ndez, Vero´nica Na´cher, Rogelio Luna, Manuel Alvarez, Antonio Zainos, Silvia Cordero, Liliana Camarillo, Yuriria Va´zquez, Luis Lemus, and Ranulfo Romo1 Instituto de Fisiología Celular, Universidad Nacional Auto´noma de Me´xico, 04510 Me´xico D.F., Mexico
We report a procedure for recording the simultaneous activity of single neurons distributed across five cortical areas in behaving monkeys. The procedure consists of a commercially available microdrive adapted to a commercially available neural data collection system. The critical advantage of this procedure is that, in each cortical area, a configuration of seven microelectrodes spaced 250 –500 m can be inserted transdurally and each can be moved independently in the z axis. For each microelectrode, the data collection system can record the activity of up to five neurons together with the local field potential (LFP). With this procedure, we normally monitor the simultaneous activity of 70 –100 neurons while trained monkeys discriminate the difference in frequency between two vibrotactile stimuli. Approximately 20 – 60 of these neurons have response properties previously reported in this task. The neuronal recordings show good signal-to-noise ratio, are remarkably stable along a 1-day session, and allow testing several protocols. Microelectrodes are removed from the brain after a 1-day recording session, but are reinserted again the next day by using the same or different x-y microelectrode array configurations. The fact that microelectrodes can be moved in the z axis during the recording session and that the x-y configuration can be changed from day to day maximizes the probability of studying simultaneous interactions, both local and across distant cortical areas, between neurons associated with the different components of this task. monkeys 兩 multiple microelectrodes 兩 neuronal ensembles 兩 temporal interactions 兩 brain circuits
A
fundamental problem in neuroscience is to understand how the activities of neurons distributed across cortical and subcortical brain areas are coordinated in time during behavior. Ideally, this problem could be addressed by recording the neuronal activities with microelectrode arrays chronically implanted in several cortical and subcortical areas of the brain (1–3). Importantly, this procedure has allowed decoding information from neuronal ensembles associated with behavior (4–7). Although this procedure has been a remarkable achievement, such microelectrodes are permanently fixed in a cortical area, and therefore sample the activity of a fixed neuronal population. Also, chronically implanted microelectrodes may or may not record neural activity. However, even assuming that there is no tissue damage and that circuit architecture is preserved, in many circumstances it is desirable that the microelectrodes can be moved (4). Thus, it would be an important improvement if each microelectrode of the microelectrode array could be moved independently. In fact, this technical improvement has been already achieved, allowing the recording of the simultaneous activity of several single neurons in one cortical area during behavior (2, 8). However, in this case the microelectrode movement is limited to the z axis and, therefore, recordings are restricted to a narrow, fixed patch of cortex. This limitation prevents the simultaneous recording of single neurons across www.pnas.org兾cgi兾doi兾10.1073兾pnas.0808702105
multiple cortical areas associated with a behavioral task. This limitation is even more problematic if we want to study the temporal interactions between neurons that reside in distant cortical and subcortical circuits associated with a behavioral task. Thus, new procedures are needed. Here, we report a new setup, which consists of a microelectrode drive (Eckhorn microdrive; see ref. 9) adapted to a neural data collection system (Cerebus 128 Channel Data Acquisition System; see ref. 10), for recording simultaneous activity from many single neurons distributed across five cortical areas. We illustrate this technique with recordings obtained while trained monkeys discriminate the difference in frequency between vibrotactile stimuli (11). In every 1-day recording session, an array of seven microelectrodes is inserted transdurally in each selected cortical area. Each microelectrode can be moved independently in the z axis, and the x-y array configuration can be changed from day to day. For each microelectrode, the neural data collection system allows the discrimination of one to five neurons together with the LFP. Because this procedure is quite reliable, in a short period we have compiled a large database of many groups of neurons recorded simultaneously in five cortical areas during the vibrotactile discrimination task (see Table 1). The procedure was also validated by the fact that the response properties of the simultaneously recorded neurons studied were similar to those previously observed by using single microelectrode arrays (12– 14). During vibrotactile discrimination, the activity of the recorded neurons reflected the sensory encoding, working memory, and decision processes of the task. Therefore, the procedure opens the possibility of analyzing the temporal interactions between neurons of local and distant cortical circuits involved in this task. Results For recording of the simultaneous activity of single neurons in five cortical areas (Figs. 1 and 2), six dedicated persons are required: one for controlling each microelectrode drive and one for monitoring the behavioral protocol and the task performance of the animal. The job of each dedicated person is to select and discriminate the spike waves recorded from each microelectrode in their respective array (Fig. 2; see Methods). The spike trains from all neurons and the LFPs are displayed on computer screens (Fig. 2). During task performance, such spike rasters and LFPs can be ordered in various ways, depending on Author contributions: A.H. and R.R. designed research; A.H., V.N., R.L., M.A., A.Z., S.C., L.C., Y.V., L.L., and R.R. performed research; A.H., V.N., R.L., M.A., A.Z., S.C., L.C., Y.V., L.L., and R.R. analyzed data; and R.R. wrote the paper. The authors declare no conflict of interest. Freely available online through the PNAS open access option. 1To
whom correspondence should be addressed. E-mail:
[email protected].
This article contains supporting information online at www.pnas.org/cgi/content/full/ 0808702105/DCSupplemental. © 2008 by The National Academy of Sciences of the USA
PNAS 兩 October 28, 2008 兩 vol. 105 兩 no. 43 兩 16785–16790
NEUROSCIENCE
Contributed by Ranulfo Romo, September 2, 2008 (sent for review July 30, 2008)
Table 1. Number of neurons simultaneously recorded in each of the 30 sessions while the monkey performed in the vibrotactile task
A
MPC DPC S2
Area Session 1 2 3 4 5 6 7 8 9 10 11 12 13 14 15 16 17 18 19 20 21 22 23 24 25 26 27 28 29 30 Mean
S1
S2
MPC
DPC
M1
Total
6 4 4 6 8 5 5 5 6 6 7 6 7 3 6 7 6 2 5 8 8 7 9 11 9 6 5 7 7 10 6.4
18 15 11 13 17 13 13 15 17 21 9 6 8 16 14 15 16 17 15 13 14 11 19 23 28 18 16 12 18 21 15.4
6 4 11 11 13 12 10 10 11 10 15 13 17 17 13 13 13 21 18 17 16 16 19 17 18 12 12 22 17 18 14.1
10 9 10 9 12 9 9 12 10 10 18 16 11 12 9 16 16 8 9 13 15 16 15 12 15 15 16 14 15 5 12.2
10 9 14 14 12 13 8 10 11 8 14 11 7 11 7 7 6 9 9 10 12 11 10 13 11 16 12 12 11 15 10.8
50 41 50 53 62 52 45 52 55 55 63 52 50 59 49 58 57 57 56 61 65 61 72 76 81 67 61 67 68 69 58.8
These sessions were randomly selected from 60 recording sessions. S1, primary somatosensory cortex; S2, secondary somatosensory cortex; MPC, medial premotor cortex; DPC, dorsal premotor cortex; M1, primary motor cortex. The responses of the neurons of session 23 are displayed in Fig. 3A.
the different task components and stimulus classes [Figs. 3 and 4, and supporting information (SI) Fig. S1]. Simultaneous Recording of Neurons Across Cortical Areas During Vibrotactile Discrimination. We recorded the simultaneous activ-
ities of single neurons from five cortical areas (Fig. 1) while two trained monkeys (Macaca mulatta) performed the vibrotactile discrimination task (11). These cortical areas were the primary somatosensory cortex (S1), secondary somatosensory cortex (S2), dorsal premotor cortex (DPC), medial premotor cortex (MPC), and primary motor cortex (M1). Recordings in S1, S2, DPC, and MPC were made in the hemisphere contralateral to the stimulated hand, and in M1 in the hemisphere contralateral to responding hand/arm (11). During the recording sessions, each dedicated person moves each microelectrode until she/he finds neurons whose activities are modulated during any of the task components. This search takes several trials. One to four spikes (usually one to two spikes, and exceptionally three to four) can be discriminated in each microelectrode, data collection begins. The amplitudes of the recorded neurons were well above baseline noise (signal-to-noise ratio, 0.5 ⫾ 0.3 dB) with spikes of 40–400 V (before amplification). Fig. 3A shows the activities of 72 neurons in one single trial (Table 1 shows the number of recorded neurons across 16786 兩 www.pnas.org兾cgi兾doi兾10.1073兾pnas.0808702105
M1
S1 Acrylic cap
B
C
1
1 2
2
3
3 4 4
5
10 mm
5
Chamber ic ryl Ac ne Bo ra Du bral re Ce rtex Co
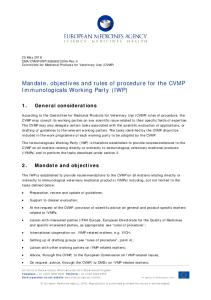
Fig. 1. Procedure for recording the simultaneous activity of neurons from five cortical areas. (A) Schematic representation of each microdrive head in position for recording the simultaneous activity of single neurons from five cortical areas, while the monkey performed a vibrotactile discrimination task (11). Positioning of each microdrive head into the chamber was facilitated by the X-Y-Z degrees of movement available to the microdrive carrier. Each microdrive, which is not seen in the picture, moves seven independent microelectrode fibers. (B) Photograph of the assembled microdrive head: 1, array of seven stainless steel guide tubes for electrode orientation; 2, cylinder for holding the stainless steel guide tubes; 3, stainless steel O-ring for adjusting the end of the microdrive head to the rim of the stainless steel chamber; 4, rubber O-ring for hydraulic closure of the chamber; and 5, the seven microelectrodes extending from the distal end of the microdrive head. (C) Schematic representation of the microdrive head positioned inside the stainless steel chamber implanted into the cranial bone. The end of the microdive head rests just at the dural surface and the microelectrodes can be advanced through the dura for recording single neurons. Numbers indicate the same components in B and C.
different recording sessions in one monkey). All these neurons were recorded while the monkey performed at psychophysical threshold (11). The discrimination protocol included 10 trials for each stimulus frequency pair (f1, f2). We used several stimulus protocols to test not only the stimulus encoding in S1 and S2 cortices, but also the working memory and decision processes already shown to occur in S2, MPC, and M1 cortices (Fig. S1). All these tests were completed in ⬇5–6 h, during which both the amplitudes of the selected spikes and the neuronal response properties remained stable. Because we used many stimulus tests to dissect the behavioral responses, we could not record the simultaneous activity of many different groups of neurons in one daily session. However, when we used only one stimulus set (for the threshold discrimination test), on average, ⬇35 task-related neurons could be recorded in each cortical area by moving the microelectrodes to new positions, and therefore we collected ⬇350 neurons in every daily session. Local and Interarea Interactions During Vibrotactile Discrimination.
The simultaneous recording of multiple neurons across cortical areas allows the study of distant interactions. Of particular Herna´ndez et al.
R IX
E S& IM
S2
M
R AT
IX MP
C
E S & IM
T MA
RI
X DP
E S & IM
C
T MA
RI
X M1
M
R AT
IX
E S& IM
E S & IM
M AS TE R C O NN E C TIO N BO X
C E R EBU S P R EAM P LIFIE R
M ICROS TIM U LA TIO N
N E UR A L S IGN A L P R OC ESS O R C E R EBU S 128 CHA NNE L SYSTEM 10 0 /100 0 S W ITC H
O N -LIN E D A TA C O N VE R S IO N A ND S T O R A G E
S1 M O TO R CO NTRO L
S2 M O TO R CO NTRO L
M PC M O TO R CO NTRO L
DPC M O TO R CO NTRO L
M1 M O TO R CO NTRO L
Fig. 2. Schematic representation of the connections between the five microdrives and the neural data collection system. See description in Methods. ES, electrode selection; IM, impedance test.
interest are our recordings in S1 and S2. S1 is composed of two contiguous areas: 3b and 1. Area 3b is in the bank of the postcentral gyrus, and anterior to area 1. S2 is located ⬇6 mm below the cortical surface, between the anterior end of the intraparietal sulcus and the lateral sulcus. Therefore, areas 3b and S2 are located deep with respect the cortical surface. Thus, an important question is whether microelectrodes can be reliably inserted into areas 3b and S2. The answer is yes, with an error of ⬇100–200 m, when the recording is repeated at the same target location (the neurons had similar cutaneous receptive fields at the same height relative to the cortical surface). This procedure allowed testing several recording protocols in S1 and S2 (while activity in DPC, MPC, and M1 was simultaneously recorded). In these experiments, we selected neurons from S1 (areas 3b and 1) with the same cutaneous submodality [quickly adapting (QA) or slowly adapting (SA) responses], and selected S2 neurons with large cutaneous receptive fields confined to the fingers of the stimulated hand. Stimuli were delivered to the skin and neuronal responses were analyzed as functions of stimulus frequency. In principle, the procedure is ideal for studying the simultaneous activities of neurons that share cutaneous receptive fields and that respond during the vibrotactile discrimination task. Fig. 3A shows nine neurons recorded simultaneously: five in area 3b and four in area 1. These traces were obtained with three microelectrodes in area 3b (S1-E1 to S1-E3 of Fig. 3A), two of which recorded two neurons from the electrode tips (S1-E2 and S1-E3 of Fig. 3A), and four microelectrodes in area 1 (S1-E4 to S1-E7 of Fig. 3A), each recording one single neuron. All of these neurons from areas 3b and 1 had small cutaneous receptive fields on the distal segment of the third digit, had QA properties, and modulated their firing rates during stimulus presentation as reported before (12). As indicated above, simultaneous neuronal recordings allow for the analysis of temporal interactions during task perforHerna´ndez et al.
mance. To illustrate this interaction, we quantified the synchrony of the neurons in Fig. 3A by analyzing their correlations (15, 16). The example shown in Fig. 3B is from a pair of neurons recorded simultaneously in area 3b (S1-E1, black asterisk in Fig. 3A) and area 1 (S1-E4, red asterisk in Fig. 3A). Clearly, these two neurons show a temporal dependency during stimulus presentation, which manifests as peaks above chance at 3 and 7 ms in the correlogram. This suggests that the 3b neuron drives the area 1 neuron, because the latter tends to fire 3 and 7 ms after the area 3b neuron fires. Fig. 3C shows an example of temporal interaction within a local circuit. It shows the correlogram from two neurons recorded through the same microelectrode in S2 (black and red crosses of S2-E9 in Fig. 3A). The correlogram peak indicates that the neuron corresponding to the red ticks typically responded ⬇3 ms after the neuron with the black ticks (Fig. 3C). A greater challenge is to analyze the temporal interactions between neurons belonging to distant cortical circuits. An example of such analysis is shown in Fig. 3D. In this case, the pair of neurons consisted of one from S1 and another from S2. Fig. 3D shows their responses during stimulus presentation and the corresponding correlogram. It can be seen that the neuron from S2 produced a spike 11 ms after a spike from the S1 neuron more often than expected by chance. In addition to using spikes from individual neurons, we can also analyze correlations between the LFPs recorded with the same microelectrodes in these cortical areas. The example in Fig. 4 illustrates the kinds of results that can be obtained when data from multiple cortical areas are collected simultaneously. The resulting matrix of correlations shows the distributed nature of the sensory information encoded in these areas. Discussion Previously, we described the responses of single neurons from several cortical areas associated with the different components of the vibrotactile discrimination task (12–14). But how neurons from these cortical areas join efforts to solve this task is not known. This is a difficult problem, mostly because there are no reliable recording methods to obtain the simultaneous activities of large populations of neurons from both local and distant circuits during behavior. Initially, we tried implanting chronic microelectrode arrays (5, 6, 17) at fixed positions in five cortical areas associated with the vibrotactile discrimination task. However, we found that many of the recorded neurons were not associated with the task. For this reason, we adapted the Eckhorn method (9), in which the microelectrodes cannot only be moved in the z axis but can also be inserted at different points in the selected cortical area. An important property of this recording method is that microelectrodes can be reliably inserted both superficially and in deep structures such as S2, which is ⬇6-mm deep, and even in subcortical structures such as the somatosensory thalamus. Also, the data collection system is good enough for our purposes, because it allows for up to five single units per microelectrode (although usually one to two units per electrode) together with the LFP. In brief, the most important result of this study is that, from day to day, we were able to reliably record the simultaneous activities of neurons from several cortical areas associated with the vibrotactile discrimination task. The procedure is flexible enough that it allows us to search for relevant responses associated with our task, because the microelectrodes can be moved in the z axis, and because they can be reinserted into the recording chamber by using the same or different x-y microelectrode array configurations. However, a limiting power of this approach would be that many laboratories might not have six dedicated persons to daily recording sessions, and automated procedures should be considered as a future addition to this technique (18). Despite this limitation, our approach seems well suited for investigating the fine functional connectivity between cortical areas. The detailed PNAS 兩 October 28, 2008 兩 vol. 105 兩 no. 43 兩 16787
NEUROSCIENCE
S1
T MA
B KU PB
*
o
-250
Average counts
*
S1-E1 S1-E2 S1-E3 S1-E4 S1-E5 S1-E6 S1-E7 S2-E8 S2-E9 S2-E10 S2-E11 S2-E12 S2-E13 S2-E14 MPC-E15 MPC-E16 MPC-E17 MPC-E18 MPC-E19 MPC-E20 MPC-E21 DPC-E22 DPC-E23 DPC-E24 DPC-E25 DPC-E26 DPC-E27 DPC-E28 M1-E29 M1-E30 M1-E31 M1-E32 M1-E33
-2000
f1
3b * vs . Area 1*
f2
0
0.6
250
500
Time [ms]
-15
-10
-5
0
5
o + +
750
0
-0.6 -20
C
10
15
20
Time [ms]
f1
S2 + vs. S2 +
Average counts
-250
0.8
0 -0.2 -20
0
-15
250
-10
-5
D
0
500
5
10
750
Time [ms]
15
20
Time [ms]
f1
S1 o vs. S2 o
-250 0
2000
4000
6000
8000
Time [ms]
Average counts
A
f1
0
0.5
250
500
750
Time [ms]
0
-0.5 -20
-15
-10
-5
0
5
10
15
20
Time [ms]
Fig. 3. Simultaneous recording from single neurons across cortical areas. (A) Raster plots from 72 neurons from five cortical areas during vibrotactile discrimination. These recordings were made by using a seven-microelectrode drive in each area (in M1, only five microelectrodes were inserted during this session). For each microelectrode, one to five units could be isolated; these groups of units are indicated at the left of the figure. Each row of consecutive ticks represents the activity of one neuron. The x axis represents time throughout one trial of the vibrotactile discrimination task: f1, first stimulus frequency and f2, second stimulus frequency. (B) Cross-correlation analysis of two neurons recorded simultaneously in S1, one in area in 3b (black ticks) and the other in area 1 (red ticks) of S1 (black and red asterisks in A). Each pair of rows in B (black and red) corresponds to a single trial. The responses are shown during six trials of f1 stimulus presentation at a frequency of 22 Hz. Stimuli were applied to the distal segment of the third finger of the right hand. The corresponding covariogram is shown below the raster plot. Counts above the broken line indicate intervals during which the two neurons had significant temporal dependency (15). In this example, neuron 2 fires spikes more often than expected by chance ⬇3 and 7 ms after a spike of neuron 1. (C) Similar analysis for a pair of neurons recorded simultaneously in S2 by using the same microelectrode. One of the two neurons (red plus in A) discharged reliably 3 ms after the other neuron (black plus in A). (D) Cross-correlation analysis of two neurons recorded simultaneously, one in S1 (red circle) and the other in S2 (red circle). The S2 neuron responded 11 ms after the S1 neuron.
functional connectivity can also be studied by identifying by antidromic activation the neurons that project to a particular target (19). Thus, this procedure seems quite appropriate for investigating not only the interactions between cortical areas, but also between cortical and subcortical structures in behaving monkeys. Methods Discrimination Task. The discrimination task used here has been described before (11). Monkeys were handled according to institutional standards that meet those of the National Institutes of Health and Society for Neuroscience. Microelectrode Drives and Preparations for Recording. The microdrive and microelectrodes used here have been described in detail (Thomas Recording; see ref. 9). Essentially, the microdrive carries seven stainless-till tubes (304-m outside diameter and 150-m inside diameter) aligned with a changeable circular thimble (head implant, as reported in ref. 20) (Fig. 1B). The tubes can be arranged in any x-y pattern, constrained by the 304-m diameter. The changeable head implants (7-mm diameter) contain linear arrangements of 304 or 500 m located centrally or eccentrically (0 –2,000 m) within the circular head implant (Fig. 1C). These head implants can be changed from day to day for mapping the response properties of the exposed cortical area. One microelectrode (1–1.5 M⍀; see ref. 9) is inside each of the tubes, and the tips end of the microelectrodes are ⬇1 mm back from the end of the tubes. This position avoids damaging the tips of the microelectrodes. The distal end of the head implant is covered with a thin rubber band to prevent fluid into the carrier tubes. The head implant is positioned inside a small chamber (7.2 mm of internal diameter) previously implanted after a small craniotomy to expose 16788 兩 www.pnas.org兾cgi兾doi兾10.1073兾pnas.0808702105
the dura above the targeted cortical area. The microdrive is lowered until the O-ring bears on the top of the chamber, in such a way that the end of the head implant rests just over the dural surface, therefore closing the chamber. Each microelectrode is moved at a speed of 20 m/s, crosses the thin rubber band and dura, and stops once it reaches the top of the cortex. This maneuver is made under computer control and continuous impedance testing of each microelectrode (Fig. 2). Once all microelectrodes are on the top of cortex, the recording session begins by gently lowering (5–20 m/s) the electrodes into each cortical area to isolate the activity of single neurons. Data Recording. Each seven-microelectrode drive is connected to a device that allows the selection of one of three functions for each microelectrode: neural recording, impedance testing, and electrical microstimulation (Fig. 2). Microelectrode signals are sent to preamplifiers through a master connection box and from them to the neural processing system by means of optic fiber (Cerebus 128 Channel Data Acquisition System, Cyberkinetics Neurotechnology Systems; see ref. 10). The master connection box directs each preamplifier output to the Cerebus. This box solves the problem of the different connectors for the Eckhorn drive and the Cerebus [Bayonet Neill Concelman Connectors (BNCs) used as outputs from Thomas Recording to SFMC-118㛭Samtec as inputs by Cyberkinetics Neurotechnology Systems]. The neuronal data are then organized and stored trial-by-trial in a PC computer. A dedicated person operates each microdrive and monitors data through programs available in the neural data processing system by means of local network (Switch Ethernet 100/1,000 MHz). Spike amplification, filtering, and selection are established through an independent PC computer for each microelectrode drive (pcS1, pcS2, pcMPC, pcDPC, and pcM1) by using the Cerebus software. Spike amplitudes were between 40 – 400 V, well suited for spike discrimination (normally 1 or 1–3 spikes). By using Visual C⫹⫹ and Matlab applications, neuronal data
Herna´ndez et al.
A
f1
f2
S1: E1 S1: E2 S1: E3 S1: E4 S1: E5 S1: E6 S1: E7 S2: E8 S2: E9 S2: E10 S2: E11 S2: E12 S2: E13 S2: E14 MPC: E15 MPC: E16 MPC: E17 MPC: E18 MPC: E19 MPC: E20 MPC: E21 DPC: E22 DPC: E23 DPC: E24 DPC: E25 DPC: E26 DPC: E27 DPC: E28 M1: E29 M1: E30 M1: E31 M1: E32 M1: E33 -2000
S1
B
S2
MPC
DPC
M1
25 # Electrode
1 M1
30
DPC
20
0.8 0.6 0.4
MPC 15 10
S2
5
S1
0.2 0 0. 2
0
2000 Time [ms]
4000
10
15 20 # Electrode
25
30
6000
Fig. 4. LFPs recorded simultaneously from each of the microelectrodes of Fig. 3. (A) LFPs obtained by applying a low-pass filter of 250 Hz to the multiunit activity recorded in each microelectrode. We illustrate only one single trial during the vibrotactile discrimination task, as indicated in Fig. 3A. (B) Correlation coefficient values between the recorded LFPs. This analysis was made for the f1 stimulus period. Strong correlations are observed between the LFPs in S1, very likely because these electrodes share the same cutaneous receptive fields. There are also correlations between the LFPs of the MPC and M1. Color bar indicates correlation strength.
are presented as raster displays and organized according to the different components of the vibrotactile task (see Figs. 3 and 4). Each user controls microelectrode movements through the PC computer and the corresponding hardware (microdrive control box.). Neuronal Recordings and Sites. Neuronal recordings were obtained with an array of seven independent, movable microelectrodes (1–1.5 M⍀; see ref. 4) inserted in S1 (area 3b or 1), S2, DPC, and MPC in the hemisphere contralateral to the stimulated hand (Fig. 1 A), and M1 in the hemisphere contralateral to the responding hand. Neurons from areas 3b and 1 had small cutaneous receptive fields with QA properties, whereas those from area S2 had large cutaneous receptive fields with no obvious submodality properties. Neurons of the frontal cortex had no obvious cutaneous or deep receptive fields; they were selected if they responded to any of the different components of the discrimination task. Cortical areas were identified based on cortical landmarks.
temporal dependence between pair of neurons by estimating the covariogram, by using equations 2.2 and 2.4 of Brody (15, 16). The analysis was made for the 500 ms of the f1 stimulus period, by using 90 trials (repetitions) of the stimulus f1 (22 Hz). The temporal resolution was of 1 ms. The algorithm was programmed in Matlab (The Mathworks). Two standard deviations were considered to establish the limits of significance of the covariogram. The 500 ms previous to the f1 presentation were used to eliminate correlations due to changes in excitability of the neuronal response across time [equation 2.2 in Brody (15)]. The neuronal signal of each microelectrode was sampled at 30 kHz. Simultaneously, the LFPs were obtained by using a 250 Hz Butterworth digital low-pass filter of fourth order. The LFPs were stored at 2 kHz for offline analysis. For Fig. 4, the correlation coefficient for each pair of microelectrodes was estimated by using the same periods as for the spiking neurons.
Data Analysis. We carried analyses that determined the firing rate modulations for each neuron and the dependence on f1 and f2 through multivariate regression analysis described previously (12–14). We also determined the
ACKNOWLEDGMENTS. We thank Emilio Salinas and Carlos Brody for comments and Mo´nica García and Adria´n Ponce for technical assistance. R.R. was supported by an International Research Scholars Award from the Howard Hughes Medical Institute and grants from the Direccio´n del Personal Acade´mico de la Universidad Nacional Auto´noma de Me´xico and the Consejo Nacional de Ciencia y Tecnología.
1. Nicolelis MAL, et al. (2003) Chronic, multisite, multimicroelectrode recordings in macaque monkeys. Proc Natl Acad Sci USA 100:11041–11046. 2. Wilson MA, McNaughton BL (1993) Dynamics for the hippocampal ensemble code for space. Science 261: 1055–1058. 3. Tolias AS, et al. (2007) Recording chronically from the same neurons in the awake, behaving monkeys. J Neurophysiol 98:3780 –3790. 4. Schwartz AB (2004) Cortical neural prosthetics. Annu Rev Neurosci 27:487–507. 5. Rubino D, Robbins KA, Hatsopoulos NG (2006) Propagating waves mediate information transfer in the motor cortex. Nat Neurosci 9:1549 –1557. 6. Hochberg LR, et al. (2006) Neuronal ensemble control of prosthetic devices by a human with tetraplegia. Nature 442:164 –171. 7. Lebedev MA, O’Doherty JE, Nicolelis MAL (2007) Decoding of temporal intervals from cortical ensemble activity. J Neurophysiol 99:166 –186.
8. Gray CM, Baldwin G, Lear A (2007) Multichannel micromanipulator and chamber system for recording multineuronal activity in alert, non-human primates. J Neurophysiol 98:527–536. 9. Eckhorn R, Thomas U (1993) A new method for the insertion of multiple microprobes into neural and muscular tissue, including fiber electrodes, fine wires, needles and microsensors. J Neurosci Methods 49:175–179. 10. Vargas-Irwin C, Donoghue P (2007) Automated spike sorting using density grid contour clustering and subtractive waveform decomposition. J Neurosci Methods 164:1–18. 11. Herna´ndez A., García R, Salinas E, Romo R (1997) Discrimination in the sense of flutter: New psychophysical measurements in monkeys. J Neurosci 17: 6391– 6400. 12. Herna´ndez A, Zainos A, Romo R (2000) Neuronal correlates of sensory discrimination in the somatosensory cortex. Proc Natl Acad Sci USA 97:6191– 6196.
Herna´ndez et al.
PNAS 兩 October 28, 2008 兩 vol. 105 兩 no. 43 兩 16789
NEUROSCIENCE
0. 4 5
13. Romo R, Brody CD, Herna´ndez A, Lemus L (1999) Neuronal correlates of parametric working memory in the prefrontal cortex. Nature 399:470 – 473. 14. Herna´ndez A, Zainos A, Romo R (2002) Temporal evolution of a decision-making process in medial premotor cortex. Neuron 33:959 –972. 15. Brody CD (1999) Correlations without synchrony. Neural Comput 11:1537–1551. 16. Brody CD (1999) Disambiguating different covariation types. Neural Comput 11:1527–1535. 17. Musallam S, Back MJ, Troyk PR, Andersen RA (2007) A floating metal microelectrode array for chronic recording. J Neurosci Methods 160:122–127.
16790 兩 www.pnas.org兾cgi兾doi兾10.1073兾pnas.0808702105
18. Cham JG, et al. (2005) Semi-chronic motorized microdrive and control algorithm for autonomously isolating and maintaining optimal extracellular action potentials. J Neurophysiol 93:570 –579. 19. Baker SN, et al. (1999) Multiple single unit recording in the cortex of monkeys using independently moveable microelectrodes. J Neurosci Methods 94:5–17. 20. Mountcastle VB, Reiboeck HJ, Poggio GF, Steinmetz MA (1991) Adaptation of the Reiboeck of multiple microelectrode recording to the neocortex of the waking monkey. J Neurosci Methods 26:77– 84.
Herna´ndez et al.