Plant Molecular Biology 48: 155–171, 2002. © 2002 Kluwer Academic Publishers. Printed in the Netherlands.
155
Metabolomics – the link between genotypes and phenotypes Oliver Fiehn Max-Planck Institute of Molecular Plant Physiology, 14424 Potsdam, Germany (e-mail
[email protected])
Key words: functional genomics, mass spectrometry, metabolism, metabolite profiling
Abstract Metabolites are the end products of cellular regulatory processes, and their levels can be regarded as the ultimate response of biological systems to genetic or environmental changes. In parallel to the terms ‘transcriptome’ and ‘proteome’, the set of metabolites synthesized by a biological system constitute its ‘metabolome’. Yet, unlike other functional genomics approaches, the unbiased simultaneous identification and quantification of plant metabolomes has been largely neglected. Until recently, most analyses were restricted to profiling selected classes of compounds, or to fingerprinting metabolic changes without sufficient analytical resolution to determine metabolite levels and identities individually. As a prerequisite for metabolomic analysis, careful consideration of the methods employed for tissue extraction, sample preparation, data acquisition, and data mining must be taken. In this review, the differences among metabolite target analysis, metabolite profiling, and metabolic fingerprinting are clarified, and terms are defined. Current approaches are examined, and potential applications are summarized with a special emphasis on data mining and mathematical modelling of metabolism.
Introduction Even though the Arabidopsis thaliana genome has been completely sequenced, over 30% of its genes are not functionally classified according to sequence similarities to other organisms, and only 9% have been experimentally characterized (Arabidopsis Genome Initiative, 2000). Moreover, of the genes believed to be involved in plant metabolism, most functional characterizations are not based upon rigid biochemical testing. Gene assignments by sequence homology can only give hints to putative functions, but are almost certainly not specific enough to describe biochemical functions and the underlying biological roles. For example, gene duplication is responsible for many of the enzyme isoforms that occur in different cellular compartments or that exhibit altered kinetic characteristics. However, it is also possible that enzyme isoforms arise with altered substrate specificity. Such changes in specificity could explain the vast number of different metabolites – up to 200 000 – that are estimated to occur in the plant kingdom (D. Strack and R. Dixon, personal communications). In parallel to the terms
transcriptome and proteome, the set of metabolites synthesized by an organism constitute its metabolome (Oliver et al., 1998). Teusink et al. (1998) also suggested the systematic analysis of metabolic snapshots as a valid approach towards a quantitative rather than qualitative description of cellular regulation and control. Without having data from metabolomic analyses at that time, such metabolic snapshots were defined as the exhaustive extraction and quantitative analytical determination of plant metabolites. Similarly to the definition of the proteome or the transcriptome, the metabolome can be defined on all levels of complexity, such as organisms, tissues, cells or cell compartments. Further, the environmental conditions under which a biological experiment was carried out need to be specified as exactly as possible. The proportion of metabolites performing explicit biological functions relative to those that do not is unknown. Since many plant metabolites are familyor species-specific, it is likely that at least some fulfil important biological functions such as helping plants to survive in specialized ecological niches. In order to determine the function of such metabolites (and
156 their corresponding enzymes), two basic strategies can be applied, forward genetics and reverse genetics. In forward genetic approaches, naturally occurring mutants, mutagenized plants or dichotomous accessions with interesting phenotypes can be used to identify and characterize genes of interest. In reverse genetic approaches, analysis begins with a cloned gene or isolated protein and works toward the phenotype. Regardless of the strategy employed, it is essential that phenotypic effects be described as explicitly as possible. Our understanding of phenotype is based upon what we can observe about the character of an organism, and, at last, can be observed at the metabolite level. Since it is so important to precisely link gene function to phenotype, several means have been suggested for a precise description of metabolism, including the concepts of metabolic control analysis (Cornish-Bowden and Cárdenas, 2000) and individual analysis of steady-state metabolite levels (Trethewey et al., 1999). The requirements and current strategies for the comprehensive and quantitative analysis of the molecular phenotype have been recently reviewed for all three levels of gene products (mRNA, proteins and metabolites), including thoughts on database requirements and informatic tools (Fiehn et al., 2001). Unfortunately, metabolites have a much greater variability in the order of atoms and subgroups compared to the linear 4-letter codes for genes or the linear 20letter codes for proteins. Therefore, they cannot be sequenced like genes or proteins using (comparatively simple) read-outs from one end to the other. Instead, the elemental composition, the order of the atoms and the stereochemical orientation have to be elucidated de novo for metabolites in a complex manner. Moreover, interpretation of metabolic data is complicated by the convoluted nature of plant metabolism. Accordingly, different analytical approaches have been designed in order to answer specific types of questions. These approaches are defined as follows. First, to directly study the primary effect of a genetic alteration, an analysis can be constrained exclusively to the substrate and/or the direct product of the corresponding encoded protein. Since all other metabolites are incidental to this question, extensive sample clean-up may be used, if needed, to avoid interference from major accompanying compounds. This strategy is called target analysis and is mainly used for screening purposes, and for analyses calling for extreme sensitivity such as the monitoring of phytohormones.
Second, to elucidate the function of a whole pathway or intersecting pathways, it is often not necessary to view the effect of a genetic alteration on all branches of plant metabolism. Instead, the analytical procedure can be restricted to the identification and quantification of a selected number of pre-defined metabolites in a biological sample. Sample preparation and cleanup can be focused on the chemical properties of these compounds so as to reduce matrix effects. This process is called metabolite profiling (or, sometimes, metabolic profiling). For example, these pre-defined metabolites may belong to a class of compounds (such as polar lipids, isoprenoids, or carbohydrates), or be narrowed down to members of particular pathways. The term metabolite profiling is frequently used in the specific context of drug research in the description of catabolic degradation of an applied chemical. Third, quite frequently, the repercussions of a single genetic alteration are not limited to one biochemical pathway. Indeed, the metabolite levels of seemingly unrelated biochemical pathways may be altered due to pleiotropic effects. In order to understand these effects, a comprehensive analysis in which all the metabolites of a biological system are identified and quantified is needed. Since such an approach reveals the metabolome of the biological system under study, this approach should be called metabolomics. Metabolomic approaches must aim at avoiding exclusion of any metabolite by using well conceived sample preparation procedures and analytical techniques. The resolving power of the analytical method chosen must be high enough to maintain sensitivity, selectivity, matrix independence, and universal applicability. Since metabolomic data sets are complex by nature, adequate tools are needed to handle, store, normalize, and evaluate the acquired data in order to describe the systemic response of the biological system. Furthermore, true metabolomic approaches must also include strategies to identify unknown metabolites, and might even reach out to compare analytical results with models of theoretical biochemical networks. Fourth, to screen a large number of lines in genomic or plant breeding programmes, as well as to enable diagnostic usage in industry or clinical routines, it might not be necessary to determine the individual level of every metabolite. Instead, it is often sufficient to rapidly classify samples according to the origin or their biological relevance in order to maintain a high throughput. This process is called metabolic fingerprinting. Erroneously, such approaches have occasionally been termed metabonomics. Such a misnomer
157 could lead to confusion about the completely different goals of fingerprinting and metabolomics or about the metabolon, which terms the coordinated channelling of substrates through tightly connected enzyme complexes. Sometimes, metabolic fingerprints have enough resolving power to distinguish among individual signals that then can be related to sample classification. However, this should not lead to the assumption that with such techniques all or even the most important effects can be identified, since major events might be obscured due to irreproducible matrix effects during sample preparation and data acquisition. A number of different applications of metabolomic analyses can be imagined. Some are more obvious, such as increasing metabolic fluxes into valuable biochemical pathways using metabolic engineering (e.g. enhancing the nutritional value of foods, decreasing the need for pesticide or fertilizer application, etc.) or into pathways needed for the production of pharmaceuticals in plants (Giddings et al., 2000). Other fields of applications are less obvious. For example, metabolomic analysis could be applied to assessing the substantial equivalence of genetically modified organisms (World Health Organization, 2000) if the metabolic phenotypes of a variety of well-known cultivars (that are commonly believed to be safe) are compared to transgenic plants. In addition, metabolomic analysis will have a great theoretical impact on understanding metabolism, for example for the prediction of novel metabolic pathways, and to describe cellular networks in vivo. Finally, metabolomics might prove a valid tool when investigating the cause of biological effects, such as plant-pathogen interactions. In this paper, current approaches to gaining metabolomic data are reviewed, and the potential uses of these data are discussed in the context of statistical analysis, data mining and mathematical modelling.
Metabolomic sample preparation When aiming at the simultaneous detection of all metabolites in plant tissues, the applied methods cannot be restricted to the technical question which type of data acquisition might be most suitable but also must seriously consider adequate methods for sample preparation. As a first step for such methods, plant physiologists have long been aware of the importance of rapidly stopping the inherent enzymatic activity of biological samples. This has been achieved by freeze clamping, immediate freezing in liquid nitrogen, or
by acidic treatments using perchloric or nitric acid (ap Rees and Hill, 1994). Although advantageous for extraction of amines (Bouchereau et al., 2000), acidic treatments pose severe problems for many analytical methods that follow, and harvesting and depositing plant tissues into tubes for liquid nitrogen freezing may take up to 15 s. Compared to freeze clamping techniques, freezing samples in liquid nitrogen is therefore a slower process that could potentially produce artefacts caused by wound responses, rapid activation of touch-inducible genes, etc. This might especially be the case if samples are weighed before freezing, and if no attention is paid to this special problem. Since freeze clamping is not easily applicable in functional genomic programmes where lots of samples have to be harvested, freezing in liquid nitrogen remains a reasonable way to stop enzymatic activity. Certainly, great care must be also taken to avoid partially thawing tissues before extracting metabolites. One way to do this is to freeze-dry biological samples resulting in completely dried samples. In the absence of water in the samples, enzymes or transporters are unable to work. If stored before sample extraction, samples have to be kept in dry environments like evacuated desiccators, since tissues are highly hygroscopic which almost certainly will lead to partial recovery of some enzymes like hydrolases. Alternatively, frozen tissues can be directly extracted by immediately adding organic solvents and applying heat, thereby also inhibiting the recovery of enzymatic activity. Extracting frozen tissues that still contain the original amount of water might be advantageous for metabolomic approaches when compared to extracting freeeze-dried samples, since freeze-drying may potentially lead to the irreversible adsorption of metabolites on cell walls and membranes. If metabolomic analysis sets out to distinguish between metabolite levels in different compartments, samples need to be freeze-dried prior to non-aqueous fractionation methods (Gerhardt and Heldt, 1984; Farré et al., 2001). An alternative approach to non-aqueous fractionation is the use of nuclear magnetic resonance analysis (NMR) to distinguish steady-state concentrations of metabolites in different compartments in vivo (Roberts, 2000). Such approaches will become increasingly important as it is recognized that gene function cannot be assigned without understanding the essential role of biochemical pathway compartmentalization and without the help of classical plant physiology. However, no study directly comparing reproducibility and recovery of the extraction of metabolites
158 using frozen or freeze-dried samples has been published in the context of metabolomic data acquisition. For tissue cultures, a cold shock can be used in which the liquids are infused into cold methanol, and all devices needed for further sample preparation are also kept at low temperatures (Gonzalez et al., 1997). Prior to sample extraction, different types of sample homogenization can be used, depending on the number of samples to be treated, and on the type of tissue. Leaf tissues, for example, can be ground under liquid nitrogen simply using mortar and pestle, or using a ball mill with pre-chilled holders (Fiehn et al., 2000a), or together with the extraction solvent by ultraturrax devices (Orth et al., 1999). Other plant organs such as roots, however, prove sometimes to be too hard to use for ball mills, whereas potato tubers are too soft (Roessner et al., 2000). After homogenization, different methods of metabolite extraction could be used but, again, no systematic study is available that directly compares the results of these techniques. Most frequently, polar organic solvents like methanol, methanol-water mixtures or ethanol are directly added to freshly frozen tissues (Johansen et al., 1996; Streeter and Strimbu, 1998), with an additional step of using non-polar solvents such as chloroform to exhaustively extract lipophilic components. In order to enhance extraction efficiency, additional energy is put into the system either directly by heat (e.g. 70 ◦ C), or by other techniques such as pressurized liquid extraction (Benthin et al., 1999), supercritical fluid extraction (Castioni et al., 1995; Jarvis and Morgan, 1997; Blanch et al., 1999), sonication (Sargenti and Vichnewski, 2000), subcritical water extraction (Gámiz-Gracia and de Castro, 2000), microwave techniques (Namiesnik and Gorecki, 2000), or pervaporation (Starmans and Nijhuis, 1996). Rarely data are available that compare these techniques and, furthermore, few systematic studies have been carried out on the occurrence of possible metabolite breakdown reactions caused, for example, by oxidation (Peng and Jayallemand, 1991). The same holds true for the question of sample storage, although it is generally assumed that alterations of metabolite levels can be excluded during storage at −80 ◦ C.
Data acquisition Metabolite target analysis involves a combination of techniques to prepare and analyse samples for one or a small number of compounds from a complex mixture.
Often, the sample preparation techniques aim at preconcentration and purification of the metabolite under study, before analysing it with a coupling of chromatography and a selective detector (such as liquid chromatography coupled to fluorescence detection, or gas chromatography coupled to sulfur chemiluminescence detection). Metabolite target analysis is clearly the most wide-spread technique, and it is applied in all areas of plant research (such as phytohormone analysis). Since the concept of target analysis is clear, it can be omitted from this review. The focus will be narrowed to a discussion of the concepts and results of multi-target profiling approaches and non-biased data acquisition. Metabolite profiling Through the years many analytical methods have been developed that are not restricted to the selective analysis of one or a few compounds, but to the identification and quantification of multiple targets, with the aim of getting an overview of compound classes. With the improved performance of chromatography methods in the late 1960s and early 1970s (improvements in reliability, robustness, selectivity and resolution), peak identification in complex matrices was made possible based purely on retention times. These separation techniques were then coupled to highly sensitive detectors that also had high dynamic ranges for quantification, such as flame ionization coupled to gas chromatography (GC/FID) or fluorescence and UV detectors coupled to liquid chromatography (LC). These analytical methods were soon applied to urine samples and plant tissues to profile important compound classes such as amino acids (Adams, 1974). The concept of compound identification was extended to retention time indices (Tanaka et al., 1980a) that account for shifts in absolute retention times. In one run, up to 155 organic acids could be detected in order to diagnose human diseases in clinical routine (Tanaka et al., 1980b). Also in the late 1960s, mass spectrometry (MS) was improved to become as universal as flame ionization, with the bonus of offering a completely independent method for compound identification and classification when coupled to gas chromatography (de Jongh et al., 1969). In clinical routine, profiles of organic acids in urine samples could then be used to diagnose fifty different human diseases simultaneously (Jellum et al., 1988). Research in this area is still going on, aiming for a faster, more automated and more reliable categorization of human metabolic
159 disorders by computational constraints (Kimura et al., 1999) or to detect patterns in metabolite profiles of cancer-related tissues by clustering algorithms (Kim et al., 1998). GC/MS analysis of patient tissues was later extended to the simultaneous identification and quantification of several compound classes such as organic acids, polyols, carbohydrates and amino acids (Ning et al., 1996). However, it was also recognized that metabolite identification that was based on mass spectra could be obscured by low signal-to-noise ratios for trace compounds, and by co-elution of major compounds. Halket et al. (1999) utilized mass spectral deconvolution software to increase reliability of metabolite detections. For the first time, peak identification of 68 pre-selected target compounds was based on both purified mass spectra and retention time indices in an automated and robust way, which was applied to the rapid diagnosis of inborn errors by clustering the data acquired with pattern recognition tools. In the plant field, less effort has been put into profiling compound classes. Sauter et al. (1991) chose peaks that apparently represent major compounds in GC/MS chromatograms in order to get an overview of major events in metabolism before and after pesticide spraying. However, identification of minor components such as lysine remained unreliable at that time. Derivatization conditions for metabolite profiling were optimized by selecting 12 compounds representative of plant primary metabolism (Adams et al., 1999), and were applied to profile polar organics (sugars, polyols, acids and amino acids) in apricots (Katona et al., 1999). These techniques were used more systematically to analyse the number of metabolites involved in potato tuber primary metabolism by evaluating recovery rates using spiking experiments and external calibration curves (Roessner et al., 2000). Another step in elucidating metabolism was taken by Christensen and Nielsen (2000), who used GC/MS to profile the fractional enrichment of 13 C-labelled substrates in order to study biochemical pathways. Metabolite profiling was extended to subcellular compartments in potato tubers by combining GC/MS, HPLC analysis of nucleotides, enzyme assays and pyrophosphate target analysis after non-aqueous fractionation (Farré et al., 2001). Such compartmental analysis is clearly needed for understanding plant metabolism. However, as much as 4 g fresh weight of tissue was required for performing a density gradient and enzymatic and metabolite determinations, therefore losing spatial resolution for analysis of individual parts of plant organs.
Not all compounds can be nicely quantified by GC/MS-based profiling methods. Thermolabile or large molecules such as bis- and trisphosphates, CoA adducts or lipids can only be detected after LC separations. For compounds that include double bonds or aromatic substructures, the absorption of UV light can be used. LC/UV profiles of isoprenoids (carotenes, xanthophylls, ubiquinones, tocopherols and plastoquinones) have been used to characterize transgenic and mutant tomato genotypes and for screening Arabidopsis mutants (Fraser et al., 2000). By using arrays of photodiodes, complete UV spectra are acquired at sensitivities capable of producing read-outs with samples as small as 1 ng injected onto the column. Such spectra help identify compounds in complex matrices. However, only extended systems of aromatic rings or conjugated double bonds have UV spectra that are sufficiently specific to allow selecting unique wavelengths for sensitive quantifications in crude plant extracts. Therefore, techniques that are more selective have to be used that take advantage of the unique physical properties of metabolites. In the 1980s several attempts were made to vaporize and to completely evaporate the stream of liquid effluents from LC separations prior to entry into the high vacuum that is needed for MS. However, spray systems like the thermospray or the particle beam interface have shown to be too selective for universal applications like metabolite profiling. With the advent of the electrospray interface in the early 1990s it could be shown that the analytical precision of LC/MS systems was high enough to reliably quantify polyols in cerebrospinal and blood plasma samples. With the use of stable isotope-labelled inositol as an internal reference compound, 8–15% relative standard deviations could be achieved (Shetty et al., 1995). In addition, the application of LC/electrospray MS systems could be successfully demonstrated for the analysis of ceramide profiles. In crude lipophilic extracts from cultured T-cells, detection limits were as low as 25 fmol/µl (Gu et al., 1997). In order gain even better sensitivities, ceramide profiles were first purified by automated multiple development/high-performance thinlayer chromatography (TLC) prior to LC/MS quantification (Raith et al., 2000). Ultimately, highly sensitive metabolite profiles of certain compound classes can be gained after separation by capillary electrophoresis. Que et al. (2000) were able to quantify steroids in the attomolar range when coupled to laser-induced fluorescence detection and in the low femtomolar range when coupled to MS.
160 In pharmaceutical applications, metabolite profiles are not aimed at monitoring the amount of certain pre-defined compound classes, but at determining the catabolic fate of administered drugs. A typical example is the elucidation of the biochemical pathways of propanolol degradation in rats by LC/MS/MS (Beaudry et al., 1999). In other applications, a combination of different techniques is used such as profiling the degradation of linoleic acid in stored apples by GC/MS, LC/MS/MS and LC coupled to radioactivity detection (Beuerle and Schwab, 1999). Next, metabolite profiling of certain pathways was attempted to understand the directions and compartmentalization of metabolite fluxes. By using LC/fluorescence, off-line radioactivity measurements and NMR, such metabolite fluxes were elucidated in maize root tips after application of 13 C- and 14 C-labelled glucose (DieuaideNoubhani et al., 1995). A nice example of how biological functions of metabolites can be assessed with the metabolite profiling method has been shown by Lim et al. (1999) who studied the catabolic fate of tamoxifen, raloxifen and adatanserine by first capturing metabolites by their affinity to bind on specific receptors, then purifying the bound ligands by ultracentrifugation, before characterizing the metabolites by LC/MS. In order to maintain the high throughput required for pharmacological studies, stepwise MS fragmentation studies were automatically carried out by using an ion trap mass spectrometer and 8 min LC run times. Metabolomics It is a big step from profiling a selected number of predefined metabolite targets to the challenges implicit in metabolome-oriented approaches. Metabolomic studies try to avoid biases against certain compound classes by chemical structure or by apparent abundance in the biological tissue. Rather, metabolomic analyses define importance by the relative changes in metabolite abundances in comparative experiments. Therefore, it must be assured that the intensity of any metabolite can directly be compared to the intensity of this metabolite in another sample, independent of matrix effects that are a notorious part of crude extract analysis. This can be achieved by reducing the number of metabolites per time interval that are simultaneously subjected to the data acquisition instrument. One way to do this is to reduce the complexity of extracts by using simple fractionation steps (such as lipophilic/hydrophilic separations), and by separat-
ing metabolites by means of suitable chromatographic methods. As compared to metabolite profiling studies, metabolomic analyses will face the detection of peaks without assigned chemical structures. Therefore, approaches to systematically identify unknown compounds in a high-throughput way are needed. Some approaches can be adopted by classical structure analysis, such as mass spectrometry and nuclear magnetic resonance (NMR). For the de novo identification of secondary plant metabolites, an on-line coupling of LC separation to NMR and MS structure analysis has proved to be very powerful (Wolfender et al., 1998). For GC separations, however, de novo identification strategies are less straightforward. GC separations regularly use chemical derivatization to increase metabolite volatilities. The resulting fragments in mass spectra can be largely dominated by the derivatized groups, afterwards. Secondly, the most straightforward method to elucidate unknown structures is to start with information gained from the intact molecule, such as size and elemental composition. However, electron impact ionization is performed using energies well above the average energy needed to disrupt chemical bonds. The resulting fragmentations are highly characteristic of the chemical structures, allowing mass spectra to be used for identification of known compounds from mass spectra libraries. For the most part, however, ions representing the intact molecular structures are missing, therefore hampering any de novo identification of unknown metabolites. Softer ionization techniques can be used such as chemical ionization, then regularly missing characteristic fragments. Alternatively, derivatization techniques can be applied that result at first in highly abundant fragments that give direct information about the intact molecule (pseudo-molecular ions). Fiehn et al. (2000a) used tertiary butyldimethylsilyl derivatives of polar organics to identify uncommon plant metabolites by looking at the characteristic primary fragments at M-15 (methyl cleavage) and M-57 (tertiary butyl cleavage). A total of 30 compounds were identified de novo by calculating elemental compositions gained from quadrupole mass spectral data, and interrogating chemical and biochemical databases, afterwards. However, this approach was shown only to work for metabolites that have one to four acidic protons, but not for larger molecules such as sugars. Automated procedures are yet to be developed that could tentatively identify unknown peaks by combining the information derived from mass spectral fragmentation patterns, iso-
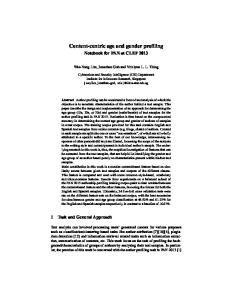
161 tope ratios, exact masses, structure generators and (bio)chemical databases. Apart from metabolite identification problems, true metabolomic approaches need to be able to automatically analyse raw data files in an unbiased way. As pointed out above, such files generally contain information in three dimensions, i.e. chromatographic retention time, characteristics of the physical property of the molecules (e.g. mass spectra), and intensities (to quantify metabolite levels). However, when analysing crude extracts, almost no compounds are eluted as pure peaks, but are obscured by the presence of coeluting metabolites, which may have largely varying intensities in different samples. Therefore, raw data files need to be automatically searched for physical properties that are unique to each metabolite, depending on its neighbouring peaks. Such software has been developed by Stein (1999) for GC/MS files. It finds model ions that best describe the elution profile for a pure compound, and purifies the mass spectrum of this compound from its neighbouring peaks by deconvoluting the overlapping mass spectra. With the purified mass spectra, compound identities are then searched against mass spectral libraries. Halket et al. (1999) have used this software to enhance the reliability of peak identifications in GC/MS runs, but without taking the total number of peaks into account. A first step towards the unbiased analysis of plant GC/MS chromatograms with the aim of functionally characterizing plant mutants was performed by Fiehn et al. (2000b). In Figure 1, such a profile is shown for the lipophilic phase of an Arabidopsis leaf, with over 160 peaks being detectable in the base peak chromatogram. Based on the detection of 326 distinct compounds (ranging from primary polar metabolites to sterols), relative quantifications were carried out for both identified and unidentified compounds, after normalization to internal references and plant tissue fresh weights. Different plant mutants were compared to the corresponding parental genotypic backgrounds, and the data were used for statistical analysis as well as for defining metabolic phenotypes that were derived from clustering tools. However, the analyses still lacked the use of mass spectral deconvolution techniques and, almost certainly, trace peaks were overlooked by this approach. GC/MS analyses were also used for comprehensively studying metabolism in potato tubers (Roessner et al., 2001). In this paper, however, quantitative alterations of only a few unidentified metabolites were taken into account. Cluster analysis of metabolic phenotypes re-
vealed that the metabolic effects in tuber slices of potato mutants could be partially complemented by adding glucose. Another approach to identify gene functions by extended chromatographic analysis was performed by Tweeddale et al. (1998). After growing wild-type and mutant E. coli strains in minimal media and 14 C-labelled glucose, 70 metabolites were separated by two-dimensional TLC (most of them remained unidentified). The relative quantification of metabolites was carried out by radioactivity detection. However, explanations of the observed changes in metabolite pools could only be partly ascribed to the function of the mutated regulatory gene. Whatever the analytical methods used, sample preparation protocols will remain the step that is most prone to errors. Both extraction and analytical data acquisition techniques of metabolomic approaches must compromise between several compound classes and, therefore, cannot be as precise as the more sophisticated processes that are dedicated to metabolite profiling or target analyses. Instead, metabolomic analyses have to be regarded as ‘quick-and-dirty’ methods that try to be as comprehensive and as fast as possible, but that almost certainly will not be ideally suited for precise and reproducible determination of each of its metabolites. Metabolic fingerprinting If rapid classification of sample types is needed, for example for diagnostic purposes, product quality control, or screening of mutant collections, even faster methods can be applied. The general idea behind metabolic fingerprinting is that, even without any chromatographic separation the resolution power of nuclear magnetic resonance, MS or infrared (IR) spectroscopy is still good enough to yield valid information about the net result of metabolic regulation in the biological sample. For example, bacteria species could be classified by pyrolysis-MS (Taylor et al., 1998), but it remained unclear if this classification could be achieved when mixtures of bacteria are analysed. Using a combination of pyrolysis-MS and Fourier transform IR spectrometry, bacteria species have been classified with novel programming tools, and biomarkers were identified that were directly distinguishing these species (Goodacre et al., 2000). Also, with the aim of discrimination between species, Smedsgaard and Frisvad (1996) used direct injection tandem mass spectrometry of crude extracts to distinguish ten different fungal species. Nuclear magnetic
162
Figure 1. Lipophilic phase of Arabidopsis thaliana leaves analysed by GC/quadrupole MS (unpublished results). Inspection of peaks apparent in the base peak chromatogram results in 160 distinct metabolites. Abundant peaks in the middle of the chromatogram are methylated fatty acids. At the end of the chromatogram, trimethylsilylated sterols are eluted.
resonance (NMR) has also been used without prior separation of individual compounds, in order to classify rats that had been dosed with different amounts of various toxins using direct analysis of their dried urine samples (Robertson et al., 2000). Classification was achieved through principal component-analysis (CPA), and toxic effects on rats could be detected at much lower levels compared to visual inspection of the rat phenotypes. NMR analyses were also used to study metabolic effects after administering toxins to earthworms (Warne et al., 2000). The data acquired were evaluated by means PCA and hierarchical clustering. Elevated levels of glucose and the TCA intermediates citrate and succinate were noted as potential biomarkers for toxicity. Such statements, however, had better serve as examples of potential pitfalls of the over-interpretation of metabolic fingerprints since, aside from toxic effects, there are a lot of biological causes of elevated levels of TCA intermediates. NMR was also used for metabolic fingerprints to detect differences between mutated yeast strains (Raamsdonk et al., 2001). It was shown that discriminatory analysis increased the classification power compared to
PCA. However, additional enzymatic analyses were needed to quantify levels of individual metabolites. Gavaghan et al. (2000) used NMR analysis of dried urine samples in order to find biomarkers that classify different sample origins from phenotypically normal mice. Chemometric techniques were included to retrieve information from the raw NMR data, and some differences were found for TCA cycle intermediates and metabolites of the methylamine pathway. In another approach, IR spectroscopy was applied to find differences between fruits of tomato plants that were grown under salinity stress or under normal conditions (Johnson et al., 2000). The application of unsupervised PCA did not reveal clear clusters. However, supervised learning methods (partial least square, artificial neural networks, genetic programming) were able to correctly classify samples after being trained by samples with known classification. It was emphasized that only ‘genetic programming’ (Gilbert et al., 1997) gave interpretable explanations for the route from deconvoluting the raw analytical data to classifying samples. By genetic programming, the authors found nitriles to be the main factor that distinguished
163
Figure 2. Cluster analysis of a hypothetical experiment. Clustering of the samples by principal-component analysis might result in the expected separation of samples from origin A (such as wild-type samples) and from origin B (such as mutant samples). In this example, B samples fall into two sub-groups, B1 and B2 , as indicated by covers (dotted lines).
stressed tomato plants from unstressed plants. Due to the lacking resolving power of IR spectroscopy, however, it remained by necessity unclear if other metabolite classes were also up- or down-regulated in stressed plants. It would be interesting to study such samples by techniques that have higher resolving power. By Fourier-transformed ion cyclotron resonance mass spectrometry (FT-MS), for example, small metabolites could potentially still be distinguished that are only 0.005 Da apart in their accurate masses. Additionally, high mass accuracies could be obtained, which would allow the simultaneous identification of most small metabolites that appear in FT-MS mass spectra. Relative quantifications in comparative experiments, however, might be more prone to error than FT-MS metabolic fingerprinting for two reasons. First, before metabolites reach the mass spectrometer, they need to be ionized. The efficiency of the ionization process of individual metabolites, however, can be severely affected by ion co-suppression caused by matrix effects. Secondly, ion repulsion might occur if too many metabolites are present within the cyclotron simultaneously. Nevertheless, FT-MS or high resolution time-of-flight mass spectrometers might serve as powerful tools for screening mutant collections to identify major alterations in biochemical pathways rapidly.
Data mining The primary objective of metabolomic analysis is to associate the relative changes in quantitative metabolite levels with functional assignments. Mostly, more than subtle effects can be expected from a mutation,
although quite frequently no apparent visible phenotype can be observed. To test this starting hypothesis, the first and most important question to answer is whether or not the data acquired can be grouped according to the design of the comparative experiment, i.e. if the samples clearly fall into clusters according to the sample origins (healthy/diseased, stressed/nonstressed, mutant/wild type, and so on). If this is not the case, the data acquisition might have been obscured by either sample preparation faults or low analytical precision during data acquisition. Eventually, subtle mutations that result in silent phenotypes might not render a clear clustering result by any common means such as principal component analysis (Fiehn et al., 2000b; Roessner et al., 2001) or discriminatory analysis (Raamsdonk et al., 2001). For such cases, further methods need to be developed that unravel potential differences between the populations being studied. In case cluster analysis results in clear patterns, it has to be tested if any subgroups can be seen within the corresponding major clusters that might be related to distinct processes within the experimental set-up, or the sample processing and data acquisition. For example, clusters could be related to the individual trays if two trays of wild-type plants were to be compared to two trays of mutant plants, or clusters could be found according to the date of data acquisition, indicating systematic errors within the analytical instruments. There is no accurate threshold value for defining clusters, but one can be guided by visual interpretation of clustering results. In Figure 2, the potential outcome of PCA is exemplified for a hypothetical experiment. Samples that originated from type A are clearly separated from samples of type B; however, within B there are visible sub-clusters of B1 and B2 . Once such sub-clusters are clearly observed, B can no longer be regarded as one population. Such a finding would render the experimental results artefactual if the underlying causes of clustering cannot be assigned (such as alterations in the conditions for B1 and B2 , that were present during sample generation or data acquisition). Once the existence of clusters within the samples is assured, classical statistics such as Student’s t test or multiple analysis of variance (MANOVA) can be applied in order to find statistically significant differences of metabolite levels between the clusters. Interestingly, ap Rees and Hill (1994) also stress the importance of sound statistical approaches for protein quantifications, since large biological variations (20–40% RSD) are found for concentrations of important plant enzymes, such
164 as PEP carboxylase, pyruvate kinase and PEP phosphatase. Numerous software packages exist that assist the application of statistical tests but, whenever possible, experienced statisticians should be consulted to question the validity of the approaches chosen. Specifically, the independence of sample generation has to be critically evaluated. For example, if three leaves from each of six plants were harvested and analysed, this does not add up to 18 independent samples, since the leaves originated from only six plants. Further, if, for example, 30 independent samples were pooled into six groups before data acquisition (which might be needed to reduce costs or analytical run times), the results may only be treated as 30 independent observations if any influence of the analytical process can be excluded. This might be important for the evaluation of the accuracy of the mean (using the standard error instead of the standard deviation), which is allowed by the centre limit theorem starting at N = 30. For results gained from mRNA quantification, however, errors produced by the analytical procedure have definitely to be taken into account, since precisely reproducible hybridisation experiments are difficult to obtain (Vingron and Hoheisel, 1999). Even for metabolite profiling results, this hypothesis is questionable since the analytical process does not only include the data acquisition part, but also sample extraction and preparation parts, where significant errors may have occurred. The next question is, do any relationships between the variables exist? Again, practitioners of metabolome analysis might learn from approaches of mRNA expression experiments, which have been summarized in recent reviews (Bittner et al., 1999; Brazma and Vilo, 2000). Often, analysis follows the paradigm that variables (e.g. genes) of similar functions cluster together, and they share common roles in cellular processes (Eisen, 1998). Recently, the robustness of clustering algorithms have been improved by computing the optimal number of clusters in arbitrary gene expression data sets (Lukashin and Fuchs, 2001). When compared to known classifications, 90% of the genes from a yeast cell cycle data set were correctly grouped into the corresponding clusters. However, non-trivial results may also be obtained if rule-based learning methods are applied. Gilbert et al. (2000) have shown how new biological hypotheses can be obtained from re-analysis of data that are deposited in publicly accessible data banks. Instead of clustering data according to similarities of abundance, variables in gene expression data sets can be correlated in a more rigorous statistical way in direct pair-wise comparisons. Butte
and Kohane (2000) have applied entropy measurements on a data set of 79 measurements of 2467 yeast genes to calculate the inherent mutual information and to visualize the resulting gene-gene correlation networks by graphs instead of phylogenetic-type trees. Graph tools have been developed in order to visualize biochemical pathways by edges and nodes that are automatically structured in the forms of metabolic cycles and hierarchies (Becker and Rojas, 2001). However, the information power of graph visualization rapidly decreases with increasing total numbers of edges and nodes. In a study on pairwise metabolitemetabolite correlations in a metabolomic data set, 1.5% of all theoretical correlations could be found as linear relationships (Kose et al., 2001). In order to maintain the structural information inherent in the resulting metabolic networks, graph visualization was performed in clique-metabolite matrices instead of using edges and nodes. It was shown that closed subgraphs, isolated groups and missing edges can easily be found by computing cliques.
Metabolic modelling Once metabolomic data have been acquired and analysed by data mining tools, they need to be interpreted. One way to do so is to intercalate biochemical pathways, whether or not the alterations of metabolite levels or clustering results can be understood by known aspects of enzymatic regulation. Ogata et al. (1999) have described in detail the publicly available genomic KEGG database that includes links to the encoded enzymatic pathways. Another approach to understanding metabolic phenotypes could be a comparison of predictions suggested by theoretical considerations. Three different existing approaches might be used to predict the metabolic effects of genetic alterations: first, calculations based on metabolic flux measurements; second, calculations of metabolic feasibility spaces using knowledge of metabolic stoichiometries of enzymatic reactions; and third, calculations based on enzyme kinetics. In the following sections, the first two approaches will be reviewed and compared as to their potential use for understanding metabolomic data sets. Modelling based on metabolic flux measurements For decades researchers have tried to understand the cellular regulation of metabolism by experimentally
165 determining absolute and relative fluxes through biochemical pathways, either in order to understand the control that is held by individual enzymes of a pathway (metabolic control analysis, MCA), or in order to determine the relative impact of bi-directional reactions in branched networks (metabolite balancing). In MCA, the response of a biological system on incremental changes of system parameters is determined, in order to gain quantitative knowledge of the fractional control of flux that is held by all the enzymes of a selected pathway. The theory of MCA was introduced by Kacser and Burns (1973, reprinted with additional comments in 1995) and Heinrich and Rapoport (1974). Developments in both theory and practical applications have been comprehensively reviewed in an excellent book by David Fell (1997), emphasizing the replacement of the bottleneck or pacemaker theory of enzymatic control through the more appropriate quantitative description of the control that is shared by all the enzymes of a pathway in a distinct biological situation. The importance of this change in paradigm cannot be overestimated, especially for molecular biologists who try to metabolically engineer plants by altering the gene expression level of a single encoded enzyme. Despite its sound theoretical basis and successful practical applications (Groen et al., 1986; Giersch, 1995; Krauss and Quant, 1996; Thomas et al., 1997; Poolman et al., 2000), MCA is still not a regular tool in plant studies. Potential reasons for this may be found in practical difficulties that researchers encounter who try to determine and to utilize MCA control coefficients, which have been summarized by ap Rees and Hill (1994). At the bottom line of MCA, in vivo metabolite fluxes are determined in response to changes of system parameters (e.g. by altering enzyme activities using inhibitor titrations). These measurements have then to be accompanied by determining either the maximum catalytic activities enzymes, or assessing absolute metabolite concentrations. None of these measurements is easy to be accomplished. With respect to flux measurements, either a certain substrate is added, and the rate of product accumulation is measured, or the distribution of a labelled substrate is followed through a metabolic pathway. Since the uptake of the added substrates must be ensured, flux measurements are more easily carried out in cell cultures than in whole plants. Even if isolated plant organs are used, MCA studies are best performed for short, unbranched chains of enzymatic reactions since plant metabolic pathways are both highly branched and compartmentalized. Kell
and Mendes (2000) made several critical remarks on further limitations of metabolic control analysis, for example that predictions based on metabolic control analysis only hold true if changes in enzymatic activities are small. This underlying paradigm is definitely not valid, however, when knockout mutants or plants over-expressing or under-expressing a gene are analysed. Drastically altering an enzymatic control coefficient will not only change its own control over flux, but also all other control coefficients. Therefore, it is generally concluded that the activities of several enzymes must be altered in biotechnological applications. Unfortunately, moving metabolic fluxes to unproductive pathways is more likely than to stimulating the flux through the desired pathway (Trethewey, 1998). Furthermore, pathways may not be as well conserved as textbooks suggest. Paralogues (enzymes with high sequence homology in different organisms) may well serve different biochemical functions or even have different cellular roles. Finally, enzyme activities determined by in vitro assays may be quite different from in vivo situations, where even the basic assumption of metabolic control analysis, the independent action of enzymes, may not hold true. Instead, it has been assumed for a number of biochemical pathways that enzymes work in a tightly coordinated manner and in closely connected enzymatic complexes, so-called metabolons (Srere, 1985). This mechanism results in channelling metabolites through metabolic pathways rather than in making substrates available for several competing enzymes in a diffusion-controlled manner. This hypothesis is difficult to prove experimentally because enzymes tend to dissociate during isolation and dilution. However, fusion proteins of the tricarboxylic acid (TCA) cycle have been immobilized that show possible kinetic advantages of such metabolons (Velot et al., 1997). In this study, computer modelling has also shown that substantially interacting surface areas stabilize the TCA metabolon thermodynamically. Although several of these constraints might be solvable by expanding the current state of MCA theory (Fell, 1997), metabolomic data sets of relative regulation of metabolites rather than determining absolute concentrations yet do not seem to be directly applicable to MCA. Instead of trying to expand metabolomic data acquisition to determination of absolute concentrations, the use of relative quantifications can also be justified by theoretical background. As early as 1963 it was proposed that calculating ratios of steadystate metabolite levels would give a better indication for flux changes in metabolic pathways, since the
166 quotient becomes dimensionless and could readily be used for assessing homeostasis of metabolism (Bücher and Rüssmann, 1963). However, it took as long as the 1990s before Hofmeyr extended metabolic control analysis to quotients of metabolite levels by defining co-response coefficients (Hofmeyr et al., 1993, 1995; Hofmeyr, 1995) although it might still be best applicable to fairly simple and unbranched systems (Cornish-Bowden and Hofmeyr, 1994). Still, all calculations of co-response coefficients are performed on averages of steady-state metabolite quantifications (see Raamsdonk et al., 2001). Only recently, the idea of taking advantage of the biological variability inherent in metabolic snapshots was taken one step further. Instead of losing information in the process of averaging metabolite levels, each metabolite profile represents a true and valid response of metabolism upon subtle (but unknown) changes in parameters of the system. By computing correlation coefficients of metabolite-metabolite plots, the detection of homeostatic regulation of metabolite ratios could be set onto a more rigid statistical basis (Arkin et al., 1997; Roessner et al., 2001; Kose et al., 2001). A computation of metabolic models based on a combination of co-response MCA theory and experimentally detected metabolomic correlations, however, remains to be shown. As pointed out above, the use of labelled over unlabelled substrates is advantageous for flux measurement (and may also be applied in metabolomic analysis). A further rationale for the use of labelled compounds is that net fluxes can be obscured by the bi-directionality of enzyme reactions. In a rationale making use of this bi-directionality, the fractional impact of (branched) pathways leading to biosynthesis of the investigated metabolites can be calculated by determining the steady-state distribution of labelled atoms. This method is called ‘metabolic balancing’. In practice, isotope labelling in metabolic balancing is often performed by growing a culture on 13 Cglucose and making time-dependent measurements of the flux of incorporated 13 C by NMR or (less frequently) MS (Szyperski, 1998). If NMR fine structures of 13 C-enriched metabolic intermediates are studied, the analysis of the position of the incorporated 13 C atoms enables mathematical modelling of the contribution of different pathways to the metabolic cycles (Schmidt et al., 1997; Klapa et al., 1999; Parket al., 1999). All these authors emphasized that NMR analyses proved to be more powerful compared to MSbased approaches, since it is much more difficult (and sometimes impossible) to obtain positional informa-
tion of the incorporated 13 C atoms from interpretation of mass spectral fragmentation. However, it was also emphasized that MS applications are more rapid and can also be utilized to obtain isotopomer information (Dauner and Sauer, 2000) when matrix corrections are carried out for natural isotope abundance. In a series of papers, Wiechert et al. (1997a, b, 1999) and Möllney et al. (1999) developed a generalized mathematical model to describe the bi-directional flow of metabolites in small metabolic networks after 13 C labelling. Different numerical approaches have been developed to transform the interpretation problem of NMR data by statistical analysis (such as covariance matrices) in order to determine the order of magnitude of exchange fluxes in practical situations. Finally, Möllney et al. (1999) compared the results of the generalized models for data that have been gained by either NMR or MS. This work demonstrated that information provided by isotopic fractional enrichments (the fraction of totally incorporated 13 C into a molecule, i.e. isotopic ratios) can be as valuable as positional information. Both methods were evaluated for their appropriateness for use in metabolic engineering (Christensen and Nielsen, 1999), emphasizing the importance of gaining information on relative directions and relative intensities of metabolite fluxes using positional isotope enrichments. These authors also pointed out that, based on enzyme stoichiometric considerations (see below), there is a need for information on absolute flux constraints, such as the availability of NADPH and other energy-related metabolites. Yet, no metabolomic analysis of steady-state distribution of labelled atoms has been undertaken in order to analyse the relative impact of branched pathways in large metabolic networks on individual metabolite levels. However, such an experiment would pose both practical and theoretical challenges that seem to be difficult to be met in the near future. Neither MCA nor metabolic balancing make explicit use of kinetic information. Mendes and Kell (1998) developed a software tool in order to simulate the behaviour of metabolic pathways by optimizing parameters in kinetic models. In agreement with Christensen and Nielsen (1999), these authors emphasize that levels of important metabolites (such as NADPH) cannot be assumed to be constant, or every extrapolation to situations outside the standard environments would become meaningless. However, an extensive survey of the use of kinetic data for prediction of metabolic systems is beyond the scope of this
167 review, which aims at exploring practice and potential applications of metabolomic analysis. Modelling based on biochemical stoichiometry The use of classical MCA approaches to understand large metabolic networks may therefore be limited. Furthermore, mathematical models have so far only been applied to relatively small parts of plant metabolism (Gombert and Nielsen, 1999), and the paradigm of steady-state conditions that forms another basis of metabolic control analysis is also questionable (Giersch, 2000). In order to build models for large biochemical networks, some further simplifications have to be carried out, such as using matrix calculations of overall substrate-product stoichiometry (Kholodenko et al., 1995). Cornish-Bowden and Eisenthal (2000) emphasized the importance of the reliability of stoichiometric ratios when used for computer simulations and demonstrated that with such calculations, new links or non-obvious links in biochemical pathways could be found. In two excellent break-through papers by Edwards and co-workers (Edwards and Palsson, 2000; Edwards et al., 2001) it was shown that predictions based purely on stoichiometry metabolic matrices could be demonstrated by growth rate data from Escherichia coli mutants. In 86% of the cases studied, the effects of gene knockouts in E. coli could be shown correctly by growth rate data of E. coli mutants reported in the literature. In a series of related papers, Pfeiffer et al. (1999), Schuster (1999) and Schuster et al. (1999, 2000) described the concept of elementary flux mode. Biochemical pathways were rationalized into thermodynamically and stoichiometrically feasible subsets of enzymes that each generate valid steady states. This approach does not require information on enzyme activities or enzyme kinetics, and the results must therefore remain qualitative. However, this approach gives a solid basis for definitions of biochemical pathways, which are otherwise more likely to be defined by biochemical interpretations than by direct biological feasibility. Another approach to determine metabolic pathways was taken by Goryanin et al. (1999) who attempted to optimize parameters and fit experimental data sets to stoichiometric assumptions that are retrieved from biochemical and genomic databases. Certainly, such models will lack predictive power since the objective is only to calculate if metabolite fluxes are feasible or non-feasible, without detailed knowledge indicating the likelihood that the required fluxes could also be achieved in prac-
tice. However, the idea of trying to accurately predict the behaviour of metabolic networks has also been attacked from a completely different scientific direction. It has been proposed that biological systems in general might be hard to predict, since a lot of regulatory systems are forming closed circuits, which might only be stable when oscillating between two (or more) different states allowed (Bersini and Calenbuhr, 1997), and the existence of two steady states has also been shown for the photosynthetic Calvin cycle (Poolman et al., 2001). Therefore, even further simplifications might be considered when analysing metabolic networks. One approach was considered by Fell and Wagner (2000), who suggested the use of graphical visualization of metabolite-metabolite interactions (derived from known enzymatic conversions) using the powerlaw connectivity theorem. When analysing E. coli metabolism, glutamate was found to be the central metabolite, and the authors found this as an indication for potential uses in evolutionary studies. By similar theoretical considerations, Barabási and co-workers have shown that metabolic networks are organized in a scale-free manner, indicating a high robustness against random errors (e.g. mutations) but a high vulnerability to directed attacks (Albert et al., 2000; Jeong et al., 2000).
Conclusions Metabolomic analyses have just begun. With today’s powerful analytical and computational systems, the experimental outcome of systematic changes to plant systems can be followed in a comprehensive way. However, the combination of analytical results from all levels of gene products (transcriptome, proteome, and metabolome) remains more vision than reality. Even though metabolomic analysis is comparably fast and cheap, reliable and precise, the unambiguous and simultaneous identification of all metabolites in a biological system is a challenge. The ultimate goal is to understand and to predict the behaviour of complex systems (such as plants) by using the results obtained from data mining tools for subsequent modelling and simulation. Theoretically, it should be possible to link metabolomic changes in biochemical pathways to the enzymes involved, and then to the underlying genetic alterations. So far, such results have not been published, and current approaches to data mining and mathematical modelling are not prepared to compute metabolomic data. It is not clear how mod-
168 els derived from metabolic control analyses can be improved to utilize metabolite data from a number of metabolic snapshots rather than from 13 C-flux analysis, or if the power of stoichiometric models can be enhanced to make use of experimentally determined metabolite-metabolite ratios. Finally, if metabolomic profiling is to be used to its fullest, it is imperative that publicly available metabolomic databases be created. Metabolomic data are rich in information, and there is considerable interest in re-assessing previously acquired data under different perspectives.
Acknowledgements I would like to thank Megan McKenzie for carefully editing the manuscript.
References Adams, R.F. 1974. Determination of amino acid profiles in biological samples by gas chromatography. J. Chromatogr. 95: 189-212. Adams, M.A., Chen, Z.L., Landman, P. and Colmer, D. 1999. Simultaneous determination by capillary gas chromatography of organic acids, sugars, and sugar alcohols in plant tissue extracts as their trimethylsilyl derivatives. Anal. Biochem. 266: 77–84. Albert, R., Jeong, H. and Barabási, A.-L. 2000. Error and attack tolerance of complex networks. Nature 406: 378–381. Arabidopsis Genome Initiative. 2000. Analysis of the genome sequence of the flowering plant Arabidopsis thaliana. Nature 408: 796–815. Arkin, A., Shen, P. and Ross, J. 1997. A test case of correlation metric construction of a reaction pathway from measurements. Science 277: 1275–1279. ap Rees, T. and Hill, S.A. 1994. Metabolic control analysis of plant metabolism. Plant Cell Envir. 17: 587–599. Beaudry, F., Le Blanc, J.C.Y., Coutu, M., Ramier, I., Moreau, J.P. and Brown N.K. 1999. Metabolite profiling study of propranolol in rat using LC/MS/MS analysis. Biomed. Chromatogr. 13: 363– 369. Becker, M.Y. and Rojas, I. 2001. A graph layout algorithm for drawing metabolic pathways. Bioinformatics 17: 461–467. Benthin, B., Danz, H. and Hamburger, M. 1999. Pressurized liquid extraction of medicinal plants. J. Chromatogr. A 837: 211–219. Bersini, H. and Calenbuhr, V. 1997. Frustrated chaos in biological networks. J. Theor. Biol. 188: 187–200. Beuerle, T. and Schwab, W. 1999. Metabolic profile of linoleic acid stored in apples: formation of 13(R)-hydroxy-9(Z),11(E)octadecadienoic acid. Lipids 34: 375–380. Bittner, M., Meltzer, P. and Trent, J. 1999. Data analysis and integration: of steps and arrows. Nature Genet. 22: 213–215. Blanch, G.P., Caja, M.M., del Castillo, M.L.R., Santa-Mariá, G. and Herraiz, M. 1999. Fractionation of plant extracts by supercritical fluid extraction and direct introduction in capillary gas chromatography using a programmable temperature vaporizer. J. Chromatogr. Sci. 37: 407–410.
Bouchereau, A., Guénot, P. and Larher, F. 2000. Analysis of amines in plant materials. J. Chromatogr. B 747: 49–67. Brazma, A. and Vilo, J. 2000. Gene expression data analysis. FEBS Lett. 480: 17–24. Bücher, T. and Rüssmann, W. 1963. Gleichgewicht und Ungleichgewicht im System der Glykolyse. Angew. Chem. 75: 881–948. Butte, A.J. and Kohane, I.S. 2000. Mutual information relevance networks: functional genomic clustering using pairwise entropy measurements. Pac. Symp. Biocomput. 5: 427–439. Castioni, P., Christen, P. and Veuthey J.L. 1995. Supercritical fluid extraction of compounds from plant origin. Analusis 23: 95–106. Christensen, B. and Nielsen, J. 1999. Metabolic network analysis: a powerful tool in metabolic engineering. In: T. Scheper (Ed.) Advances in Biochemical Engineering and Biotechnology, Springer-Verlag, Berlin, pp. 210–231. Christensen, B. and Nielsen, J. 2000. Metabolic network analysis of Penicillium chysogenum using 13 C-labelled glucose. Biotechnol. Bioeng. 68: 652–659. Cornish-Bowden, A. and Cárdenas, M.L. 2000. From genome to cellular phenotype: a role for metabolic flux analysis? Nature Biotechnol. 18: 267–268. Cornish-Bowden, A. and Eisenthal, R. 2000. Computer simulations as a tool for studying metabolism and drug design. In: A.J. Cornish-Bowden and M.L. Cárdenas (Eds.) Technological and Medical Implications of Metabolic Control Analysis, Kluwer Academic Publishers, Dordrecht, Netherlands, pp. 165–172. Cornish-Bowden, A. and Hofmeyr, J.-H.S. 1994. Determination of control coefficients in intact metabolic systems. Biochem. J. 298: 367–375. Dauner, M. and Sauer, U. 2000. GC-MS analysis of amino acids rapidly provides rich information for isotopomer balancing. Biotechnol. Progr. 16: 642–649. de Jongh, D.C., Radford, T., Hribar, J.D., Hanessian, S., Bieber, M., Dawson, G. and Sweeley, C.C. 1969. Analysis of trimethylsilyl derivatives of carbohydrates by gas chromatography and mass spectrometry. J. Am. Chem. Soc. 91: 1728–1740. Dieuaide-Noubhani, M., Raffard, G., Canioni, P., Pradett, A. and Raymond, P. 1995. Quantification of compartmented metabolic fluxes in maize root tips using isotope distribution from 13 C- or 14 C-labeled glucose. J. Biol. Chem. 22: 13147–13159. Edwards, J.S. and Palsson, B.O. 2000. The Escherichia coli MG 1655 in silico metabolic genotype: its definition, characteristics, and capabilities. Proc. Natl. Acad. Sci. USA 97: 5528–5533. Edwards, J.S., Ibarra, R.U. and Palsson, B.O. 2001. In silico predictions of Escherichia coli metabolic capabilities are consistent with experimental data. Nature Biotechnol. 19: 125–130. Eisen, M.B., Spellmann, P.T., Brown, P.O. and Botstein, D. 1998. Cluster analysis & display of genome-wide expression patterns. Proc. Natl. Acad. Sci. USA 95: 14863–14868. Farré, E.M., Tiessen, A., Roessner, U., Geigenberger, P., Trethewey, R.N. and Willmitzer, L. 2001. Analysis of the compartmentation of glycolytic intermediates, nucleotides, sugars, organic acids, amino acids and sugar alcohols in potato tubers using a non-aqueous fractionation method. Plant Physiol., in press. Fell, D.A. 1997. Understanding the control of metabolism. Snell (ed.) Portland Press, London. Portland Press Frontiers in metabolism 2: 301 pp. Fell, D.A., Wagner, A. 2000. The small world of metabolism. Nature Biotechnol. 18: 1121–1122. Fiehn, O., Kloska, K. and Altmann, T. 2001. Integrated studies on plant biology using multiparallel techniques. Curr. Opin. Biotechnol. 12: 82–86.
169 Fiehn, O., Kopka, J., Trethewey, R.N. and Willmitzer, L. 2000a. Identification of uncommon plant metabolites based on calculation of elemental compositions using gas chromatography and quadrupole mass spectrometry. Anal. Chem. 72: 3573–3580. Fiehn, O., Kopka, J., Dörmann, P., Altmann, T., Trethewey, R.N. and Willmitzer, L. 2000b. Metabolite profiling for plant functional genomics. Nature Biotechnol. 18: 1157–1161. Fraser, P.D., Pinto, M.E.S., Holloway, D.E. and Bramley, P.M. 2000. Application of high-performance liquid chromatography with photodiode array detection to the metabolic profiling of plant isoprenoids. Plant J. 24: 551–558. Gámiz-Gracia, L. and de Castro, M.D.L. 2000. Continuous subcritical water extraction of medicinal plant essential oil: comparison with conventional techniques. Talanta 51: 1179–1185. Gavaghan, C.L., Holmes, E., Lenz, E., Wilson, I.D., Nicholson, J.K.. 2000. An NMR-based metabonomic approach to investigate the biochemical consequences of genetic strain differences: application to the C57BL10J and Alpk:ApfCD mouse. FEBS Lett. 484: 169–174. Gerhardt, R. and Heldt, H.W. 1984. Measurement of subcellular metabolite levels in leaves by fractionation of freeze-stopped material in nonaqueous media. Plant Physiol. 75: 542–547. Giddings, G., Allison, G., Brooks, D. and Carter, A 2000. Transgenic plants as factories for biopharmaceuticals. Nature Biotechnol. 18: 1151–1155. Giersch, C. 1995. Determining elasticities from multiple measurements of flux rates and metabolite concentrations: application of the multiple modulation method to a reconstituted pathway. Eur. J. Biochem. 227: 194–201. Giersch, C. 2000. Mathematical modelling of metabolism. Curr. Opin. Plant Biol. 2: 249–253. Gilbert, R.J., Goodacre, R., Woodward, A.M. and Kell, D.B. 1997. Genetic programming: a novel method for the quantitative analysis of pyrolysis mass spectral data. Anal. Chem. 69: 4381–4389. Gilbert, R.J., Rowland, J.J. and Kell, D.B. 2000. Genomic computing: explanatory modelling for functional genomics. In: D. Whitley, D. Goldberg and E. Cantú-Paz (Eds.) Proceedings of the Genetic and Evolutionary Computation Conference, Morgan Kaufman, San Francisco, pp. 551–557. Gombert, A.K. and Nielsen, J. 1999. Mathematical modelling of metabolism. Curr. Opin. Biotechnol. 11: 180–186. Gonzalez, B., Francois, J. and Renaud, M. 1997. A rapid and reliable method for metabolite extraction in yeast using boiling buffered ethanol. Yeast 13: 1347–1356. Goodacre, R., Shann, B., Gilbert, R.J., Timmings, E.M., McGovern, A.C., Alsberg, B.K., Kell, D.B. and Logan NA. 2000. Detection of the dipicolinic acid biomarker in Bacillus spores using Curiepoint pyrolysis mass spectrometry and Fourier transform infrared spectroscopy. Anal. Chem. 72: 119–127. Goryanin, I., Hodgman, T.C. and Selkov, E. 1999. Mathematical simulation and analysis of cellular metabolism and regulation. Bioinformatics 15: 749–758. Groen, A.K., van Roermund, C.W.T., Vervoorn, R.C. and Tager, J.M. 1986. Control of gluconeogenesis in rat liver cells: flux control coefficients of the enzymes in the gluconeogenic pathway in the absence and presence of glucagon. Biochem. J. 237: 379–389. Gu, M., Kerwin, J.L., Watts, J.D. and Aebersold, R. 1997. Ceramide profiling of complex lipid mixtures by electrospray ionisation mass spectrometry. Anal. Biochem. 24: 347–356. Halket, J.M., Przyborowska, A., Stein, S.E., Mallard, W.G., Down, S. and Chalmers, R.A. 1999. Deconvolution gas chromatography mass spectrometry of urinary organic acids. Potential for pattern
recognition and automated identification of metabolic disorders. Rapid Commun. Mass Spectrom. 13: 279–284. Heinrich, R. and Rapoport, T.A. 1974. A linear steady-state treatment of enzymatic chains. General properties, control and effector strength. Eur. J. Biochem. 42: 89–95. Hofmeyr, J.-H.S. 1995. Metabolic regulation: a control analytic perspective. J. Bioenerget. Biomembr. 27: 479–490. Hofmeyr, J.-H.S. and Cornish-Bowden, A. 1995. Strategies for manipulating metabolic fluxes in biotechnology. Bioorg. Chem. 23: 439–449. Hofmeyr, J.-H.S., Cornish-Bowden, A. and Rohwer, J.M. 1993. Taking enzyme kinetics out of control; putting control into regulation. Eur. J. Biochem. 212: 833–837. Jarvis, A.P. and Morgan, E.D. 1997. Isolation of plant products by supercritical fluid extraction. Phytochem. Anal. 8: 217–222. Jeong, H., Tombor, B., Albert, R., Oltvai, Z.N. and Barabási, A.L. 2000. The large-scale organization of metabolic networks. Nature 407: 651–654. Jellum, E., Kvittingen, E.A. and Stokke, O. 1988. Mass spectrometry in diagnosis of metabolic disorders. Biomed. Environ. Mass Spectrom. 16: 57–62. Johansen, H.N., Glitso, V. and Knudsen, K.E.B. 1996. Influence of extraction solvent and temperature on the quantitative determination of oligosaccharides from plant materials by high performance liquid chromatography. J. Agric. Food Chem. 44: 1470–1474. Johnson, H.E., Gilbert, R.J., Winson, M.K., Goodacre, R., Smith, A.R., Rowland, J.J., Hall, M.A. and Kell, D.B. 2000. Explanatory analysis of the metabolome using genetic programming of simple, interpretable rules. Genet. Program Evolv. Mach. 1: 243–258. Kacser, H. and Burns, J.A.. 1973. The control of flux. Symp. Soc. Exp. Biol. 27: 65–105. Reprinted in 1995 in Biochem. Soc. Trans. 23: 341–366. Katona, Z.F., Sass, P. and Molnár-Perl, I. 1999. Simultaneous determination of sugars, sugar alcohols, acids and amino acids in apricots by gas chromatography-mass spectrometry. J. Chromatogr. A 847: 91–102. KEGG. http://www.genome.ad.jp/kegg/ Kell, D.B. and Mendes, P. 2000. Snapshots of systems. In: A.J. Cornish-Bowden and M.L. Cárdenas (Eds.) Technological and Medical Implications of Metabolic Control Analysis, Kluwer Academic Publishers, Dordrecht, Netherlands, pp. 3–25. Kholodenko, B.N., Schuster, S., Rohwer, J.M., Cascante, M. and Westerhoff, H.V. 1995. Composite control of cell function: metabolic pathways behaving as single control units. FEBS Lett. 368: 1–4. Kim, K.-R., Park, H.-G., Paik, M.-J., Ryu, H.-S., Oh, K.S., Myung, S.-W. and Liebich, H.M. 1998. Gas chromatographic profiling of urinary organic acids from uterine myoma patients and cervical cancer patients. J. Chromatogr. B 712: 11–22. Kimura, H., Yamamoto, T. and Seiji, Y. 1999. Automated metabolic profiling and interpretation of GC/MS data for organic academia screening: a personal computer-based system. Tohuku J. Exp. Med. 188: 317–344. Klapa, M.I., Park, S.M., Sinskey, A.J. and Stephanopoulos, G. 1999. Metabolite and isotopomer balancing in the analysis of metabolic cycles. I. Theory. Biotechnol. Bioeng. 62: 375–391. Kose, F., Weckwerth, W., Linke, T. and Fiehn, O. 2001. Visualising plant metabolomic correlation networks using clique-metabolite matrices. Bioinformatics, in press. Krauss, S. and Quant, P.A. 1996. Regulation and control in complex, dynamic metabolic systems: experimental application of
170 the top-down approaches of metabolic control analysis to fatty acid oxidation and ketogenesis. J. Theor. Biol. 182: 381–388. Lim, H.K., Stellingwerf, S., Sisenwine, S. and Chan, K.W. 1999. Rapid drug metabolite profiling using fast liquid chromatography, automated multiple-stage mass spectrometry and receptor-binding. J. Chromatogr. A 831: 227–241. Lukashin, A.V. and Fuchs, R. 2001. Analysis of temporal gene expression profiles: clustering by simulated annealing and determining the optimal number of clusters. Bioinformatics 17: 405–414. Mendes, P. and Kell, D.B. 1998. Non-linear optimization of biochemical pathways: applications to metabolic engineering and parameter estimation. Bioinformatics 14: 869–883. Möllney, M., Wiechert, W., Kownatzki, D. and de Graaf, A.A. 1999. Bidirectional reaction steps in metabolic networks. IV. Optimal design of isotopomer labelling experiments. Biotechnol. Bioeng. 66: 86–103. Namiesnik, J. and Gorecki, T. 2000. Sample preparation for chromatographic analysis of plant material. J. Plan. Chromatogr. 13: 404–413. Ning, C., Kuhara, T., Inoue, Y., Zhang, C.H., Matsumoto, M., Shinka, T., Furumoto, T., Yokota, K. and Matsumoto. I. 1996. Gas chromatographic mass spectrometric metabolic profiling of patients with fatal infantile mitochondrial myopathy with de Toni-Fanconi-Debre syndrome. Acta Paed. Japon. 38: 661–666. Ogata, H., Goto, S., Sato, K., Fujibuchi, W., Bono, H. and Kanehisa, M. 1999. KEGG: Kyoto encyclopedia of genes and genomes. Nucl. Acids Res. 27: 29–34. Oliver, S.G., Winson, M.K., Kell, D.B. and Baganz, R. 1998. Systematic functional analysis of the yeast genome. Trends Biotechnol. 16: 373–378. Ong, E.-S., Woo, S.-O. and Yong, Y.-L. 2000. Pressurized liquid extraction of berberine and aristolochic acids in medicinal plants. J. Chromatogr. A 313: 57–64. Orth, H.C.J., Rentel, C. and Schmidt, P.C. 1999. Isolation, purity analysis and stability of hyperforin as a standard material from Hypericum perforatum L. J. Pharm. Pharmcol. 51: 193–200. Park, S.M., Klapa, M.I., Sinskey, A.J. and Stephanopoulos, G. 1999. Metabolite and isotopomer balancing in the analysis of metabolic cycles. II. Applications. Biotechnol. Bioeng. 62: 392–401. Peng, S. and Jayallemand, C. 1991. Use of antioxidants in extraction of tannins from walnut plants. J. Chem. Ecol. 17: 887–895. Pfeiffer, T., Sánchez-Valdenebro, I., Nuno, J.C., Montero, F. and Schuster, S. 1999. Metatool: for studying metabolic networks. Bioinformatics 15: 251–257. Poolman, M.G., Fell, D.A. and Thomas, S. 2000. Modelling photosynthesis and its control. J. Exp. Bot. 51: 319–328. Poolman, M..G., Ölcer, H., Lloyd, J.C., Raines, C.A. and Fell, D.A. 2001. Computer modelling and experimental evidence for two steady-states in the photosynthetic Calvin cycle. Eur. J. Biochem. 368: 2810–2816. Que, A.M., Palm, A., Baker, A.G. and Novotny, M.V. 2000. Steroid profiles determined by capillary electrochromatography, laser-induced fluorescence detection and electrospray-mass spectrometry. J. Chromatogr. A 887: 379–391. Raamsdonk, L.M., Teusink, B., Broadhurst, D., Zhang, N., Hayes, A., Walsh, M.C., Berden, J.A., Brindle, K.M., Kell, D.B., Rowland, J.J., Westerhoff, H.V., van Dam, K. and Oliver, S.G. 2001. A functional genomics strategy that uses metabolome data to reveal the phenotype of silent mutations. Nature Biotechnol. 19: 45–50. Raith, K., Zellmer, S., Lasch, J. and Neubert, R.H.H. 2000. Profiling of human stratum corneum ceramides by liquid chromatographyelectrospray mass spectrometry. Anal. Chim. Acta 418: 167–173.
Roberts, J.K.M. 2000. NMR adventures in the metabolic labyrinth within plants. Trends Plant Sci. 5: 30–34. Robertson, D.G., Reily, M.D., Sigler, R.E., Wells, D.F., Paterson, D.A. and Braden, T.K. 2000. Metabonomics: evaluation of nuclear magnetic resonance (NMR) and pattern recognition technology for rapid in vivo screening of liver and kidney toxicants. Toxicol. Sci. 57: 326–337. Roessner, U., Luedemann, A., Brust, D., Fiehn, O., Linke, T., Willmitzer, L. and Fernie, A.R. 2001. Metabolic profiling allows comprehensive phenotyping of genetically or environmentally modified plant systems. Plant Cell 13: 11–29. Roessner, U., Wagner, C., Kopka, J., Trethewey, R.N. and Willmitzer, L. 2000. Simultaneous analysis of metabolites in potato tuber by gas chromatography-mass spectrometry. Plant J. 23: 131–142. Sargenti, S.R. and Vichnewski, W. 2000. Sonication and liquid chromatography as a rapid technique for extraction and fractionation of plant material. Phytochem. Anal. 11: 69–73. Sauter, H., Lauer, M. and Fritsch, H. 1991. Metabolic profiling of plants: a new diagnostic technique. ACS Symp. Ser. 443: 288– 299. Schmidt, K., Carlsen, M., Nielsen, J. and Villadsen, J. 1997. Modelling isotopomer distributions in biochemical networks using isotopomer mapping matrices. Biotechnol. Bioeng. 55: 831–840. Schuster, S. 1999. Studies on the stoichiometric structure of enzymatic reaction systems. Theory Biosci. 118: 125–139. Schuster, S., Dandekar, T. and Fell, D.A. 1999. Detection of elementary flux modes in biochemical networks: a promising tool for pathway analysis and metabolic engineering. Trends Biotechnol. 17: 53–60. Schuster, S., Fell, D.A. and Dandekar, T. 2000. A general definition of metabolic pathways useful for systematic organization and analysis of complex metabolic networks. Nature Biotechnol. 18: 326–332. Shetty, H.U., Holloway, H.W. and Rapoport, S.I. 1995. Capillary gas chromatography combined with ion trap detection for quantitative profiling of polyols in cerebrospinal fluid and plasma. Anal. Biochem. 224: 279–285. Smedsgaard, J. and Frisvad, J.C. 1996. Using direct electrospray mass spectrometry in taxonomy and secondary metabolite profiling of crude fungal extracts. J. Microbiol. Meth. 25: 5–17. Srere, P.A. 1985. The metabolon. Trends Biochem. Sci. 10: 109– 110. Starmans, D.A.J. and Nijhuis, H.H. 1996. Extraction of secondary metabolites from plant material: a review. Trends Food Sci. Technol. 7: 191–197. Stein, S.E. 1999. An integrated method for spectrum extraction and compound identification from gas chromatography/mass spectrometry data. J. Am. Soc. Mass Spectrom. 10: 770–781. Streeter J.G. and Strimbu C.E. 1998. Simultaneous extraction and derivatization of carbohydrates from green plant tissues for analysis by gas-liquid chromatography. Anal. Biochem. 259: 253–257. Szyperski, T. 1998. 13 C-NMR, MS and metabolic flux balancing in biotechnology research. Quant. Rev. Biophys. 31: 41–106. Tanaka, K., Hine, D.G., West-Dull, A. and Lynn, T.B. 1980a. Gaschromatographic method of analysis of urinary organic acids. I. Retention indices of 155 metabolically important compounds. Clin. Chem. 26: 1839–1846. Tanaka, K., West-Dull, A., Hine, D.G., Lynn, T.B. and Lowe, T. 1980b. Gas-chromatographic method of analysis of urinary organic acids. II. Description of the procedure, and its application to diagnosis of patients with organic acidurias. Clin. Chem. 26: 1847–1853.
171 Taylor, J., Goodacre, R., Wade, W.G., Rowland, J.J. and Kell, D.B. 1998. The deconvolution of pyrolysis mass spectra using genetic programming: application to the identification of some Eubacterium species. FEMS Microbiol. Lett. 160: 237–246. Teusink, B., Baganz, F., Westerhoff, H.V. and Oliver, S.G.1998. Metabolic control analysis as a tool in the elucidation of the function of novel genes. Meth. Microbiol. 26: 297–336. Thomas, S., Mooney, P.J.F., Burrell, M.M. and Fell, D.A. 1997. Metabolic control analysis of glycolysis in tuber tissue of potato (Solanum tuberosum): explanation for the low control coefficient of phosphofructokinase over respiratory flux. Biochem J. 332: 119–127. Trethewey, R.N., Geigenberger, P., Riedel, K., Hajurezaei, M.R., Sonnewald, U., Stitt, M., Riesmeier, J.W. and Willmitzer, L. 1998. Combined expression of glucokinase and invertase in potato tubers leads to a dramatic reduction in starch accumulation and a stimulation of glycolysis. Plant J. 15: 109–118. Trethewey, R.N., Krotzky, A.J. and Willmitzer, L. 1999. Metabolic profiling: a Rosetta stone for genomics? Curr. Opin. Plant Biol. 2: 83–85. Tweeddale, H., Notley-McRobb, L. and Ferenci, T. 1998. Effect of slow growth on metabolism of Escherichia coli, as revealed by global metabolite pool (‘metabolome’) analysis. J. Bact. 180: 5109–5116. Velot, C., Mixon, M.B., Teige, M. and Srere, P.A. 1997. Model of a quinary structure between Krebs TCA cycle enzymes: a model for the metabolon. Biochemistry 36: 14271–14276.
Vingron, M. and Hoheisel, J. 1999. Computational aspects of expression data. J. Mol. Med. 77: 3–7. Warne, M.A., Lenz, E.M., Osborn, D., Weeks, J.M. and Nicholson, J.K. 2000. An NMR-based metabonomic investigation of the toxic effects of 3-trifluoromethyl-aniline on the earthworm Eisenia veneta. Biomarkers 5: 56–72. Wiechert, W. and de Graaf, A.A. 1997a. Bidirectional reaction steps in metabolic networks. I. Modeling and simulation of carbon isotope labelling experiments. Biotechnol. Bioeng. 55: 112–117. Wiechert, W., Siefke, C., de Graaf, A.A. and Marx, A. 1997b. Bidirectional reaction steps in metabolic networks. II. Flux estimation and statistical analysis. Biotechnol. Bioeng. 55: 118–135. Wiechert, W., Möllney, M., Isermann, N., Wurzel, M. and de Graaf, A.A. 1999. Bidirectional reaction steps in metabolic networks. III. Explicit solution and analysis of isotopomer systems. Biotechnol. Bioeng. 66: 69–85. Wolfender, J.L., Rodriguez, S. and Hostettmann, K. 1998. Liquid chromatography coupled to mass spectrometry and nuclear magnetic resonance for the screening of plant constituents. J. Chromatogr. A 794: 299–316. World Health Organization. 2000. Safety aspects of genetically modified foods of plant origins. In: Report of a joint FAO/WHO expert consultation on foods derived from biotechnology, held in Geneva, Switzerland, 29 May–2 June 2000. World Health Organization, Geneva, pp. 1–35.