Queens Community District 9
See QN 9's profile online
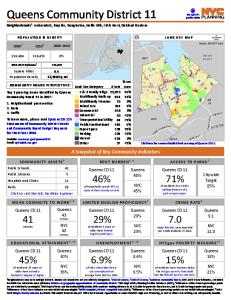
Neighborhoods1: Kew Gardens, Ozone Park, Richmond Hill, Woodhaven
[
PO P U L ATI O N & D E N S I T Y
141,608
143,317
+1%
Top 3 pressing issues identified by Queens Community Board 9 in 2017: 1. Affordable housing 2. Health care services 3. Senior services
Ja m aic a
nt Atla
Av
QN 12
Av
QN 10
ic Av
Rocka w
S Co nd u it A N v Co n BK duit Av 5
ay Bl v
d
Bay Blvd
Website: www.nyc.gov/queenscb9 Email:
[email protected]
ide Hills
Cross
To learn more, please read Queens CD 9's Statements of Community District Needs and Community Board Budget Requests for Fiscal Year 2018.
60% 11% 3% 5% 5% 3% 3% 5% 2% 2% 1% <1%
l Pkwy
QN 8
Forest Park
% Lot # Lots Area
Land Use Category 1 & 2 Family Bldgs 15,337 Multifamily Walk-up 2,302 Multifamily Elevator 96 Mixed Use 1,284 Commercial 349 Industrial 192 Transportation/Utility 100 Public/Institutional 196 Open Space 17 Parking 266 Vacant 260 Other 23
y kw
P on ins b o R kie Jac
3.8 37,715/sq mi
COMMUNITY BOARD PERSPECTIVES
Grand Centra
y Exp ck Wy
Square Miles Population Density
Flushing Meadows Corona Park
Blv d
QN 6
QN 5
153,164
Miles
n Va
2011-2015 Estimate
4
Qu ee ns
d Bl v
2000-2010
en av dh
20103
o Wo
20002
0.5
LA N D U S E M A P
Click here for a more detailed land use map of Queens CD 9
A Snapshot of Key Community Indicators CO M M U N I T Y A S S E T S 5
R E N T B U R D E N 4, 6
Public Schools
31
Public Libraries
2
Hospitals and Clinics
9
Parks
4
Click to visit the NYC Facilities Explorer
M E A N C O M M U T E T O W O R K 4, 8
Queens CD 9
45 minutes
Queens 43 minutes
NYC 40
minutes
E D U C AT I O N A L AT TA I N M E N T 4 , 1 0
Queens CD 9
26%
of residents 25 years or older have earned a bachelor's degree or higher 1
Queens 30% NYC 36%
Queens CD 9
48%
of households spend 35% or more of their income on rent
Queens 48%
Queens CD 9
NYC 45%
of residents live within walking distance of a park or open space
LI M I T E D EN GL I S H P RO FI CI EN C Y 4
Queens CD 9
25.7%
of residents 5 years or older have limited English proficiency
Queens 28.8% NYC 23.1%
U N E M P L OY M E N T 4 , 1 0
Queens CD 9
9.2%
of the civilian labor force was unemployed on average from 2011 to 2015
A C C E S S TO PA R KS 7
Queens 8.6% NYC 9.5%
71%
Citywide Target 85%
C R I M E R AT E 9
Queens CD 9
7.4
major felonies were reported per 1,000 residents in 2016
Queens 9.1 NYC 11.8
P O V E R T Y 4, 1 0
Queens CD 9
16%
of residents had incomes below the poverty level
Queens 15% NYC 21%
Neighborhoods may be in multiple districts. Names and boundaries are not officially designated. 22000 US Census; 32010 US Census; 4American Community Survey 2011-2015 5-Year Estimates, calculated for Public Use Microdata Areas (PUMAs). PUMAs are geographic approximations of community districts. 5NYC Dept of City Planning Facilites Database (2017); 6 Differences of less than 3 percentage points are not statistically meaningful. 7NYC Dept of Parks and Recreation (DPR) (2016). DPR considers walking distance to be 1/4 mile for parks less than 6 acres, and 1/2 mile for larger parks and pools. 8 Differences of less than 2 minutes are not statistically meaningful. 9NYPD CompStat, Historic Complaint Data (2017); 10 Differences of less than 2 percentage points are not statistically meaningful.