2013 HEALTHY KIDS COLORADO SURVEY RESULTS Region 4 High School Summary Tables - Weighted Data Table 1. Percentage of students who were obese (i.e., at or above the 95th percentile for body mass index, by age and gender) Total
Age
Grade
Race/Ethnicity
Male
Female
Percentage
95% confidence interval
Percentage
95% confidence interval
Percentage
95% confidence interval
Total
5.1
( 4.2 - 5.9 )
6.2
( 4.4 - 8.0 )
3.9
( 3.1 - 4.7 )
15 or younger
4.3
( 3.3 - 5.4 )
5.5
( 3.9 - 7.1 )
3.1
( 1.2 - 5.0 )
16 or 17
5.5
( 3.9 - 7.1 )
6.3
( 3.3 - 9.4 )
4.7
( 3.0 - 6.4 )
18 or older
6.7
( 2.5 - 11.0 )
9.4
( 4.1 - 14.6 )
2.9
( 0.0 - 7.8 )
9th
3.3
( 1.5 - 5.1 )
3.7
( 1.3 - 6.1 )
2.9
( 0.8 - 5.1 )
10th
5.8
( 3.0 - 8.6 )
7.6
( 3.0 - 12.2 )
3.9
( 0.9 - 6.8 )
11th
6.2
( 4.3 - 8.2 )
7.9
( 3.4 - 12.5 )
4.6
( 1.5 - 7.7 )
12th
5.1
( 3.9 - 6.2 )
5.9
( 3.9 - 8.0 )
4.2
( 2.2 - 6.1 )
.
.
.
.
.
.
8.0
( 2.4 - 13.6 )
.
.
.
.
Black/African American*
.
.
.
.
.
.
Native Hawaiian/Other Pacific Islander*
.
.
.
.
.
.
White*
3.4
( 2.6 - 4.2 )
5.8
( 4.1 - 7.5 )
1.0
( 0.2 - 1.8 )
White Hispanic
7.0
( 4.1 - 9.8 )
9.1
( 3.4 - 14.8 )
4.9
( 1.4 - 8.3 )
Other
3.2
( 1.1 - 5.4 )
4.5
( 1.4 - 7.6 )
1.9
( 0.0 - 4.0 )
American Indian/Alaska Native* Asian*
*Non-Hispanic. . = Less than 50 students in the subgroup. Version: HS21OCT2014
[email protected]
2013 HEALTHY KIDS COLORADO SURVEY RESULTS Region 4 High School Summary Tables - Weighted Data Table 2. Percentage of students who were overweight (i.e., at or above the 85th percentile but below the 95th percentile for body mass index, by age and gender) Total
Age
Grade
Race/Ethnicity
Male
Female
Percentage
95% confidence interval
Percentage
95% confidence interval
Percentage
95% confidence interval
Total
10.1
( 8.9 - 11.3 )
13.6
( 10.1 - 17.2 )
6.6
( 4.3 - 8.9 )
15 or younger
9.5
( 7.1 - 12.0 )
12.0
( 7.4 - 16.5 )
7.1
( 3.6 - 10.5 )
16 or 17
10.8
( 10.0 - 11.6 )
15.3
( 10.5 - 20.1 )
6.3
( 2.9 - 9.8 )
18 or older
9.8
( 7.2 - 12.4 )
13.0
( 9.4 - 16.7 )
5.1
( 0.0 - 11.4 )
9th
10.0
( 6.1 - 13.8 )
12.5
( 6.3 - 18.7 )
7.4
( 3.4 - 11.4 )
10th
8.3
( 5.8 - 10.8 )
10.6
( 8.3 - 12.8 )
5.9
( 1.5 - 10.2 )
11th
10.3
( 7.2 - 13.4 )
15.4
( 5.9 - 24.8 )
5.2
( 1.4 - 9.1 )
12th
11.6
( 8.2 - 15.0 )
15.7
( 10.6 - 20.8 )
7.4
( 3.0 - 11.9 )
.
.
.
.
.
.
7.8
( 4.7 - 11.0 )
.
.
.
.
Black/African American*
.
.
.
.
.
.
Native Hawaiian/Other Pacific Islander*
.
.
.
.
.
.
White*
8.3
( 7.4 - 9.2 )
10.3
( 7.8 - 12.8 )
6.2
( 3.2 - 9.2 )
White Hispanic
15.5
( 10.6 - 20.3 )
22.4
( 15.8 - 29.1 )
8.8
( 2.7 - 14.9 )
Other
12.7
( 8.3 - 17.1 )
19.1
( 11.8 - 26.4 )
6.1
( 2.2 - 10.0 )
American Indian/Alaska Native* Asian*
*Non-Hispanic. . = Less than 50 students in the subgroup. Version: HS21OCT2014
[email protected]
2013 HEALTHY KIDS COLORADO SURVEY RESULTS Region 4 High School Summary Tables - Weighted Data Table 3. Percentage of students who were overweight or obese (i.e., at or above the 85th percentile for body mass index, by age and gender) Total
Age
Grade
Race/Ethnicity
Male
Female
Percentage
95% confidence interval
Percentage
95% confidence interval
Percentage
95% confidence interval
Total
15.2
( 13.2 - 17.2 )
19.9
( 15.6 - 24.1 )
10.5
( 8.4 - 12.5 )
15 or younger
13.8
( 10.5 - 17.1 )
17.4
( 11.6 - 23.3 )
10.2
( 5.9 - 14.5 )
16 or 17
16.3
( 14.2 - 18.4 )
21.6
( 16.8 - 26.4 )
11.0
( 8.1 - 14.0 )
18 or older
16.5
( 12.8 - 20.3 )
22.4
( 16.2 - 28.5 )
8.0
( 2.6 - 13.5 )
9th
13.3
( 9.0 - 17.7 )
16.2
( 9.3 - 23.1 )
10.3
( 6.3 - 14.3 )
10th
14.1
( 11.5 - 16.7 )
18.2
( 14.5 - 21.8 )
9.7
( 4.1 - 15.4 )
11th
16.5
( 13.0 - 20.1 )
23.3
( 16.9 - 29.7 )
9.8
( 6.4 - 13.2 )
12th
16.6
( 13.1 - 20.1 )
21.7
( 16.6 - 26.7 )
11.6
( 6.8 - 16.4 )
.
.
.
.
.
.
15.9
( 8.4 - 23.4 )
.
.
.
.
Black/African American*
.
.
.
.
.
.
Native Hawaiian/Other Pacific Islander*
.
.
.
.
.
.
White*
11.7
( 10.3 - 13.2 )
16.0
( 12.7 - 19.4 )
7.2
( 4.3 - 10.0 )
White Hispanic
22.4
( 17.0 - 27.9 )
31.6
( 24.6 - 38.5 )
13.7
( 8.3 - 19.1 )
Other
15.9
( 10.8 - 21.0 )
23.6
( 17.0 - 30.2 )
8.0
( 2.1 - 13.9 )
American Indian/Alaska Native* Asian*
*Non-Hispanic. . = Less than 50 students in the subgroup. Version: HS21OCT2014
[email protected]
2013 HEALTHY KIDS COLORADO SURVEY RESULTS Region 4 High School Summary Tables - Weighted Data Table 4. Percentage of students who were underweight (i.e., below the 5th percentile for body mass index, by age and gender) Total
Age
Grade
Race/Ethnicity
Male
Female
Percentage
95% confidence interval
Percentage
95% confidence interval
Percentage
95% confidence interval
Total
5.7
( 4.8 - 6.6 )
7.4
( 4.8 - 10.0 )
3.9
( 2.5 - 5.3 )
15 or younger
4.4
( 3.3 - 5.6 )
5.4
( 3.0 - 7.7 )
3.5
( 1.9 - 5.1 )
16 or 17
6.1
( 4.6 - 7.6 )
8.1
( 4.8 - 11.5 )
4.1
( 2.8 - 5.5 )
18 or older
9.7
( 6.9 - 12.6 )
13.1
( 7.1 - 19.1 )
4.8
( 0.0 - 10.2 )
9th
5.4
( 4.1 - 6.6 )
6.9
( 3.6 - 10.3 )
3.8
( 1.8 - 5.8 )
10th
4.8
( 3.7 - 5.9 )
6.6
( 4.4 - 8.9 )
2.8
( 0.9 - 4.8 )
11th
5.2
( 2.9 - 7.4 )
6.0
( 4.1 - 7.9 )
4.4
( 0.7 - 8.0 )
12th
7.5
( 4.7 - 10.2 )
10.3
( 5.4 - 15.2 )
4.6
( 0.6 - 8.7 )
.
.
.
.
.
.
11.2
( 0.7 - 21.8 )
.
.
.
.
Black/African American*
.
.
.
.
.
.
Native Hawaiian/Other Pacific Islander*
.
.
.
.
.
.
White*
6.7
( 5.3 - 8.0 )
8.3
( 4.8 - 11.8 )
5.0
( 3.2 - 6.8 )
White Hispanic
2.7
( 0.4 - 4.9 )
3.6
( 0.0 - 8.2 )
1.7
( 0.0 - 3.9 )
Other
4.4
( 2.4 - 6.3 )
6.2
( 1.1 - 11.2 )
2.5
( 0.9 - 4.1 )
American Indian/Alaska Native* Asian*
*Non-Hispanic. . = Less than 50 students in the subgroup. Version: HS21OCT2014
[email protected]
2013 HEALTHY KIDS COLORADO SURVEY RESULTS Region 4 High School Summary Tables - Weighted Data Table 5. Percentage of students who most often speak a language other than English at home Total
Age
Grade
Race/Ethnicity
Male
Female
Percentage
95% confidence interval
Percentage
95% confidence interval
Percentage
95% confidence interval
Total
5.1
( 4.0 - 6.1 )
5.1
( 3.5 - 6.7 )
4.8
( 3.9 - 5.8 )
15 or younger
6.0
( 4.8 - 7.3 )
6.8
( 3.9 - 9.7 )
4.9
( 2.4 - 7.4 )
16 or 17
3.7
( 2.6 - 4.8 )
2.4
( 0.0 - 4.9 )
5.0
( 3.2 - 6.8 )
18 or older
7.7
( 0.0 - 16.0 )
.
.
.
.
9th
5.9
( 1.6 - 10.1 )
5.3
( 0.6 - 10.0 )
6.5
( 0.5 - 12.5 )
10th
2.2
( 0.0 - 4.7 )
2.3
( 0.0 - 7.0 )
2.0
( 0.0 - 3.9 )
11th
5.9
( 3.9 - 7.9 )
6.0
( 2.0 - 10.1 )
5.8
( 2.7 - 8.9 )
12th
4.8
( 2.0 - 7.6 )
4.6
( 0.0 - 9.7 )
4.9
( 3.2 - 6.7 )
American Indian/Alaska Native*
.
.
.
.
.
.
Asian*
.
.
.
.
.
.
Black/African American*
.
.
.
.
.
.
Native Hawaiian/Other Pacific Islander*
.
.
.
.
.
.
White*
0.5
( 0.1 - 0.8 )
0.2
( 0.0 - 0.5 )
0.8
( 0.1 - 1.4 )
White Hispanic
11.0
( 5.3 - 16.7 )
.
.
.
.
Other
15.4
( 7.1 - 23.7 )
16.3
( 3.8 - 28.8 )
13.3
( 6.6 - 20.0 )
*Non-Hispanic. . = Less than 50 students in the subgroup. Version: HS21OCT2014
[email protected]
2013 HEALTHY KIDS COLORADO SURVEY RESULTS Region 4 High School Summary Tables - Weighted Data Table 6. Percentage of students who identified themselves as gay, lesbian, or bisexual Total
Age
Grade
Race/Ethnicity
Male
Female
Percentage
95% confidence interval
Percentage
95% confidence interval
Percentage
95% confidence interval
Total
4.4
( 3.4 - 5.4 )
3.3
( 2.1 - 4.4 )
5.6
( 3.7 - 7.6 )
15 or younger
4.5
( 2.8 - 6.2 )
3.4
( 2.2 - 4.6 )
5.6
( 3.3 - 7.9 )
16 or 17
3.9
( 2.7 - 5.1 )
1.4
( 0.2 - 2.5 )
6.4
( 3.9 - 9.0 )
18 or older
7.5
( 1.2 - 13.8 )
12.6
( 2.3 - 23.0 )
0.0
( 0.0 - 0.0 )
9th
4.0
( 1.2 - 6.8 )
3.2
( 0.0 - 6.6 )
4.8
( 1.8 - 7.8 )
10th
4.1
( 3.4 - 4.7 )
2.7
( 1.6 - 3.9 )
5.6
( 3.5 - 7.6 )
11th
3.1
( 1.6 - 4.6 )
1.2
( 0.1 - 2.4 )
5.1
( 2.5 - 7.6 )
12th
6.3
( 4.2 - 8.4 )
5.6
( 0.3 - 11.0 )
6.9
( 2.6 - 11.3 )
.
.
.
.
.
.
4.0
( 0.0 - 9.6 )
.
.
.
.
Black/African American*
.
.
.
.
.
.
Native Hawaiian/Other Pacific Islander*
.
.
.
.
.
.
White*
3.8
( 2.3 - 5.4 )
1.7
( 0.3 - 3.1 )
6.1
( 3.4 - 8.8 )
White Hispanic
5.2
( 3.6 - 6.8 )
6.2
( 2.4 - 10.0 )
4.2
( 0.9 - 7.4 )
Other
6.8
( 3.3 - 10.3 )
3.3
( 0.0 - 6.5 )
10.5
( 2.7 - 18.2 )
American Indian/Alaska Native* Asian*
*Non-Hispanic. . = Less than 50 students in the subgroup. Version: HS21OCT2014
[email protected]
2013 HEALTHY KIDS COLORADO SURVEY RESULTS Region 4 High School Summary Tables - Weighted Data Table 7. Among students who drove a car or other vehicle during the past 30 days, the percentage who drove one or more times when they had been using marijuana Total
Age
Grade
Race/Ethnicity
Male
Female
Percentage
95% confidence interval
Percentage
95% confidence interval
Percentage
95% confidence interval
Total
10.6
( 6.7 - 14.4 )
13.9
( 7.4 - 20.4 )
7.0
( 4.2 - 9.9 )
15 or younger
8.7
( 5.1 - 12.4 )
10.0
( 4.0 - 16.0 )
6.7
( 1.3 - 12.2 )
16 or 17
10.4
( 6.2 - 14.5 )
15.1
( 7.3 - 22.8 )
6.4
( 4.2 - 8.5 )
18 or older
16.8
( 6.1 - 27.5 )
.
.
.
.
9th
9.2
( 0.6 - 17.7 )
.
.
.
.
10th
4.6
( 2.3 - 6.9 )
6.5
( 2.4 - 10.6 )
2.4
( 0.4 - 4.4 )
11th
11.2
( 4.2 - 18.2 )
15.0
( 3.6 - 26.3 )
7.9
( 4.8 - 11.1 )
12th
12.9
( 7.6 - 18.1 )
18.6
( 7.7 - 29.6 )
7.3
( 2.4 - 12.2 )
American Indian/Alaska Native*
.
.
.
.
.
.
Asian*
.
.
.
.
.
.
Black/African American*
.
.
.
.
.
.
Native Hawaiian/Other Pacific Islander*
.
.
.
.
.
.
White*
7.7
( 3.7 - 11.7 )
9.5
( 3.5 - 15.5 )
5.8
( 1.7 - 9.8 )
White Hispanic
16.1
( 6.2 - 26.0 )
.
.
.
.
Other
21.6
( 12.1 - 31.0 )
.
.
.
.
*Non-Hispanic. . = Less than 50 students in the subgroup. Version: HS21OCT2014
[email protected]
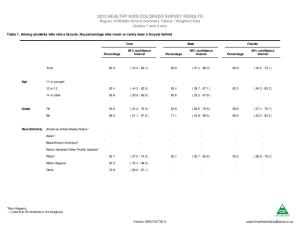
2013 HEALTHY KIDS COLORADO SURVEY RESULTS Region 4 High School Summary Tables - Weighted Data Table 8. Among students who rode a bicycle during the past 12 months, the percentage who never or rarely wore a bicycle helmet Total
Age
Race/Ethnicity
Female
Percentage
95% confidence interval
Percentage
95% confidence interval
Percentage
95% confidence interval
Total
58.9
( 56.1 - 61.7 )
62.0
( 56.7 - 67.4 )
55.2
( 49.1 - 61.4 )
15 or younger
52.9
( 46.5 - 59.3 )
54.7
( 47.0 - 62.5 )
50.4
( 42.1 - 58.6 )
16 or 17
63.4
( 60.4 - 66.3 )
68.1
( 61.9 - 74.3 )
56.2
( 48.5 - 63.9 )
.
.
.
.
.
.
9th
50.2
( 40.7 - 59.8 )
53.0
( 44.1 - 62.0 )
47.5
( 34.6 - 60.3 )
10th
60.4
( 51.1 - 69.8 )
61.0
( 49.7 - 72.2 )
58.7
( 46.5 - 70.9 )
11th
59.0
( 56.1 - 61.9 )
70.6
( 63.4 - 77.8 )
44.7
( 40.0 - 49.4 )
12th
69.7
( 62.8 - 76.7 )
64.4
( 54.3 - 74.6 )
76.7
( 65.6 - 87.8 )
American Indian/Alaska Native*
.
.
.
.
.
.
Asian*
.
.
.
.
.
.
Black/African American*
.
.
.
.
.
.
Native Hawaiian/Other Pacific Islander*
.
.
.
.
.
.
White*
57.7
( 53.1 - 62.3 )
59.5
( 50.5 - 68.4 )
55.4
( 49.1 - 61.8 )
White Hispanic
60.6
( 51.2 - 70.1 )
.
.
.
.
Other
64.2
( 55.9 - 72.5 )
.
.
.
.
18 or older
Grade
Male
*Non-Hispanic. . = Less than 50 students in the subgroup. Version: HS21OCT2014
[email protected]
2013 HEALTHY KIDS COLORADO SURVEY RESULTS Region 4 High School Summary Tables - Weighted Data Table 9. Percentage of students who never or rarely wore a seat belt when riding in a car driven by someone else Total
Age
Grade
Race/Ethnicity
Male
Female
Percentage
95% confidence interval
Percentage
95% confidence interval
Percentage
95% confidence interval
Total
4.8
( 3.0 - 6.7 )
5.2
( 3.6 - 6.8 )
4.0
( 1.6 - 6.5 )
15 or younger
2.5
( 1.2 - 3.8 )
3.5
( 1.0 - 6.1 )
1.6
( 0.0 - 3.6 )
16 or 17
5.7
( 3.1 - 8.3 )
5.0
( 2.5 - 7.5 )
6.2
( 2.3 - 10.1 )
18 or older
10.3
( 1.4 - 19.3 )
.
.
.
.
9th
2.9
( 0.6 - 5.1 )
5.7
( 1.6 - 9.7 )
0.0
( 0.0 - 0.0 )
10th
3.0
( 0.4 - 5.6 )
3.7
( 0.1 - 7.3 )
2.3
( 0.0 - 4.9 )
11th
5.0
( 1.7 - 8.3 )
4.4
( 1.3 - 7.4 )
4.9
( 0.0 - 10.7 )
12th
7.6
( 4.5 - 10.7 )
5.9
( 2.3 - 9.5 )
9.3
( 4.1 - 14.6 )
American Indian/Alaska Native*
.
.
.
.
.
.
Asian*
.
.
.
.
.
.
Black/African American*
.
.
.
.
.
.
Native Hawaiian/Other Pacific Islander*
.
.
.
.
.
.
White*
3.5
( 2.4 - 4.6 )
4.6
( 2.2 - 7.0 )
2.1
( 0.2 - 3.9 )
White Hispanic
3.5
( 1.3 - 5.7 )
.
.
.
.
Other
7.4
( 1.4 - 13.3 )
.
.
.
.
*Non-Hispanic. . = Less than 50 students in the subgroup. Version: HS21OCT2014
[email protected]
2013 HEALTHY KIDS COLORADO SURVEY RESULTS Region 4 High School Summary Tables - Weighted Data Table 10. Percentage of students who rode one or more times during the past 30 days in a car or other vehicle driven by someone who had been drinking alcohol Total
Age
Grade
Race/Ethnicity
Male
Female
Percentage
95% confidence interval
Percentage
95% confidence interval
Percentage
95% confidence interval
Total
14.1
( 10.2 - 17.9 )
12.8
( 8.6 - 16.9 )
15.3
( 11.4 - 19.2 )
15 or younger
13.4
( 9.6 - 17.3 )
9.9
( 7.4 - 12.3 )
16.7
( 11.2 - 22.2 )
16 or 17
14.1
( 9.0 - 19.1 )
13.9
( 8.1 - 19.7 )
14.1
( 9.6 - 18.7 )
18 or older
18.1
( 9.1 - 27.1 )
20.8
( 10.5 - 31.2 )
13.9
( 1.3 - 26.6 )
9th
12.0
( 6.2 - 17.8 )
8.0
( 3.6 - 12.4 )
16.0
( 8.8 - 23.2 )
10th
13.1
( 9.3 - 16.8 )
10.7
( 8.0 - 13.3 )
15.2
( 9.1 - 21.3 )
11th
16.3
( 10.3 - 22.2 )
16.1
( 9.9 - 22.3 )
16.1
( 9.1 - 23.2 )
12th
14.6
( 8.2 - 21.0 )
15.2
( 6.5 - 24.0 )
14.0
( 8.4 - 19.5 )
.
.
.
.
.
.
Asian*
10.5
( 5.7 - 15.2 )
.
.
.
.
Black/African American*
22.7
( 15.9 - 29.6 )
.
.
.
.
.
.
.
.
.
.
White*
11.4
( 7.6 - 15.1 )
9.6
( 6.0 - 13.3 )
13.1
( 9.3 - 16.9 )
White Hispanic
15.9
( 9.2 - 22.7 )
15.2
( 5.9 - 24.4 )
16.7
( 11.0 - 22.4 )
Other
25.5
( 17.3 - 33.7 )
27.0
( 17.1 - 36.8 )
23.5
( 14.9 - 32.1 )
American Indian/Alaska Native*
Native Hawaiian/Other Pacific Islander*
*Non-Hispanic. . = Less than 50 students in the subgroup. Version: HS21OCT2014
[email protected]
2013 HEALTHY KIDS COLORADO SURVEY RESULTS Region 4 High School Summary Tables - Weighted Data Table 11. Among students who drove a car or other vehicle during the past 30 days, the percentage who drove one or more times when they had been drinking alcohol Total
Age
Grade
Race/Ethnicity
Male
Female
Percentage
95% confidence interval
Percentage
95% confidence interval
Percentage
95% confidence interval
Total
7.4
( 4.1 - 10.6 )
8.6
( 4.6 - 12.5 )
6.1
( 1.9 - 10.3 )
15 or younger
6.2
( 2.9 - 9.6 )
7.2
( 1.7 - 12.7 )
4.9
( 1.2 - 8.6 )
16 or 17
5.7
( 2.3 - 9.0 )
6.3
( 2.9 - 9.7 )
5.1
( 0.6 - 9.5 )
18 or older
19.3
( 9.4 - 29.1 )
20.7
( 10.8 - 30.6 )
16.8
( 3.7 - 30.0 )
9th
8.5
( 3.1 - 14.0 )
8.1
( 0.7 - 15.4 )
9.0
( 2.0 - 16.0 )
10th
1.6
( 0.1 - 3.1 )
1.9
( 0.0 - 4.1 )
1.3
( 0.0 - 2.6 )
11th
4.6
( 0.4 - 8.8 )
6.0
( 1.5 - 10.6 )
3.3
( 0.0 - 7.7 )
12th
11.7
( 5.6 - 17.8 )
12.8
( 6.0 - 19.7 )
10.5
( 2.4 - 18.7 )
American Indian/Alaska Native*
.
.
.
.
.
.
Asian*
.
.
.
.
.
.
Black/African American*
.
.
.
.
.
.
Native Hawaiian/Other Pacific Islander*
.
.
.
.
.
.
White*
5.4
( 2.1 - 8.7 )
6.1
( 2.6 - 9.7 )
4.6
( 0.6 - 8.5 )
White Hispanic
7.0
( 4.2 - 9.8 )
.
.
5.4
( 0.6 - 10.3 )
Other
17.7
( 9.0 - 26.4 )
14.1
( 7.0 - 21.2 )
20.6
( 7.1 - 34.2 )
*Non-Hispanic. . = Less than 50 students in the subgroup. Version: HS21OCT2014
[email protected]
2013 HEALTHY KIDS COLORADO SURVEY RESULTS Region 4 High School Summary Tables - Weighted Data Table 12. Among students who drove a car or other vehicle during the past 30 days, the percentage who texted or e-mailed while driving on one or more days Total
Age
Grade
Race/Ethnicity
Male
Female
Percentage
95% confidence interval
Percentage
95% confidence interval
Percentage
95% confidence interval
Total
34.2
( 26.4 - 42.1 )
33.5
( 28.9 - 38.2 )
35.1
( 22.2 - 48.0 )
15 or younger
7.4
( 3.5 - 11.3 )
6.5
( 1.4 - 11.6 )
8.3
( 1.0 - 15.6 )
16 or 17
40.8
( 31.4 - 50.2 )
39.4
( 32.3 - 46.6 )
42.1
( 27.6 - 56.6 )
18 or older
56.3
( 32.4 - 80.2 )
.
.
.
.
9th
10.4
( 1.7 - 19.0 )
.
.
.
.
10th
15.9
( 10.1 - 21.7 )
19.5
( 11.4 - 27.6 )
11.3
( 1.4 - 21.2 )
11th
38.0
( 29.1 - 46.9 )
34.6
( 27.7 - 41.6 )
40.6
( 27.5 - 53.8 )
12th
50.4
( 34.4 - 66.5 )
48.7
( 35.5 - 61.8 )
52.2
( 32.4 - 72.0 )
American Indian/Alaska Native*
.
.
.
.
.
.
Asian*
.
.
.
.
.
.
Black/African American*
.
.
.
.
.
.
Native Hawaiian/Other Pacific Islander*
.
.
.
.
.
.
White*
36.2
( 27.3 - 45.1 )
35.2
( 30.9 - 39.5 )
37.2
( 22.1 - 52.3 )
White Hispanic
31.8
( 20.4 - 43.3 )
.
.
.
.
.
.
.
.
.
.
Other
*Non-Hispanic. . = Less than 50 students in the subgroup. Version: HS21OCT2014
[email protected]
2013 HEALTHY KIDS COLORADO SURVEY RESULTS Region 4 High School Summary Tables - Weighted Data Table 13. Percentage of students who rode one or more times during the past 30 days in a car or other vehicle driven by someone who had been using marijuana Total
Age
Grade
Race/Ethnicity
Male
Female
Percentage
95% confidence interval
Percentage
95% confidence interval
Percentage
95% confidence interval
Total
16.0
( 10.7 - 21.3 )
17.2
( 8.6 - 25.9 )
14.6
( 11.4 - 17.8 )
15 or younger
12.2
( 5.8 - 18.6 )
12.8
( 4.4 - 21.2 )
11.3
( 6.0 - 16.6 )
16 or 17
18.7
( 13.6 - 23.9 )
20.4
( 11.0 - 29.8 )
17.1
( 12.7 - 21.5 )
18 or older
21.9
( 8.9 - 34.9 )
.
.
.
.
9th
9.0
( 3.3 - 14.6 )
4.8
( 0.9 - 8.6 )
13.4
( 5.0 - 21.8 )
10th
13.5
( 7.5 - 19.6 )
18.1
( 6.7 - 29.5 )
8.4
( 5.0 - 11.8 )
11th
18.1
( 11.7 - 24.6 )
18.4
( 9.6 - 27.1 )
17.9
( 10.6 - 25.3 )
12th
22.2
( 14.3 - 30.0 )
25.7
( 11.6 - 39.8 )
18.7
( 14.1 - 23.2 )
American Indian/Alaska Native*
.
.
.
.
.
.
Asian*
.
.
.
.
.
.
Black/African American*
.
.
.
.
.
.
Native Hawaiian/Other Pacific Islander*
.
.
.
.
.
.
White*
14.2
( 9.7 - 18.7 )
13.9
( 7.1 - 20.6 )
14.5
( 11.5 - 17.5 )
White Hispanic
19.6
( 11.1 - 28.1 )
.
.
.
.
Other
28.4
( 15.7 - 41.2 )
40.0
( 20.6 - 59.3 )
15.0
( 5.5 - 24.5 )
*Non-Hispanic. . = Less than 50 students in the subgroup. Version: HS21OCT2014
[email protected]
2013 HEALTHY KIDS COLORADO SURVEY RESULTS Region 4 High School Summary Tables - Weighted Data Table 14. Percentage of students who purposefully hurt themselves without wanting to die in the past 12 months Total
Age
Grade
Race/Ethnicity
Male
Female
Percentage
95% confidence interval
Percentage
95% confidence interval
Percentage
95% confidence interval
Total
13.2
( 9.9 - 16.4 )
7.6
( 4.7 - 10.4 )
19.0
( 15.7 - 22.4 )
15 or younger
14.2
( 10.2 - 18.3 )
4.2
( 1.1 - 7.2 )
24.2
( 19.8 - 28.7 )
16 or 17
12.3
( 8.7 - 15.9 )
9.2
( 6.1 - 12.4 )
15.2
( 10.5 - 19.9 )
18 or older
13.1
( 3.7 - 22.5 )
.
.
.
.
9th
14.5
( 8.6 - 20.3 )
4.8
( 0.0 - 10.5 )
24.6
( 18.2 - 31.0 )
10th
15.6
( 8.6 - 22.6 )
8.7
( 2.0 - 15.4 )
22.8
( 13.3 - 32.3 )
11th
8.4
( 4.0 - 12.8 )
4.8
( 0.0 - 9.6 )
12.3
( 3.7 - 20.8 )
12th
13.7
( 9.7 - 17.7 )
11.1
( 4.5 - 17.8 )
16.1
( 11.6 - 20.6 )
American Indian/Alaska Native*
.
.
.
.
.
.
Asian*
.
.
.
.
.
.
Black/African American*
.
.
.
.
.
.
Native Hawaiian/Other Pacific Islander*
.
.
.
.
.
.
White*
11.1
( 8.4 - 13.7 )
6.3
( 4.1 - 8.5 )
15.9
( 12.1 - 19.8 )
White Hispanic
13.3
( 8.7 - 17.9 )
.
.
.
.
Other
25.6
( 17.3 - 33.9 )
.
.
.
.
*Non-Hispanic. . = Less than 50 students in the subgroup. Version: HS21OCT2014
[email protected]
2013 HEALTHY KIDS COLORADO SURVEY RESULTS Region 4 High School Summary Tables - Weighted Data Table 15. Percentage of students who carried a weapon such as a gun, knife, or club on one or more of the past 30 days Total
Age
Grade
Race/Ethnicity
Male
Female
Percentage
95% confidence interval
Percentage
95% confidence interval
Percentage
95% confidence interval
Total
17.4
( 15.0 - 19.7 )
24.6
( 21.7 - 27.5 )
9.9
( 7.9 - 11.8 )
15 or younger
15.6
( 13.5 - 17.8 )
20.5
( 17.9 - 23.2 )
10.7
( 7.9 - 13.4 )
16 or 17
18.0
( 13.6 - 22.4 )
27.8
( 22.3 - 33.3 )
8.0
( 5.1 - 10.9 )
18 or older
24.0
( 20.1 - 27.9 )
27.9
( 19.9 - 35.9 )
18.0
( 8.3 - 27.8 )
9th
14.9
( 11.4 - 18.3 )
19.5
( 17.2 - 21.8 )
10.0
( 4.4 - 15.7 )
10th
15.4
( 12.9 - 17.9 )
22.0
( 17.6 - 26.4 )
8.5
( 6.0 - 11.0 )
11th
17.9
( 12.3 - 23.5 )
27.0
( 21.2 - 32.9 )
8.2
( 2.4 - 13.9 )
12th
19.5
( 15.3 - 23.7 )
26.7
( 19.4 - 34.1 )
12.5
( 7.5 - 17.5 )
.
.
.
.
.
.
Asian*
10.1
( 0.0 - 21.3 )
.
.
.
.
Black/African American*
22.9
( 12.6 - 33.3 )
.
.
.
.
.
.
.
.
.
.
White*
15.2
( 14.0 - 16.4 )
22.2
( 19.3 - 25.1 )
7.7
( 5.0 - 10.5 )
White Hispanic
19.8
( 10.7 - 28.9 )
30.3
( 18.2 - 42.5 )
9.6
( 1.0 - 18.2 )
Other
27.8
( 16.3 - 39.3 )
33.5
( 23.0 - 44.0 )
21.6
( 10.6 - 32.5 )
American Indian/Alaska Native*
Native Hawaiian/Other Pacific Islander*
*Non-Hispanic. . = Less than 50 students in the subgroup. Version: HS21OCT2014
[email protected]
2013 HEALTHY KIDS COLORADO SURVEY RESULTS Region 4 High School Summary Tables - Weighted Data Table 16. Percentage of students who carried a weapon such as a gun, knife, or club on school property on one or more of the past 30 days Total
Age
Grade
Race/Ethnicity
Male
Female
Percentage
95% confidence interval
Percentage
95% confidence interval
Percentage
95% confidence interval
Total
4.1
( 3.5 - 4.6 )
5.2
( 3.9 - 6.5 )
2.9
( 1.7 - 4.0 )
15 or younger
2.6
( 1.5 - 3.7 )
3.2
( 0.4 - 5.9 )
2.0
( 0.9 - 3.0 )
16 or 17
4.8
( 3.7 - 5.9 )
5.4
( 3.1 - 7.7 )
4.1
( 1.7 - 6.5 )
18 or older
8.2
( 1.6 - 14.8 )
13.5
( 2.6 - 24.4 )
0.0
( 0.0 - 0.0 )
9th
1.8
( 0.2 - 3.5 )
2.6
( 0.1 - 5.1 )
1.0
( 0.0 - 2.3 )
10th
2.5
( 1.4 - 3.6 )
3.6
( 1.7 - 5.5 )
1.3
( 0.2 - 2.3 )
11th
3.9
( 2.0 - 5.8 )
5.1
( 2.0 - 8.2 )
2.7
( 0.7 - 4.8 )
12th
6.7
( 4.3 - 9.1 )
7.1
( 1.9 - 12.3 )
6.3
( 3.2 - 9.5 )
.
.
.
.
.
.
Asian*
0.0
( 0.0 - 0.0 )
.
.
.
.
Black/African American*
8.7
( 0.0 - 17.5 )
.
.
.
.
.
.
.
.
.
.
White*
3.0
( 1.9 - 4.1 )
3.6
( 1.8 - 5.3 )
2.4
( 0.8 - 4.0 )
White Hispanic
4.1
( 1.1 - 7.0 )
5.8
( 0.9 - 10.6 )
2.5
( 0.0 - 5.4 )
Other
10.6
( 5.1 - 16.0 )
11.8
( 6.2 - 17.4 )
8.7
( 3.3 - 14.1 )
American Indian/Alaska Native*
Native Hawaiian/Other Pacific Islander*
*Non-Hispanic. . = Less than 50 students in the subgroup. Version: HS21OCT2014
[email protected]
2013 HEALTHY KIDS COLORADO SURVEY RESULTS Region 4 High School Summary Tables - Weighted Data Table 17. Percentage of students who did not go to school on one or more of the past 30 days because they felt they would be unsafe at school or on their way to or from school Total
Age
Grade
Race/Ethnicity
Male
Female
Percentage
95% confidence interval
Percentage
95% confidence interval
Percentage
95% confidence interval
Total
4.1
( 3.3 - 4.9 )
3.6
( 2.4 - 4.9 )
4.5
( 3.2 - 5.7 )
15 or younger
4.8
( 3.4 - 6.2 )
4.0
( 2.7 - 5.3 )
5.5
( 3.3 - 7.8 )
16 or 17
3.7
( 2.8 - 4.6 )
3.4
( 1.3 - 5.5 )
3.9
( 2.4 - 5.4 )
18 or older
2.5
( 0.7 - 4.3 )
3.3
( 0.0 - 6.6 )
1.3
( 0.0 - 3.4 )
9th
3.3
( 1.4 - 5.3 )
0.8
( 0.0 - 1.8 )
6.0
( 2.7 - 9.2 )
10th
4.5
( 2.6 - 6.4 )
5.2
( 1.5 - 9.0 )
3.7
( 1.7 - 5.8 )
11th
3.1
( 1.1 - 5.2 )
2.7
( 1.1 - 4.2 )
3.3
( 0.8 - 5.8 )
12th
4.5
( 1.4 - 7.5 )
4.2
( 0.0 - 8.7 )
4.7
( 1.7 - 7.7 )
.
.
.
.
.
.
Asian*
7.0
( 0.0 - 16.1 )
.
.
.
.
Black/African American*
7.1
( 0.9 - 13.3 )
.
.
.
.
.
.
.
.
.
.
White*
3.1
( 1.8 - 4.3 )
2.1
( 0.8 - 3.5 )
3.9
( 2.5 - 5.4 )
White Hispanic
3.2
( 1.3 - 5.1 )
2.8
( 0.0 - 6.4 )
3.7
( 2.0 - 5.3 )
Other
11.8
( 5.3 - 18.3 )
9.7
( 3.2 - 16.1 )
13.3
( 2.1 - 24.5 )
American Indian/Alaska Native*
Native Hawaiian/Other Pacific Islander*
*Non-Hispanic. . = Less than 50 students in the subgroup. Version: HS21OCT2014
[email protected]
2013 HEALTHY KIDS COLORADO SURVEY RESULTS Region 4 High School Summary Tables - Weighted Data Table 18. Percentage of students who had been threatened or injured with a weapon such as a gun, knife, or club on school property one or more times during the past 12 months Total
Age
Grade
Race/Ethnicity
Male
Female
Percentage
95% confidence interval
Percentage
95% confidence interval
Percentage
95% confidence interval
Total
5.9
( 5.0 - 6.8 )
7.1
( 5.5 - 8.7 )
4.6
( 3.5 - 5.7 )
15 or younger
7.5
( 5.8 - 9.2 )
9.4
( 7.2 - 11.6 )
5.6
( 3.2 - 7.9 )
16 or 17
3.9
( 2.7 - 5.0 )
4.5
( 1.7 - 7.3 )
3.3
( 1.4 - 5.1 )
18 or older
8.9
( 1.3 - 16.4 )
9.6
( 0.0 - 19.7 )
7.7
( 1.2 - 14.3 )
9th
8.0
( 5.1 - 11.0 )
10.1
( 4.8 - 15.4 )
5.9
( 3.5 - 8.4 )
10th
5.2
( 4.1 - 6.3 )
6.3
( 3.7 - 8.9 )
4.0
( 2.3 - 5.8 )
11th
3.6
( 2.2 - 5.0 )
4.8
( 1.6 - 8.1 )
2.3
( 0.1 - 4.5 )
12th
5.9
( 4.1 - 7.8 )
6.2
( 1.4 - 11.0 )
5.7
( 3.3 - 8.1 )
.
.
.
.
.
.
Asian*
2.8
( 0.7 - 4.9 )
.
.
.
.
Black/African American*
17.0
( 3.1 - 30.8 )
.
.
.
.
.
.
.
.
.
.
White*
3.7
( 3.0 - 4.3 )
4.2
( 2.9 - 5.5 )
3.1
( 2.5 - 3.8 )
White Hispanic
6.4
( 2.7 - 10.1 )
11.3
( 4.7 - 17.8 )
1.5
( 0.0 - 3.3 )
Other
14.9
( 7.2 - 22.5 )
16.5
( 9.0 - 24.0 )
12.6
( 2.3 - 23.0 )
American Indian/Alaska Native*
Native Hawaiian/Other Pacific Islander*
*Non-Hispanic. . = Less than 50 students in the subgroup. Version: HS21OCT2014
[email protected]
2013 HEALTHY KIDS COLORADO SURVEY RESULTS Region 4 High School Summary Tables - Weighted Data Table 19. Percentage of students who were in a physical fight one or more times during the past 12 months Total
Age
Grade
Race/Ethnicity
Male
Female
Percentage
95% confidence interval
Percentage
95% confidence interval
Percentage
95% confidence interval
Total
22.9
( 22.3 - 23.4 )
30.5
( 29.4 - 31.6 )
14.8
( 12.4 - 17.3 )
15 or younger
24.5
( 21.0 - 28.0 )
29.9
( 25.5 - 34.3 )
19.2
( 14.8 - 23.6 )
16 or 17
22.4
( 18.3 - 26.5 )
32.9
( 26.9 - 38.9 )
11.5
( 8.4 - 14.5 )
18 or older
16.4
( 9.0 - 23.7 )
21.7
( 11.5 - 32.0 )
8.1
( 1.2 - 15.0 )
9th
25.1
( 20.5 - 29.8 )
29.2
( 22.4 - 36.0 )
21.0
( 14.4 - 27.6 )
10th
24.8
( 21.0 - 28.6 )
33.6
( 27.1 - 40.0 )
15.7
( 13.8 - 17.7 )
11th
21.1
( 17.7 - 24.4 )
30.2
( 24.2 - 36.1 )
11.2
( 7.5 - 14.9 )
12th
18.4
( 13.4 - 23.4 )
26.0
( 16.2 - 35.9 )
10.7
( 7.0 - 14.3 )
.
.
.
.
.
.
Asian*
26.7
( 19.0 - 34.5 )
.
.
.
.
Black/African American*
41.7
( 23.9 - 59.4 )
.
.
.
.
.
.
.
.
.
.
White*
18.1
( 16.8 - 19.4 )
23.8
( 21.2 - 26.4 )
11.9
( 10.2 - 13.7 )
White Hispanic
25.4
( 20.9 - 29.9 )
37.4
( 29.9 - 44.9 )
13.4
( 5.6 - 21.2 )
Other
37.9
( 26.1 - 49.7 )
42.6
( 34.3 - 51.0 )
32.7
( 16.0 - 49.5 )
American Indian/Alaska Native*
Native Hawaiian/Other Pacific Islander*
*Non-Hispanic. . = Less than 50 students in the subgroup. Version: HS21OCT2014
[email protected]
2013 HEALTHY KIDS COLORADO SURVEY RESULTS Region 4 High School Summary Tables - Weighted Data Table 20. Among students who dated or went out with someone during the past 12 months, the percentage who had been physically hurt on purpose by someone they were dating or going out with one or more times during the past 12 months Total
Age
Grade
Race/Ethnicity
Male
Female
Percentage
95% confidence interval
Percentage
95% confidence interval
Percentage
95% confidence interval
Total
10.3
( 8.6 - 12.0 )
9.5
( 7.5 - 11.5 )
11.0
( 8.9 - 13.2 )
15 or younger
11.0
( 8.3 - 13.6 )
9.4
( 3.9 - 14.9 )
12.5
( 7.3 - 17.7 )
16 or 17
9.4
( 7.7 - 11.1 )
8.6
( 5.5 - 11.7 )
10.0
( 8.3 - 11.7 )
18 or older
13.2
( 4.7 - 21.7 )
14.1
( 0.7 - 27.6 )
.
.
9th
12.7
( 8.5 - 16.8 )
12.1
( 5.3 - 18.8 )
13.4
( 5.7 - 21.2 )
10th
9.3
( 8.0 - 10.6 )
6.1
( 1.2 - 11.1 )
12.3
( 7.3 - 17.4 )
11th
9.0
( 6.2 - 11.7 )
9.8
( 6.0 - 13.6 )
8.1
( 3.5 - 12.8 )
12th
9.0
( 5.2 - 12.7 )
7.9
( 0.0 - 15.9 )
10.2
( 5.7 - 14.6 )
American Indian/Alaska Native*
.
.
.
.
.
.
Asian*
.
.
.
.
.
.
Black/African American*
.
.
.
.
.
.
Native Hawaiian/Other Pacific Islander*
.
.
.
.
.
.
White*
8.5
( 6.1 - 10.9 )
5.7
( 2.0 - 9.4 )
11.2
( 7.8 - 14.6 )
White Hispanic
7.9
( 4.8 - 10.9 )
8.8
( 3.4 - 14.3 )
6.8
( 1.3 - 12.3 )
Other
17.3
( 10.5 - 24.0 )
16.7
( 6.9 - 26.5 )
16.8
( 2.3 - 31.4 )
*Non-Hispanic. . = Less than 50 students in the subgroup. Version: HS21OCT2014
[email protected]
2013 HEALTHY KIDS COLORADO SURVEY RESULTS Region 4 High School Summary Tables - Weighted Data Table 21. Percentage of students who had ever been physically forced to have sexual intercourse when they did not want to Total
Age
Grade
Race/Ethnicity
Male
Female
Percentage
95% confidence interval
Percentage
95% confidence interval
Percentage
95% confidence interval
Total
6.6
( 5.4 - 7.7 )
5.1
( 4.0 - 6.2 )
8.1
( 6.2 - 10.0 )
15 or younger
5.6
( 4.2 - 6.9 )
5.1
( 3.1 - 7.1 )
6.0
( 2.6 - 9.4 )
16 or 17
6.8
( 5.3 - 8.4 )
4.4
( 2.1 - 6.7 )
9.3
( 6.3 - 12.3 )
18 or older
10.7
( 2.3 - 19.0 )
8.5
( 0.3 - 16.7 )
14.0
( 1.2 - 26.9 )
9th
5.4
( 3.1 - 7.6 )
4.8
( 1.4 - 8.1 )
6.0
( 1.0 - 11.0 )
10th
5.7
( 4.2 - 7.3 )
4.7
( 0.7 - 8.6 )
6.8
( 3.7 - 10.0 )
11th
6.4
( 4.4 - 8.4 )
4.1
( 1.2 - 7.0 )
9.0
( 5.9 - 12.0 )
12th
7.6
( 4.9 - 10.3 )
5.3
( 0.2 - 10.3 )
10.0
( 6.3 - 13.7 )
.
.
.
.
.
.
Asian*
8.4
( 0.0 - 16.9 )
.
.
.
.
Black/African American*
12.1
( 8.8 - 15.4 )
.
.
.
.
.
.
.
.
.
.
White*
4.7
( 3.3 - 6.2 )
2.4
( 1.2 - 3.7 )
7.2
( 5.1 - 9.2 )
White Hispanic
7.2
( 4.5 - 9.8 )
6.9
( 1.7 - 12.1 )
7.4
( 1.8 - 13.1 )
Other
12.0
( 7.9 - 16.0 )
9.8
( 4.8 - 14.8 )
13.4
( 4.1 - 22.8 )
American Indian/Alaska Native*
Native Hawaiian/Other Pacific Islander*
*Non-Hispanic. . = Less than 50 students in the subgroup. Version: HS21OCT2014
[email protected]
2013 HEALTHY KIDS COLORADO SURVEY RESULTS Region 4 High School Summary Tables - Weighted Data Table 22. Percentage of students who had been threatened or injured as a result of gang activity in the past 12 months Total
Age
Grade
Race/Ethnicity
Male
Female
Percentage
95% confidence interval
Percentage
95% confidence interval
Percentage
95% confidence interval
Total
5.1
( 3.1 - 7.1 )
6.2
( 3.4 - 8.9 )
3.9
( 1.6 - 6.2 )
15 or younger
5.1
( 1.7 - 8.5 )
5.1
( 0.2 - 10.1 )
5.1
( 2.2 - 8.1 )
16 or 17
4.3
( 2.7 - 5.8 )
5.1
( 2.7 - 7.6 )
3.0
( 0.7 - 5.3 )
18 or older
10.0
( 1.7 - 18.4 )
.
.
.
.
9th
8.6
( 2.6 - 14.5 )
9.9
( 0.8 - 18.9 )
7.2
( 4.0 - 10.5 )
10th
3.5
( 0.8 - 6.2 )
4.8
( 1.0 - 8.5 )
2.2
( 0.0 - 5.6 )
11th
2.0
( 0.3 - 3.7 )
2.6
( 0.2 - 5.0 )
0.6
( 0.0 - 1.8 )
12th
6.1
( 4.6 - 7.7 )
7.0
( 2.6 - 11.4 )
5.3
( 1.9 - 8.7 )
American Indian/Alaska Native*
.
.
.
.
.
.
Asian*
.
.
.
.
.
.
Black/African American*
.
.
.
.
.
.
Native Hawaiian/Other Pacific Islander*
.
.
.
.
.
.
White*
2.6
( 1.1 - 4.0 )
3.1
( 1.5 - 4.8 )
1.7
( 0.0 - 3.7 )
White Hispanic
8.6
( 3.9 - 13.3 )
.
.
.
.
Other
15.1
( 5.5 - 24.7 )
.
.
.
.
*Non-Hispanic. . = Less than 50 students in the subgroup. Version: HS21OCT2014
[email protected]
2013 HEALTHY KIDS COLORADO SURVEY RESULTS Region 4 High School Summary Tables - Weighted Data Table 23. Percentage of students who had ever been bullied on school property during the past 12 months Total
Age
Grade
Race/Ethnicity
Male
Female
Percentage
95% confidence interval
Percentage
95% confidence interval
Percentage
95% confidence interval
Total
20.7
( 17.0 - 24.5 )
17.7
( 13.2 - 22.1 )
23.9
( 20.3 - 27.5 )
15 or younger
23.6
( 18.1 - 29.1 )
20.0
( 14.3 - 25.7 )
27.2
( 21.9 - 32.6 )
16 or 17
18.6
( 14.5 - 22.7 )
15.6
( 10.5 - 20.8 )
21.4
( 15.7 - 27.1 )
18 or older
17.6
( 12.3 - 22.9 )
17.0
( 8.6 - 25.5 )
18.5
( 10.2 - 26.9 )
9th
26.5
( 17.7 - 35.2 )
22.5
( 14.9 - 30.0 )
30.6
( 20.2 - 41.1 )
10th
19.1
( 12.9 - 25.2 )
14.6
( 7.0 - 22.1 )
23.7
( 16.9 - 30.4 )
11th
20.3
( 17.7 - 23.0 )
16.6
( 12.5 - 20.6 )
24.1
( 18.6 - 29.6 )
12th
15.8
( 10.5 - 21.1 )
14.9
( 8.9 - 21.0 )
16.6
( 10.8 - 22.4 )
.
.
.
.
.
.
Asian*
15.1
( 7.3 - 22.9 )
.
.
.
.
Black/African American*
23.2
( 6.6 - 39.8 )
.
.
.
.
.
.
.
.
.
.
White*
19.3
( 15.4 - 23.1 )
16.5
( 13.0 - 20.0 )
22.1
( 17.9 - 26.2 )
White Hispanic
24.6
( 18.0 - 31.3 )
18.4
( 8.8 - 28.0 )
30.9
( 21.4 - 40.4 )
Other
28.6
( 23.1 - 34.0 )
23.9
( 20.5 - 27.4 )
32.6
( 23.6 - 41.6 )
American Indian/Alaska Native*
Native Hawaiian/Other Pacific Islander*
*Non-Hispanic. . = Less than 50 students in the subgroup. Version: HS21OCT2014
[email protected]
2013 HEALTHY KIDS COLORADO SURVEY RESULTS Region 4 High School Summary Tables - Weighted Data Table 24. Percentage of students who had ever been electronically bullied during the past 12 months Total
Age
Grade
Race/Ethnicity
Male
Female
Percentage
95% confidence interval
Percentage
95% confidence interval
Percentage
95% confidence interval
Total
16.0
( 12.5 - 19.5 )
11.3
( 7.4 - 15.2 )
21.0
( 17.7 - 24.3 )
15 or younger
17.9
( 13.3 - 22.6 )
12.2
( 8.0 - 16.5 )
23.6
( 19.2 - 28.1 )
16 or 17
14.9
( 10.3 - 19.4 )
10.5
( 4.3 - 16.6 )
19.4
( 14.9 - 24.0 )
18 or older
12.1
( 5.4 - 18.8 )
11.4
( 4.4 - 18.5 )
13.1
( 3.6 - 22.5 )
9th
19.7
( 12.3 - 27.0 )
12.9
( 6.3 - 19.6 )
26.6
( 18.6 - 34.5 )
10th
15.7
( 12.7 - 18.8 )
10.8
( 8.6 - 13.1 )
21.0
( 15.9 - 26.2 )
11th
13.0
( 8.6 - 17.3 )
6.3
( 1.9 - 10.7 )
20.0
( 14.8 - 25.3 )
12th
14.2
( 7.9 - 20.5 )
12.2
( 3.8 - 20.7 )
16.1
( 10.0 - 22.2 )
.
.
.
.
.
.
Asian*
11.0
( 4.7 - 17.3 )
.
.
.
.
Black/African American*
8.6
( 0.6 - 16.7 )
.
.
.
.
.
.
.
.
.
.
White*
15.1
( 11.3 - 18.9 )
8.3
( 4.0 - 12.7 )
22.4
( 19.4 - 25.4 )
White Hispanic
20.5
( 11.7 - 29.2 )
19.2
( 10.0 - 28.5 )
21.7
( 11.6 - 31.8 )
Other
23.7
( 16.4 - 30.9 )
13.1
( 6.4 - 19.8 )
33.4
( 23.6 - 43.2 )
American Indian/Alaska Native*
Native Hawaiian/Other Pacific Islander*
*Non-Hispanic. . = Less than 50 students in the subgroup. Version: HS21OCT2014
[email protected]
2013 HEALTHY KIDS COLORADO SURVEY RESULTS Region 4 High School Summary Tables - Weighted Data Table 25. Percentage of students who had been teased or name called because of race or ethnic background in the past 12 months Total
Age
Grade
Race/Ethnicity
Male
Female
Percentage
95% confidence interval
Percentage
95% confidence interval
Percentage
95% confidence interval
Total
11.6
( 9.5 - 13.7 )
14.1
( 11.2 - 17.0 )
9.2
( 5.5 - 12.8 )
15 or younger
12.1
( 9.1 - 15.0 )
11.9
( 7.1 - 16.7 )
12.4
( 7.5 - 17.2 )
16 or 17
11.0
( 7.4 - 14.5 )
15.5
( 11.8 - 19.2 )
6.3
( 0.6 - 12.0 )
18 or older
13.0
( 5.0 - 21.1 )
.
.
.
.
9th
12.9
( 9.0 - 16.8 )
11.7
( 6.3 - 17.2 )
14.2
( 6.1 - 22.2 )
10th
10.1
( 7.0 - 13.1 )
12.0
( 7.8 - 16.3 )
8.1
( 2.2 - 14.0 )
11th
8.6
( 5.1 - 12.2 )
13.2
( 9.7 - 16.6 )
3.9
( 0.0 - 9.8 )
12th
14.5
( 9.3 - 19.6 )
19.1
( 10.1 - 28.0 )
10.0
( 0.1 - 19.8 )
American Indian/Alaska Native*
.
.
.
.
.
.
Asian*
.
.
.
.
.
.
Black/African American*
.
.
.
.
.
.
Native Hawaiian/Other Pacific Islander*
.
.
.
.
.
.
White*
6.9
( 4.5 - 9.3 )
10.1
( 6.6 - 13.6 )
3.6
( 0.6 - 6.6 )
White Hispanic
13.2
( 11.1 - 15.3 )
.
.
.
.
Other
25.9
( 14.9 - 36.9 )
.
.
.
.
*Non-Hispanic. . = Less than 50 students in the subgroup. Version: HS21OCT2014
[email protected]
2013 HEALTHY KIDS COLORADO SURVEY RESULTS Region 4 High School Summary Tables - Weighted Data Table 26. Percentage of students who had been teased or name called because of perceived sexual orientation in the past 12 months Total
Age
Grade
Race/Ethnicity
Male
Female
Percentage
95% confidence interval
Percentage
95% confidence interval
Percentage
95% confidence interval
Total
9.0
( 6.4 - 11.6 )
11.7
( 7.5 - 15.9 )
6.4
( 4.9 - 7.8 )
15 or younger
10.6
( 6.2 - 15.1 )
12.2
( 6.0 - 18.5 )
9.2
( 4.3 - 14.1 )
16 or 17
6.2
( 4.0 - 8.4 )
8.4
( 5.9 - 10.8 )
4.0
( 0.0 - 8.6 )
18 or older
17.4
( 3.0 - 31.8 )
.
.
.
.
9th
15.4
( 9.5 - 21.3 )
16.7
( 8.6 - 24.7 )
14.0
( 7.8 - 20.3 )
10th
7.7
( 4.7 - 10.7 )
11.2
( 5.8 - 16.6 )
4.1
( 0.5 - 7.7 )
11th
4.3
( 3.0 - 5.5 )
7.7
( 5.9 - 9.5 )
0.7
( 0.0 - 1.9 )
12th
8.4
( 3.5 - 13.4 )
11.0
( 2.5 - 19.6 )
6.0
( 0.7 - 11.2 )
American Indian/Alaska Native*
.
.
.
.
.
.
Asian*
.
.
.
.
.
.
Black/African American*
.
.
.
.
.
.
Native Hawaiian/Other Pacific Islander*
.
.
.
.
.
.
White*
7.6
( 5.4 - 9.7 )
10.5
( 6.6 - 14.3 )
4.6
( 1.6 - 7.6 )
White Hispanic
11.5
( 5.9 - 17.1 )
.
.
.
.
Other
8.9
( 6.0 - 11.7 )
.
.
.
.
*Non-Hispanic. . = Less than 50 students in the subgroup. Version: HS21OCT2014
[email protected]
2013 HEALTHY KIDS COLORADO SURVEY RESULTS Region 4 High School Summary Tables - Weighted Data Table 27. Percentage of students who reported their mental health as not good one or more days during the past 30 days Total
Age
Grade
Race/Ethnicity
Male
Female
Percentage
95% confidence interval
Percentage
95% confidence interval
Percentage
95% confidence interval
Total
66.0
( 58.2 - 73.9 )
57.4
( 48.9 - 65.9 )
75.2
( 66.7 - 83.7 )
15 or younger
62.8
( 54.8 - 70.9 )
54.7
( 43.9 - 65.6 )
70.9
( 63.3 - 78.4 )
16 or 17
67.8
( 59.1 - 76.6 )
58.4
( 50.7 - 66.1 )
77.9
( 66.3 - 89.5 )
18 or older
72.4
( 62.5 - 82.4 )
.
.
.
.
9th
59.8
( 50.9 - 68.8 )
49.9
( 38.2 - 61.6 )
70.2
( 63.3 - 77.0 )
10th
64.8
( 56.1 - 73.5 )
55.9
( 45.6 - 66.2 )
75.0
( 64.4 - 85.6 )
11th
68.5
( 56.9 - 80.1 )
60.8
( 50.7 - 70.9 )
77.1
( 63.2 - 91.0 )
12th
70.8
( 61.5 - 80.0 )
62.7
( 53.3 - 72.1 )
78.6
( 60.8 - 96.4 )
American Indian/Alaska Native*
.
.
.
.
.
.
Asian*
.
.
.
.
.
.
Black/African American*
.
.
.
.
.
.
Native Hawaiian/Other Pacific Islander*
.
.
.
.
.
.
White*
64.2
( 56.3 - 72.0 )
53.5
( 44.3 - 62.8 )
75.5
( 67.2 - 83.8 )
White Hispanic
66.3
( 53.6 - 79.0 )
.
.
.
.
Other
76.3
( 67.9 - 84.7 )
.
.
.
.
*Non-Hispanic. . = Less than 50 students in the subgroup. Version: HS21OCT2014
[email protected]
2013 HEALTHY KIDS COLORADO SURVEY RESULTS Region 4 High School Summary Tables - Weighted Data Table 28. Percentage of students who felt so sad or hopeless almost every day for two weeks or more in a row that they stopped doing some usual activities during the past 12 months Total
Age
Grade
Race/Ethnicity
Male
Female
Percentage
95% confidence interval
Percentage
95% confidence interval
Percentage
95% confidence interval
Total
21.3
( 17.3 - 25.3 )
17.1
( 13.8 - 20.3 )
25.8
( 20.5 - 31.1 )
15 or younger
21.1
( 16.6 - 25.7 )
13.1
( 9.8 - 16.5 )
29.2
( 22.2 - 36.3 )
16 or 17
21.2
( 16.6 - 25.8 )
19.3
( 14.4 - 24.2 )
23.0
( 17.1 - 28.9 )
18 or older
23.6
( 17.4 - 29.9 )
24.8
( 18.0 - 31.7 )
21.8
( 9.2 - 34.5 )
9th
17.2
( 10.5 - 23.9 )
10.8
( 5.5 - 16.1 )
23.8
( 15.0 - 32.7 )
10th
24.1
( 16.6 - 31.5 )
13.0
( 9.2 - 16.9 )
35.6
( 25.6 - 45.7 )
11th
22.3
( 16.3 - 28.2 )
21.4
( 12.8 - 30.0 )
23.2
( 15.3 - 31.2 )
12th
20.7
( 17.1 - 24.3 )
21.2
( 15.9 - 26.4 )
20.3
( 14.8 - 25.7 )
.
.
.
.
.
.
Asian*
22.1
( 14.5 - 29.6 )
.
.
.
.
Black/African American*
28.5
( 15.2 - 41.9 )
.
.
.
.
.
.
.
.
.
.
White*
18.3
( 14.1 - 22.4 )
13.7
( 8.9 - 18.5 )
23.1
( 18.4 - 27.8 )
White Hispanic
27.7
( 22.2 - 33.2 )
19.8
( 14.3 - 25.3 )
35.4
( 26.6 - 44.2 )
Other
26.4
( 21.3 - 31.5 )
19.6
( 13.2 - 25.9 )
32.5
( 24.2 - 40.9 )
American Indian/Alaska Native*
Native Hawaiian/Other Pacific Islander*
*Non-Hispanic. . = Less than 50 students in the subgroup. Version: HS21OCT2014
[email protected]
2013 HEALTHY KIDS COLORADO SURVEY RESULTS Region 4 High School Summary Tables - Weighted Data Table 29. Percentage of students who seriously considered attempting suicide during the past 12 months Total
Age
Grade
Race/Ethnicity
Male
Female
Percentage
95% confidence interval
Percentage
95% confidence interval
Percentage
95% confidence interval
Total
14.5
( 10.4 - 18.5 )
10.2
( 7.0 - 13.4 )
18.9
( 14.5 - 23.4 )
15 or younger
15.2
( 10.9 - 19.5 )
7.7
( 5.9 - 9.4 )
22.9
( 16.1 - 29.6 )
16 or 17
13.6
( 9.8 - 17.5 )
10.3
( 5.5 - 15.1 )
16.9
( 13.3 - 20.5 )
18 or older
15.6
( 9.0 - 22.2 )
21.6
( 11.9 - 31.3 )
6.3
( 2.5 - 10.2 )
9th
12.2
( 7.5 - 17.0 )
5.9
( 3.4 - 8.5 )
18.8
( 12.1 - 25.4 )
10th
15.1
( 10.3 - 19.9 )
7.6
( 4.9 - 10.3 )
23.1
( 17.0 - 29.3 )
11th
14.5
( 9.5 - 19.5 )
12.4
( 4.9 - 19.9 )
16.7
( 10.5 - 22.8 )
12th
15.4
( 10.7 - 20.1 )
13.5
( 8.7 - 18.3 )
17.3
( 12.0 - 22.7 )
.
.
.
.
.
.
Asian*
9.4
( 1.2 - 17.6 )
.
.
.
.
Black/African American*
31.0
( 17.6 - 44.3 )
.
.
.
.
.
.
.
.
.
.
White*
12.7
( 9.6 - 15.7 )
8.7
( 5.0 - 12.4 )
16.8
( 12.9 - 20.8 )
White Hispanic
12.3
( 7.9 - 16.7 )
6.8
( 3.3 - 10.3 )
17.9
( 10.8 - 25.0 )
Other
21.7
( 17.3 - 26.1 )
12.0
( 6.4 - 17.6 )
31.1
( 22.8 - 39.4 )
American Indian/Alaska Native*
Native Hawaiian/Other Pacific Islander*
*Non-Hispanic. . = Less than 50 students in the subgroup. Version: HS21OCT2014
[email protected]
2013 HEALTHY KIDS COLORADO SURVEY RESULTS Region 4 High School Summary Tables - Weighted Data Table 30. Percentage of students who made a plan about how they would attempt suicide during the past 12 months Total
Age
Grade
Race/Ethnicity
Male
Female
Percentage
95% confidence interval
Percentage
95% confidence interval
Percentage
95% confidence interval
Total
11.5
( 8.3 - 14.7 )
9.7
( 6.7 - 12.7 )
13.5
( 10.0 - 17.0 )
15 or younger
11.4
( 7.9 - 14.8 )
6.3
( 4.4 - 8.2 )
16.6
( 11.3 - 21.9 )
16 or 17
11.0
( 7.6 - 14.3 )
11.0
( 6.8 - 15.1 )
11.0
( 7.7 - 14.2 )
18 or older
15.8
( 7.2 - 24.5 )
19.5
( 6.8 - 32.2 )
10.2
( 3.6 - 16.8 )
9th
10.3
( 6.3 - 14.3 )
6.1
( 2.4 - 9.8 )
14.7
( 9.9 - 19.4 )
10th
11.5
( 7.4 - 15.5 )
6.0
( 4.5 - 7.5 )
17.4
( 10.4 - 24.5 )
11th
12.1
( 7.0 - 17.1 )
13.5
( 9.3 - 17.8 )
10.6
( 3.8 - 17.4 )
12th
12.3
( 8.3 - 16.2 )
13.2
( 6.8 - 19.7 )
11.2
( 7.9 - 14.6 )
.
.
.
.
.
.
Asian*
3.0
( 0.0 - 6.3 )
.
.
.
.
Black/African American*
20.7
( 6.3 - 35.1 )
.
.
.
.
.
.
.
.
.
.
White*
10.2
( 7.5 - 12.9 )
7.6
( 4.4 - 10.7 )
13.1
( 9.2 - 17.1 )
White Hispanic
10.4
( 5.9 - 14.9 )
10.1
( 6.1 - 14.1 )
10.7
( 4.0 - 17.4 )
Other
18.7
( 16.0 - 21.4 )
14.6
( 8.2 - 20.9 )
23.1
( 15.5 - 30.7 )
American Indian/Alaska Native*
Native Hawaiian/Other Pacific Islander*
*Non-Hispanic. . = Less than 50 students in the subgroup. Version: HS21OCT2014
[email protected]
2013 HEALTHY KIDS COLORADO SURVEY RESULTS Region 4 High School Summary Tables - Weighted Data Table 31. Percentage of students who actually attempted suicide one or more times during the past 12 months Total
Age
Grade
Race/Ethnicity
Male
Female
Percentage
95% confidence interval
Percentage
95% confidence interval
Percentage
95% confidence interval
Total
5.3
( 3.8 - 6.8 )
3.4
( 2.3 - 4.5 )
7.3
( 5.2 - 9.4 )
15 or younger
6.5
( 5.1 - 8.0 )
2.5
( 1.2 - 3.8 )
10.7
( 7.5 - 13.8 )
16 or 17
4.1
( 2.6 - 5.6 )
3.2
( 1.3 - 5.1 )
4.9
( 3.8 - 6.1 )
18 or older
5.7
( 0.0 - 12.3 )
8.9
( 0.0 - 18.7 )
1.0
( 0.0 - 2.5 )
9th
6.4
( 3.3 - 9.5 )
1.9
( 0.3 - 3.6 )
10.9
( 6.2 - 15.6 )
10th
5.9
( 3.6 - 8.1 )
3.1
( 0.8 - 5.4 )
8.9
( 5.1 - 12.7 )
11th
4.3
( 2.2 - 6.3 )
3.9
( 1.1 - 6.7 )
4.6
( 1.0 - 8.3 )
12th
4.1
( 1.5 - 6.7 )
3.7
( 0.0 - 8.9 )
4.5
( 1.4 - 7.6 )
.
.
.
.
.
.
Asian*
2.8
( 0.0 - 5.8 )
.
.
.
.
Black/African American*
9.8
( 6.4 - 13.2 )
.
.
.
.
.
.
.
.
.
.
White*
4.7
( 3.5 - 6.0 )
2.9
( 1.4 - 4.3 )
6.7
( 4.7 - 8.6 )
White Hispanic
4.2
( 2.0 - 6.4 )
2.4
( 0.0 - 5.8 )
6.0
( 2.3 - 9.7 )
Other
9.9
( 4.9 - 14.9 )
3.4
( 0.2 - 6.6 )
16.6
( 6.1 - 27.0 )
American Indian/Alaska Native*
Native Hawaiian/Other Pacific Islander*
*Non-Hispanic. . = Less than 50 students in the subgroup. Version: HS21OCT2014
[email protected]
2013 HEALTHY KIDS COLORADO SURVEY RESULTS Region 4 High School Summary Tables - Weighted Data Table 32. Percentage of students who made a suicide attempt during the past 12 months that resulted in an injury, poisoning, or overdose that had to be treated by a doctor or nurse Total
Age
Grade
Race/Ethnicity
Male
Female
Percentage
95% confidence interval
Percentage
95% confidence interval
Percentage
95% confidence interval
Total
1.9
( 1.1 - 2.6 )
1.1
( 0.4 - 1.9 )
2.6
( 1.4 - 3.9 )
15 or younger
2.2
( 1.1 - 3.2 )
0.4
( 0.0 - 0.8 )
4.0
( 2.1 - 5.8 )
16 or 17
1.6
( 0.9 - 2.3 )
1.5
( 0.8 - 2.2 )
1.7
( 0.8 - 2.7 )
18 or older
1.8
( 0.0 - 4.5 )
2.9
( 0.0 - 7.4 )
0.0
( 0.0 - 0.0 )
9th
1.9
( 0.3 - 3.5 )
0.2
( 0.0 - 0.7 )
3.6
( 0.6 - 6.6 )
10th
2.2
( 0.8 - 3.6 )
1.0
( 0.0 - 2.2 )
3.6
( 0.9 - 6.2 )
11th
2.0
( 0.4 - 3.5 )
2.2
( 0.6 - 3.7 )
1.8
( 0.0 - 5.1 )
12th
1.4
( 0.3 - 2.4 )
1.4
( 0.0 - 3.4 )
1.4
( 0.1 - 2.7 )
.
.
.
.
.
.
Asian*
0.0
( 0.0 - 0.0 )
.
.
.
.
Black/African American*
1.2
( 0.0 - 3.6 )
.
.
.
.
.
.
.
.
.
.
White*
1.7
( 1.1 - 2.4 )
0.9
( 0.3 - 1.6 )
2.5
( 1.5 - 3.6 )
White Hispanic
3.0
( 1.0 - 5.0 )
2.4
( 0.0 - 5.8 )
3.6
( 0.2 - 7.0 )
Other
1.8
( 0.0 - 3.6 )
0.6
( 0.0 - 1.6 )
3.0
( 0.0 - 6.1 )
American Indian/Alaska Native*
Native Hawaiian/Other Pacific Islander*
*Non-Hispanic. . = Less than 50 students in the subgroup. Version: HS21OCT2014
[email protected]
2013 HEALTHY KIDS COLORADO SURVEY RESULTS Region 4 High School Summary Tables - Weighted Data Table 33. Percentage of students who have ever smoked a whole cigarette Total
Age
Grade
Race/Ethnicity
Male
Female
Percentage
95% confidence interval
Percentage
95% confidence interval
Percentage
95% confidence interval
Total
19.3
( 14.9 - 23.7 )
22.4
( 16.5 - 28.3 )
16.0
( 12.1 - 19.9 )
15 or younger
14.5
( 7.3 - 21.8 )
16.4
( 8.1 - 24.7 )
12.4
( 5.8 - 19.0 )
16 or 17
22.4
( 18.2 - 26.5 )
25.4
( 20.6 - 30.2 )
19.4
( 14.7 - 24.0 )
18 or older
28.5
( 17.1 - 39.8 )
35.9
( 20.7 - 51.2 )
16.8
( 9.1 - 24.6 )
9th
9.1
( 3.6 - 14.6 )
10.3
( 1.7 - 18.8 )
7.9
( 3.8 - 12.1 )
10th
22.4
( 15.8 - 28.9 )
25.5
( 20.3 - 30.7 )
19.2
( 9.5 - 28.8 )
11th
19.4
( 14.9 - 23.9 )
21.4
( 15.2 - 27.6 )
17.4
( 12.7 - 22.1 )
12th
24.8
( 18.2 - 31.4 )
30.0
( 20.3 - 39.7 )
19.6
( 14.5 - 24.7 )
.
.
.
.
.
.
Asian*
15.2
( 6.7 - 23.8 )
.
.
.
.
Black/African American*
30.4
( 23.6 - 37.2 )
.
.
.
.
.
.
.
.
.
.
White*
15.6
( 11.9 - 19.4 )
17.2
( 12.3 - 22.2 )
14.0
( 10.8 - 17.2 )
White Hispanic
23.0
( 11.5 - 34.5 )
28.7
( 13.8 - 43.7 )
17.3
( 5.5 - 29.2 )
Other
31.4
( 22.5 - 40.2 )
35.9
( 22.8 - 49.0 )
26.3
( 17.6 - 34.9 )
American Indian/Alaska Native*
Native Hawaiian/Other Pacific Islander*
*Non-Hispanic. . = Less than 50 students in the subgroup. Version: HS21OCT2014
[email protected]
2013 HEALTHY KIDS COLORADO SURVEY RESULTS Region 4 High School Summary Tables - Weighted Data Table 34. Percentage of students who smoked a whole cigarette for the first time before age 13 years Total
Age
Grade
Race/Ethnicity
Male
Female
Percentage
95% confidence interval
Percentage
95% confidence interval
Percentage
95% confidence interval
Total
5.4
( 3.8 - 7.0 )
7.6
( 4.8 - 10.4 )
3.0
( 2.1 - 4.0 )
15 or younger
6.1
( 4.1 - 8.1 )
8.0
( 4.9 - 11.1 )
4.1
( 2.7 - 5.5 )
16 or 17
3.7
( 2.5 - 4.9 )
5.5
( 2.7 - 8.3 )
1.9
( 1.4 - 2.4 )
18 or older
11.3
( 4.3 - 18.3 )
16.1
( 6.7 - 25.5 )
3.9
( 0.0 - 10.1 )
9th
4.9
( 1.9 - 8.0 )
5.9
( 1.3 - 10.4 )
4.0
( 1.5 - 6.4 )
10th
6.0
( 4.0 - 8.0 )
7.7
( 4.1 - 11.4 )
4.2
( 2.7 - 5.7 )
11th
3.3
( 2.6 - 4.1 )
5.3
( 4.4 - 6.2 )
1.3
( 0.4 - 2.2 )
12th
5.3
( 2.4 - 8.1 )
8.1
( 2.1 - 14.1 )
2.4
( 1.1 - 3.7 )
.
.
.
.
.
.
Asian*
1.7
( 0.0 - 5.0 )
.
.
.
.
Black/African American*
10.5
( 3.1 - 17.9 )
.
.
.
.
.
.
.
.
.
.
White*
3.3
( 2.2 - 4.5 )
4.2
( 2.2 - 6.1 )
2.5
( 1.7 - 3.2 )
White Hispanic
6.1
( 1.7 - 10.4 )
10.6
( 1.0 - 20.2 )
1.5
( 0.0 - 3.3 )
Other
15.9
( 8.3 - 23.6 )
18.0
( 9.8 - 26.2 )
13.2
( 4.1 - 22.4 )
American Indian/Alaska Native*
Native Hawaiian/Other Pacific Islander*
*Non-Hispanic. . = Less than 50 students in the subgroup. Version: HS21OCT2014
[email protected]
2013 HEALTHY KIDS COLORADO SURVEY RESULTS Region 4 High School Summary Tables - Weighted Data Table 35. Percentage of students who smoked cigarettes on one or more of the past 30 days Total
Age
Grade
Race/Ethnicity
Male
Female
Percentage
95% confidence interval
Percentage
95% confidence interval
Percentage
95% confidence interval
Total
10.2
( 6.9 - 13.5 )
11.8
( 6.5 - 17.2 )
8.5
( 6.1 - 10.9 )
15 or younger
7.7
( 3.7 - 11.7 )
8.3
( 1.9 - 14.6 )
7.2
( 4.1 - 10.2 )
16 or 17
11.2
( 6.9 - 15.5 )
12.9
( 7.2 - 18.5 )
9.5
( 5.7 - 13.3 )
18 or older
18.1
( 10.0 - 26.2 )
23.2
( 10.2 - 36.3 )
10.0
( 2.9 - 17.1 )
9th
5.4
( 1.2 - 9.6 )
4.1
( 0.0 - 8.9 )
6.8
( 2.6 - 11.0 )
10th
9.4
( 5.5 - 13.3 )
11.3
( 4.6 - 17.9 )
7.5
( 4.3 - 10.7 )
11th
12.0
( 7.1 - 16.9 )
14.5
( 7.8 - 21.2 )
9.4
( 5.6 - 13.2 )
12th
13.3
( 8.4 - 18.1 )
16.3
( 8.7 - 23.8 )
10.2
( 5.8 - 14.7 )
.
.
.
.
.
.
Asian*
8.9
( 0.2 - 17.7 )
.
.
.
.
Black/African American*
15.2
( 1.4 - 28.9 )
.
.
.
.
.
.
.
.
.
.
White*
8.4
( 5.2 - 11.6 )
9.2
( 4.8 - 13.7 )
7.5
( 4.9 - 10.2 )
White Hispanic
10.1
( 1.7 - 18.4 )
12.4
( 0.0 - 26.0 )
7.9
( 2.6 - 13.2 )
Other
20.5
( 10.1 - 30.9 )
20.6
( 9.6 - 31.5 )
19.9
( 8.4 - 31.3 )
American Indian/Alaska Native*
Native Hawaiian/Other Pacific Islander*
*Non-Hispanic. . = Less than 50 students in the subgroup. Version: HS21OCT2014
[email protected]
2013 HEALTHY KIDS COLORADO SURVEY RESULTS Region 4 High School Summary Tables - Weighted Data Table 36. Percentage of students who smoked cigarettes on 20 or more of the past 30 days Total
Age
Grade
Race/Ethnicity
Male
Female
Percentage
95% confidence interval
Percentage
95% confidence interval
Percentage
95% confidence interval
Total
3.8
( 2.4 - 5.3 )
4.9
( 2.5 - 7.2 )
2.7
( 1.4 - 4.0 )
15 or younger
2.3
( 1.0 - 3.6 )
2.8
( 0.4 - 5.3 )
1.7
( 0.6 - 2.8 )
16 or 17
4.1
( 1.9 - 6.3 )
4.7
( 2.9 - 6.6 )
3.4
( 0.2 - 6.7 )
18 or older
10.7
( 3.2 - 18.1 )
14.9
( 4.9 - 24.9 )
3.9
( 0.0 - 10.3 )
9th
1.5
( 0.0 - 3.0 )
1.0
( 0.0 - 2.6 )
2.0
( 0.1 - 3.9 )
10th
1.8
( 0.5 - 3.1 )
2.2
( 0.0 - 4.8 )
1.4
( 0.5 - 2.3 )
11th
3.6
( 2.0 - 5.1 )
4.8
( 2.8 - 6.9 )
2.3
( 0.3 - 4.2 )
12th
7.3
( 4.6 - 10.0 )
9.7
( 4.5 - 14.9 )
4.9
( 0.8 - 9.0 )
.
.
.
.
.
.
Asian*
2.7
( 0.0 - 7.5 )
.
.
.
.
Black/African American*
10.3
( 0.2 - 20.4 )
.
.
.
.
.
.
.
.
.
.
White*
2.4
( 1.0 - 3.7 )
2.8
( 0.9 - 4.7 )
1.8
( 0.6 - 3.1 )
White Hispanic
4.2
( 1.8 - 6.6 )
6.9
( 1.8 - 12.0 )
1.6
( 0.0 - 3.4 )
Other
8.6
( 1.2 - 15.9 )
10.6
( 5.2 - 16.0 )
5.8
( 0.0 - 16.4 )
American Indian/Alaska Native*
Native Hawaiian/Other Pacific Islander*
*Non-Hispanic. . = Less than 50 students in the subgroup. Version: HS21OCT2014
[email protected]
2013 HEALTHY KIDS COLORADO SURVEY RESULTS Region 4 High School Summary Tables - Weighted Data Table 37. Percentage of students who smoked cigarettes or cigars, used chewing tobacco, snuff, or dip on one or more of past 30 days Total
Age
Grade
Race/Ethnicity
Male
Female
Percentage
95% confidence interval
Percentage
95% confidence interval
Percentage
95% confidence interval
Total
18.2
( 13.5 - 23.0 )
24.2
( 18.7 - 29.8 )
12.2
( 5.4 - 18.9 )
15 or younger
11.2
( 7.0 - 15.4 )
13.5
( 7.5 - 19.4 )
9.1
( 4.4 - 13.8 )
16 or 17
22.2
( 15.3 - 29.1 )
29.8
( 25.3 - 34.3 )
14.3
( 2.8 - 25.8 )
18 or older
34.0
( 16.8 - 51.2 )
.
.
.
.
9th
10.8
( 5.2 - 16.4 )
12.8
( 3.1 - 22.5 )
8.8
( 1.2 - 16.5 )
10th
14.4
( 10.5 - 18.3 )
20.6
( 15.0 - 26.1 )
8.1
( 2.8 - 13.3 )
11th
21.3
( 13.7 - 29.0 )
29.7
( 22.6 - 36.7 )
12.6
( 0.0 - 26.6 )
12th
27.1
( 17.5 - 36.6 )
34.4
( 20.1 - 48.8 )
19.7
( 8.5 - 31.0 )
American Indian/Alaska Native*
.
.
.
.
.
.
Asian*
.
.
.
.
.
.
Black/African American*
.
.
.
.
.
.
Native Hawaiian/Other Pacific Islander*
.
.
.
.
.
.
White*
16.0
( 10.7 - 21.4 )
21.5
( 14.2 - 28.7 )
10.3
( 4.7 - 15.9 )
White Hispanic
24.0
( 14.8 - 33.1 )
.
.
.
.
Other
28.2
( 14.8 - 41.5 )
.
.
.
.
*Non-Hispanic. . = Less than 50 students in the subgroup. Version: HS21OCT2014
[email protected]
2013 HEALTHY KIDS COLORADO SURVEY RESULTS Region 4 High School Summary Tables - Weighted Data Table 38. Percentage of students who feel it would be sort of easy or very easy to get cigarettes if they wanted Total
Age
Grade
Race/Ethnicity
Male
Female
Percentage
95% confidence interval
Percentage
95% confidence interval
Percentage
95% confidence interval
Total
55.4
( 48.2 - 62.6 )
58.9
( 49.6 - 68.3 )
51.6
( 45.8 - 57.3 )
15 or younger
48.1
( 38.6 - 57.7 )
51.6
( 42.9 - 60.2 )
44.3
( 31.6 - 57.0 )
16 or 17
57.7
( 48.2 - 67.2 )
60.8
( 45.5 - 76.1 )
54.7
( 47.2 - 62.1 )
18 or older
83.4
( 78.0 - 88.7 )
.
.
.
.
9th
34.9
( 27.6 - 42.3 )
43.5
( 36.3 - 50.6 )
26.0
( 13.4 - 38.6 )
10th
57.8
( 51.8 - 63.8 )
57.2
( 46.5 - 67.8 )
58.5
( 52.5 - 64.4 )
11th
54.2
( 43.6 - 64.9 )
59.4
( 45.1 - 73.8 )
48.7
( 30.6 - 66.9 )
12th
74.2
( 64.9 - 83.4 )
75.8
( 61.6 - 90.0 )
72.5
( 65.5 - 79.6 )
American Indian/Alaska Native*
.
.
.
.
.
.
Asian*
.
.
.
.
.
.
Black/African American*
.
.
.
.
.
.
Native Hawaiian/Other Pacific Islander*
.
.
.
.
.
.
White*
51.9
( 40.7 - 63.1 )
53.1
( 39.2 - 67.0 )
50.5
( 42.1 - 59.0 )
White Hispanic
53.5
( 38.9 - 68.1 )
.
.
.
.
Other
68.7
( 63.6 - 73.8 )
73.8
( 62.7 - 84.9 )
63.0
( 52.5 - 73.5 )
*Non-Hispanic. . = Less than 50 students in the subgroup. Version: HS21OCT2014
[email protected]
2013 HEALTHY KIDS COLORADO SURVEY RESULTS Region 4 High School Summary Tables - Weighted Data Table 39. Among students who were less than 18 years of age and who reported current cigarette use, the percentage who usually got their own cigarettes by buying them in a store or gas station during the past 30 days Total
Age
Grade
Race/Ethnicity
Male
Female
Percentage
95% confidence interval
Percentage
95% confidence interval
Percentage
95% confidence interval
Total
7.3
( 3.1 - 11.4 )
7.4
( 1.9 - 12.9 )
7.2
( 3.0 - 11.4 )
15 or younger
5.4
( 0.9 - 9.8 )
.
.
.
.
16 or 17
8.5
( 2.5 - 14.4 )
9.2
( 0.0 - 20.4 )
.
.
9th
.
.
.
.
.
.
10th
.
.
.
.
.
.
11th
7.9
( 0.0 - 18.1 )
.
.
.
.
12th
.
.
.
.
.
.
American Indian/Alaska Native*
.
.
.
.
.
.
Asian*
.
.
.
.
.
.
Black/African American*
.
.
.
.
.
.
Native Hawaiian/Other Pacific Islander*
.
.
.
.
.
.
6.0
( 3.0 - 8.9 )
.
.
.
.
White Hispanic
.
.
.
.
.
.
Other
.
.
.
.
.
.
White*
*Non-Hispanic. . = Less than 50 students in the subgroup. Version: HS21OCT2014
[email protected]
2013 HEALTHY KIDS COLORADO SURVEY RESULTS Region 4 High School Summary Tables - Weighted Data Table 40. Among students who reported current cigarette use, the percentage who ever tried to quit smoking cigarettes during the past 12 months Total 95% confidence interval
Percentage
95% confidence interval
Percentage
95% confidence interval
57.9
( 44.4 - 71.5 )
59.3
( 45.6 - 73.0 )
.
.
.
.
.
.
.
.
57.2
( 36.3 - 78.0 )
.
.
.
.
18 or older
.
.
.
.
.
.
9th
.
.
.
.
.
.
10th
.
.
.
.
.
.
11th
.
.
.
.
.
.
12th
.
.
.
.
.
.
American Indian/Alaska Native*
.
.
.
.
.
.
Asian*
.
.
.
.
.
.
Black/African American*
.
.
.
.
.
.
Native Hawaiian/Other Pacific Islander*
.
.
.
.
.
.
53.0
( 40.3 - 65.7 )
.
.
.
.
White Hispanic
.
.
.
.
.
.
Other
.
.
.
.
.
.
15 or younger 16 or 17
Grade
Race/Ethnicity
Female
Percentage
Total
Age
Male
White*
*Non-Hispanic. . = Less than 50 students in the subgroup. Version: HS21OCT2014
[email protected]
2013 HEALTHY KIDS COLORADO SURVEY RESULTS Region 4 High School Summary Tables - Weighted Data Table 41. Among students who reported current cigarette use, the percentage of students who want to quit smoking either eventually or soon Total
Grade
Race/Ethnicity
Female
Percentage
95% confidence interval
Percentage
95% confidence interval
Percentage
95% confidence interval
56.9
( 36.8 - 77.1 )
.
.
.
.
15 or younger
.
.
.
.
.
.
16 or 17
.
.
.
.
.
.
18 or older
.
.
.
.
.
.
9th
.
.
.
.
.
.
10th
.
.
.
.
.
.
11th
.
.
.
.
.
.
12th
.
.
.
.
.
.
American Indian/Alaska Native*
.
.
.
.
.
.
Asian*
.
.
.
.
.
.
Black/African American*
.
.
.
.
.
.
Native Hawaiian/Other Pacific Islander*
.
.
.
.
.
.
White*
.
.
.
.
.
.
White Hispanic
.
.
.
.
.
.
Other
.
.
.
.
.
.
Total
Age
Male
*Non-Hispanic. . = Less than 50 students in the subgroup. Version: HS21OCT2014
[email protected]
2013 HEALTHY KIDS COLORADO SURVEY RESULTS Region 4 High School Summary Tables - Weighted Data Table 42. Percentage of students who would definitely or probably smoke a cigarette offered by a friend Total
Age
Grade
Race/Ethnicity
Male
Female
Percentage
95% confidence interval
Percentage
95% confidence interval
Percentage
95% confidence interval
Total
14.2
( 12.0 - 16.4 )
16.3
( 13.4 - 19.2 )
12.1
( 7.5 - 16.7 )
15 or younger
11.9
( 8.2 - 15.6 )
12.6
( 6.6 - 18.6 )
11.4
( 7.1 - 15.7 )
16 or 17
14.4
( 8.8 - 20.0 )
15.9
( 13.2 - 18.6 )
12.6
( 4.1 - 21.2 )
18 or older
25.8
( 11.0 - 40.5 )
.
.
.
.
9th
11.0
( 8.0 - 13.9 )
13.8
( 8.4 - 19.2 )
8.2
( 2.1 - 14.2 )
10th
13.8
( 9.1 - 18.4 )
13.6
( 8.0 - 19.3 )
14.2
( 6.8 - 21.5 )
11th
13.1
( 7.0 - 19.3 )
17.0
( 11.4 - 22.6 )
8.5
( 0.0 - 18.1 )
12th
18.9
( 12.3 - 25.5 )
20.7
( 8.4 - 33.1 )
17.1
( 7.9 - 26.3 )
American Indian/Alaska Native*
.
.
.
.
.
.
Asian*
.
.
.
.
.
.
Black/African American*
.
.
.
.
.
.
Native Hawaiian/Other Pacific Islander*
.
.
.
.
.
.
White*
13.0
( 10.5 - 15.5 )
14.3
( 11.4 - 17.2 )
11.4
( 7.0 - 15.8 )
White Hispanic
14.3
( 11.2 - 17.4 )
.
.
.
.
Other
24.0
( 12.4 - 35.6 )
.
.
.
.
*Non-Hispanic. . = Less than 50 students in the subgroup. Version: HS21OCT2014
[email protected]
2013 HEALTHY KIDS COLORADO SURVEY RESULTS Region 4 High School Summary Tables - Weighted Data Table 43. Percentage of students who think they would definitely or probably smoke a cigarette over the next 12 months Total
Age
Grade
Race/Ethnicity
Male
Female
Percentage
95% confidence interval
Percentage
95% confidence interval
Percentage
95% confidence interval
Total
13.4
( 10.3 - 16.5 )
14.5
( 12.0 - 16.9 )
12.3
( 7.1 - 17.5 )
15 or younger
11.5
( 7.9 - 15.1 )
13.1
( 8.9 - 17.3 )
10.0
( 4.5 - 15.5 )
16 or 17
13.7
( 8.2 - 19.3 )
13.2
( 9.7 - 16.7 )
14.0
( 5.9 - 22.2 )
18 or older
21.9
( 11.6 - 32.2 )
.
.
.
.
9th
11.2
( 7.6 - 14.9 )
14.6
( 8.9 - 20.4 )
7.7
( 2.7 - 12.8 )
10th
10.3
( 6.5 - 14.0 )
10.6
( 6.0 - 15.3 )
10.0
( 3.2 - 16.8 )
11th
14.6
( 9.4 - 19.8 )
14.3
( 10.3 - 18.2 )
14.3
( 5.1 - 23.5 )
12th
17.2
( 11.4 - 23.0 )
17.7
( 8.9 - 26.5 )
16.7
( 9.3 - 24.2 )
American Indian/Alaska Native*
.
.
.
.
.
.
Asian*
.
.
.
.
.
.
Black/African American*
.
.
.
.
.
.
Native Hawaiian/Other Pacific Islander*
.
.
.
.
.
.
White*
12.6
( 9.3 - 15.8 )
14.1
( 12.1 - 16.2 )
10.7
( 5.9 - 15.6 )
White Hispanic
12.3
( 7.9 - 16.6 )
.
.
.
.
Other
20.8
( 9.0 - 32.6 )
.
.
.
.
*Non-Hispanic. . = Less than 50 students in the subgroup. Version: HS21OCT2014
[email protected]
2013 HEALTHY KIDS COLORADO SURVEY RESULTS Region 4 High School Summary Tables - Weighted Data Table 44. Percentage of students who used chewing tobacco, snuff, or dip on one or more of the past 30 days Total
Age
Grade
Race/Ethnicity
Male
Female
Percentage
95% confidence interval
Percentage
95% confidence interval
Percentage
95% confidence interval
Total
7.0
( 5.8 - 8.1 )
11.0
( 9.0 - 13.1 )
2.7
( 1.2 - 4.2 )
15 or younger
5.4
( 3.2 - 7.6 )
8.0
( 4.9 - 11.0 )
2.7
( 0.8 - 4.7 )
16 or 17
7.7
( 5.9 - 9.6 )
12.9
( 8.8 - 17.0 )
2.5
( 0.6 - 4.5 )
18 or older
11.3
( 5.4 - 17.2 )
16.4
( 7.8 - 25.0 )
3.4
( 0.0 - 8.0 )
9th
2.2
( 1.2 - 3.3 )
2.7
( 0.8 - 4.6 )
1.7
( 0.0 - 3.6 )
10th
6.0
( 5.4 - 6.7 )
10.1
( 7.4 - 12.8 )
1.7
( 0.0 - 3.5 )
11th
8.4
( 6.8 - 10.0 )
13.9
( 9.9 - 17.9 )
2.7
( 0.0 - 5.6 )
12th
9.6
( 4.0 - 15.3 )
14.7
( 6.6 - 22.9 )
4.5
( 0.3 - 8.8 )
.
.
.
.
.
.
Asian*
7.1
( 2.3 - 11.8 )
.
.
.
.
Black/African American*
11.6
( 0.0 - 24.1 )
.
.
.
.
.
.
.
.
.
.
White*
5.7
( 4.1 - 7.3 )
9.3
( 5.2 - 13.3 )
1.9
( 0.0 - 3.9 )
White Hispanic
6.3
( 2.8 - 9.9 )
11.1
( 4.2 - 18.0 )
1.5
( 0.0 - 3.3 )
Other
13.8
( 5.5 - 22.0 )
17.7
( 9.9 - 25.5 )
9.1
( 1.0 - 17.2 )
American Indian/Alaska Native*
Native Hawaiian/Other Pacific Islander*
*Non-Hispanic. . = Less than 50 students in the subgroup. Version: HS21OCT2014
[email protected]
2013 HEALTHY KIDS COLORADO SURVEY RESULTS Region 4 High School Summary Tables - Weighted Data Table 45. Percentage of students who smoked a cigar, cigarillo, or little cigar during the past 30 days Total
Age
Grade
Race/Ethnicity
Male
Female
Percentage
95% confidence interval
Percentage
95% confidence interval
Percentage
95% confidence interval
Total
10.5
( 6.2 - 14.8 )
15.4
( 10.5 - 20.3 )
5.6
( 1.1 - 10.1 )
15 or younger
6.0
( 3.5 - 8.4 )
7.9
( 4.1 - 11.7 )
4.1
( 1.7 - 6.5 )
16 or 17
13.4
( 7.4 - 19.4 )
19.7
( 13.5 - 25.8 )
6.9
( 0.0 - 14.3 )
18 or older
18.5
( 8.3 - 28.7 )
.
.
.
.
9th
5.4
( 2.0 - 8.9 )
6.6
( 0.5 - 12.8 )
4.3
( 0.6 - 7.9 )
10th
9.0
( 5.6 - 12.5 )
14.1
( 9.6 - 18.6 )
3.7
( 1.2 - 6.3 )
11th
9.7
( 5.6 - 13.9 )
15.5
( 9.6 - 21.4 )
3.7
( 0.0 - 9.2 )
12th
18.4
( 8.7 - 28.2 )
26.1
( 13.3 - 38.9 )
10.9
( 0.3 - 21.4 )
American Indian/Alaska Native*
.
.
.
.
.
.
Asian*
.
.
.
.
.
.
Black/African American*
.
.
.
.
.
.
Native Hawaiian/Other Pacific Islander*
.
.
.
.
.
.
White*
10.0
( 5.4 - 14.5 )
15.2
( 9.3 - 21.2 )
4.4
( 0.3 - 8.5 )
White Hispanic
12.3
( 5.8 - 18.8 )
.
.
.
.
Other
16.7
( 8.4 - 25.0 )
.
.
.
.
*Non-Hispanic. . = Less than 50 students in the subgroup. Version: HS21OCT2014
[email protected]
2013 HEALTHY KIDS COLORADO SURVEY RESULTS Region 4 High School Summary Tables - Weighted Data Table 46. Percentage of students who think people who smoke one or more packs of cigarettes per day have a moderate/great risk of harming themselves Total
Age
Grade
Race/Ethnicity
Male
Female
Percentage
95% confidence interval
Percentage
95% confidence interval
Percentage
95% confidence interval
Total
90.5
( 87.4 - 93.5 )
89.7
( 88.0 - 91.4 )
91.5
( 86.8 - 96.1 )
15 or younger
89.0
( 86.3 - 91.7 )
87.6
( 85.7 - 89.5 )
90.8
( 85.8 - 95.8 )
16 or 17
92.8
( 88.9 - 96.7 )
92.3
( 88.5 - 96.1 )
93.3
( 89.1 - 97.4 )
18 or older
85.1
( 72.3 - 97.8 )
.
.
.
.
9th
94.1
( 90.6 - 97.5 )
93.5
( 89.9 - 97.1 )
94.7
( 90.4 - 98.9 )
10th
87.9
( 82.4 - 93.4 )
86.2
( 78.2 - 94.2 )
89.8
( 83.5 - 96.0 )
11th
93.4
( 89.0 - 97.8 )
94.3
( 90.1 - 98.4 )
92.6
( 87.6 - 97.5 )
12th
88.9
( 85.1 - 92.7 )
88.0
( 83.2 - 92.7 )
89.8
( 82.0 - 97.5 )
American Indian/Alaska Native*
.
.
.
.
.
.
Asian*
.
.
.
.
.
.
Black/African American*
.
.
.
.
.
.
Native Hawaiian/Other Pacific Islander*
.
.
.
.
.
.
White*
90.6
( 86.6 - 94.6 )
90.3
( 86.7 - 93.9 )
91.0
( 85.5 - 96.5 )
White Hispanic
96.0
( 93.4 - 98.6 )
.
.
.
.
Other
86.0
( 76.7 - 95.3 )
84.6
( 75.6 - 93.6 )
88.8
( 79.2 - 98.4 )
*Non-Hispanic. . = Less than 50 students in the subgroup. Version: HS21OCT2014
[email protected]
2013 HEALTHY KIDS COLORADO SURVEY RESULTS Region 4 High School Summary Tables - Weighted Data Table 47. Percentage of students who think their parents would feel it is wrong/very wrong if they smoked cigarettes Total
Age
Grade
Race/Ethnicity
Male
Female
Percentage
95% confidence interval
Percentage
95% confidence interval
Percentage
95% confidence interval
Total
92.8
( 91.1 - 94.5 )
90.5
( 88.6 - 92.4 )
95.4
( 93.2 - 97.6 )
15 or younger
93.5
( 91.6 - 95.4 )
92.6
( 89.5 - 95.7 )
94.7
( 89.8 - 99.5 )
16 or 17
94.2
( 91.6 - 96.7 )
92.0
( 86.9 - 97.0 )
96.3
( 95.0 - 97.5 )
18 or older
80.9
( 73.1 - 88.7 )
.
.
.
.
9th
95.3
( 92.7 - 97.9 )
95.2
( 91.9 - 98.5 )
95.3
( 89.5 - 100.0 )
10th
94.6
( 93.2 - 96.1 )
94.1
( 91.8 - 96.4 )
95.2
( 92.6 - 97.8 )
11th
94.3
( 90.3 - 98.4 )
92.4
( 88.6 - 96.2 )
96.3
( 92.3 - 100.0 )
12th
89.5
( 86.5 - 92.4 )
82.5
( 76.6 - 88.3 )
96.4
( 93.8 - 99.1 )
American Indian/Alaska Native*
.
.
.
.
.
.
Asian*
.
.
.
.
.
.
Black/African American*
.
.
.
.
.
.
Native Hawaiian/Other Pacific Islander*
.
.
.
.
.
.
White*
94.2
( 92.2 - 96.1 )
93.0
( 90.3 - 95.6 )
95.4
( 93.1 - 97.7 )
White Hispanic
92.4
( 86.7 - 98.0 )
.
.
.
.
Other
88.0
( 78.2 - 97.8 )
83.2
( 71.9 - 94.6 )
94.5
( 85.1 - 100.0 )
*Non-Hispanic. . = Less than 50 students in the subgroup. Version: HS21OCT2014
[email protected]
2013 HEALTHY KIDS COLORADO SURVEY RESULTS Region 4 High School Summary Tables - Weighted Data Table 48. Percentage of students who think adults in their neighborhood would feel it is wrong/very wrong if they smoked cigarettes Total
Age
Grade
Race/Ethnicity
Male
Female
Percentage
95% confidence interval
Percentage
95% confidence interval
Percentage
95% confidence interval
Total
86.5
( 83.5 - 89.5 )
84.2
( 79.9 - 88.5 )
89.0
( 85.8 - 92.2 )
15 or younger
89.6
( 86.9 - 92.3 )
89.2
( 86.2 - 92.2 )
90.2
( 85.7 - 94.8 )
16 or 17
84.7
( 79.0 - 90.4 )
80.7
( 70.0 - 91.4 )
88.5
( 84.8 - 92.3 )
18 or older
79.3
( 73.9 - 84.6 )
.
.
.
.
9th
90.9
( 85.9 - 95.9 )
92.1
( 87.9 - 96.3 )
89.6
( 82.7 - 96.5 )
10th
90.8
( 87.7 - 93.9 )
91.6
( 86.4 - 96.7 )
90.1
( 86.0 - 94.1 )
11th
84.1
( 78.6 - 89.7 )
76.8
( 64.3 - 89.3 )
91.8
( 86.0 - 97.6 )
12th
81.2
( 76.8 - 85.5 )
77.7
( 69.7 - 85.7 )
84.6
( 77.8 - 91.4 )
American Indian/Alaska Native*
.
.
.
.
.
.
Asian*
.
.
.
.
.
.
Black/African American*
.
.
.
.
.
.
Native Hawaiian/Other Pacific Islander*
.
.
.
.
.
.
White*
89.0
( 85.5 - 92.6 )
86.9
( 80.4 - 93.3 )
91.4
( 89.0 - 93.7 )
White Hispanic
87.8
( 80.8 - 94.8 )
.
.
.
.
Other
84.7
( 73.4 - 95.9 )
81.1
( 67.8 - 94.4 )
89.8
( 77.8 - 100.0 )
*Non-Hispanic. . = Less than 50 students in the subgroup. Version: HS21OCT2014
[email protected]
2013 HEALTHY KIDS COLORADO SURVEY RESULTS Region 4 High School Summary Tables - Weighted Data Table 49. Percentage of students who have ever tried hookah Total
Age
Grade
Race/Ethnicity
Male
Female
Percentage
95% confidence interval
Percentage
95% confidence interval
Percentage
95% confidence interval
Total
27.0
( 20.7 - 33.2 )
26.9
( 21.3 - 32.5 )
27.3
( 20.1 - 34.4 )
15 or younger
17.1
( 10.2 - 24.1 )
16.7
( 8.9 - 24.4 )
17.4
( 10.1 - 24.6 )
16 or 17
35.8
( 27.9 - 43.7 )
35.1
( 28.0 - 42.3 )
36.7
( 26.8 - 46.7 )
18 or older
28.8
( 21.0 - 36.6 )
.
.
.
.
9th
12.9
( 5.7 - 20.1 )
13.9
( 2.2 - 25.6 )
11.9
( 6.3 - 17.5 )
10th
25.1
( 20.0 - 30.3 )
25.2
( 18.6 - 31.8 )
25.5
( 15.5 - 35.5 )
11th
35.9
( 27.8 - 44.1 )
35.8
( 29.0 - 42.6 )
36.3
( 24.4 - 48.2 )
12th
35.0
( 24.9 - 45.2 )
33.8
( 20.4 - 47.3 )
36.2
( 28.9 - 43.5 )
American Indian/Alaska Native*
.
.
.
.
.
.
Asian*
.
.
.
.
.
.
Black/African American*
.
.
.
.
.
.
Native Hawaiian/Other Pacific Islander*
.
.
.
.
.
.
White*
22.7
( 17.0 - 28.3 )
21.7
( 16.0 - 27.4 )
23.9
( 17.6 - 30.1 )
White Hispanic
38.0
( 23.3 - 52.6 )
.
.
.
.
Other
41.0
( 28.3 - 53.7 )
.
.
.
.
*Non-Hispanic. . = Less than 50 students in the subgroup. Version: HS21OCT2014
[email protected]
2013 HEALTHY KIDS COLORADO SURVEY RESULTS Region 4 High School Summary Tables - Weighted Data Table 50. Percentage of students who have ever tried snus Total
Age
Grade
Race/Ethnicity
Male
Female
Percentage
95% confidence interval
Percentage
95% confidence interval
Percentage
95% confidence interval
Total
4.5
( 3.6 - 5.5 )
7.5
( 6.0 - 9.0 )
1.5
( 0.2 - 2.9 )
15 or younger
1.6
( 0.9 - 2.3 )
2.8
( 1.1 - 4.5 )
0.5
( 0.0 - 1.3 )
16 or 17
6.8
( 5.1 - 8.4 )
10.8
( 8.5 - 13.1 )
2.6
( 0.3 - 4.9 )
18 or older
7.2
( 2.2 - 12.3 )
.
.
.
.
9th
1.7
( 0.5 - 2.9 )
2.2
( 0.0 - 4.6 )
1.1
( 0.0 - 2.4 )
10th
3.7
( 0.0 - 7.6 )
7.3
( 0.5 - 14.0 )
0.0
( 0.0 - 0.0 )
11th
6.1
( 4.0 - 8.2 )
11.3
( 6.7 - 15.9 )
0.8
( 0.0 - 2.1 )
12th
6.2
( 3.2 - 9.1 )
8.1
( 3.1 - 13.1 )
4.3
( 1.1 - 7.6 )
American Indian/Alaska Native*
.
.
.
.
.
.
Asian*
.
.
.
.
.
.
Black/African American*
.
.
.
.
.
.
Native Hawaiian/Other Pacific Islander*
.
.
.
.
.
.
White*
4.6
( 3.6 - 5.5 )
7.2
( 5.5 - 9.0 )
1.8
( 0.0 - 4.0 )
White Hispanic
4.8
( 0.0 - 10.4 )
.
.
.
.
Other
6.5
( 2.3 - 10.6 )
.
.
.
.
*Non-Hispanic. . = Less than 50 students in the subgroup. Version: HS21OCT2014
[email protected]
2013 HEALTHY KIDS COLORADO SURVEY RESULTS Region 4 High School Summary Tables - Weighted Data Table 51. Percentage of students who have ever tried dissolvables Total
Age
Grade
Race/Ethnicity
Male
Female
Percentage
95% confidence interval
Percentage
95% confidence interval
Percentage
95% confidence interval
Total
1.0
( 0.3 - 1.6 )
0.8
( 0.0 - 1.7 )
1.1
( 0.0 - 2.4 )
15 or younger
0.7
( 0.0 - 1.5 )
0.8
( 0.0 - 2.2 )
0.6
( 0.0 - 1.7 )
16 or 17
0.8
( 0.0 - 1.8 )
0.5
( 0.0 - 1.3 )
1.1
( 0.0 - 3.2 )
18 or older
3.3
( 0.2 - 6.3 )
.
.
.
.
9th
0.8
( 0.0 - 2.0 )
1.2
( 0.0 - 3.6 )
0.3
( 0.0 - 1.0 )
10th
0.2
( 0.0 - 0.5 )
0.3
( 0.0 - 0.9 )
0.0
( 0.0 - 0.0 )
11th
0.3
( 0.0 - 0.8 )
0.6
( 0.0 - 1.6 )
0.0
( 0.0 - 0.0 )
12th
2.7
( 0.3 - 5.0 )
1.1
( 0.0 - 3.0 )
4.2
( 0.0 - 9.2 )
American Indian/Alaska Native*
.
.
.
.
.
.
Asian*
.
.
.
.
.
.
Black/African American*
.
.
.
.
.
.
Native Hawaiian/Other Pacific Islander*
.
.
.
.
.
.
White*
0.8
( 0.1 - 1.4 )
0.9
( 0.0 - 1.9 )
0.6
( 0.0 - 1.7 )
White Hispanic
0.9
( 0.0 - 2.5 )
.
.
.
.
Other
3.9
( 0.5 - 7.3 )
.
.
.
.
*Non-Hispanic. . = Less than 50 students in the subgroup. Version: HS21OCT2014
[email protected]
2013 HEALTHY KIDS COLORADO SURVEY RESULTS Region 4 High School Summary Tables - Weighted Data Table 52. Percentage of students who have ever tried e-cigarettes Total
Age
Grade
Race/Ethnicity
Male
Female
Percentage
95% confidence interval
Percentage
95% confidence interval
Percentage
95% confidence interval
Total
14.1
( 9.3 - 18.9 )
15.4
( 9.5 - 21.3 )
12.8
( 8.8 - 16.9 )
15 or younger
11.3
( 4.7 - 17.9 )
11.6
( 5.4 - 17.7 )
10.8
( 4.0 - 17.5 )
16 or 17
15.6
( 9.5 - 21.6 )
16.5
( 9.6 - 23.3 )
14.8
( 8.0 - 21.6 )
18 or older
21.0
( 11.7 - 30.4 )
.
.
.
.
9th
7.1
( 3.7 - 10.5 )
7.9
( 2.2 - 13.7 )
6.4
( 1.1 - 11.7 )
10th
15.9
( 5.0 - 26.7 )
15.3
( 2.9 - 27.7 )
16.7
( 4.0 - 29.5 )
11th
13.2
( 7.0 - 19.4 )
14.9
( 9.1 - 20.8 )
11.5
( 3.2 - 19.8 )
12th
19.9
( 14.3 - 25.5 )
23.4
( 12.5 - 34.3 )
16.5
( 13.0 - 19.9 )
American Indian/Alaska Native*
.
.
.
.
.
.
Asian*
.
.
.
.
.
.
Black/African American*
.
.
.
.
.
.
Native Hawaiian/Other Pacific Islander*
.
.
.
.
.
.
White*
12.7
( 8.6 - 16.8 )
15.0
( 9.3 - 20.7 )
10.4
( 7.6 - 13.2 )
White Hispanic
16.4
( 0.8 - 31.9 )
.
.
.
.
Other
29.4
( 18.7 - 40.1 )
.
.
.
.
*Non-Hispanic. . = Less than 50 students in the subgroup. Version: HS21OCT2014
[email protected]
2013 HEALTHY KIDS COLORADO SURVEY RESULTS Region 4 High School Summary Tables - Weighted Data Table 53. Percentage of students who have ever tried bidis Total
Age
Grade
Race/Ethnicity
Male
Female
Percentage
95% confidence interval
Percentage
95% confidence interval
Percentage
95% confidence interval
Total
1.3
( 0.7 - 2.0 )
2.6
( 1.3 - 3.8 )
0.1
( 0.0 - 0.3 )
15 or younger
0.7
( 0.0 - 1.5 )
1.4
( 0.0 - 3.0 )
0.0
( 0.0 - 0.0 )
16 or 17
0.9
( 0.2 - 1.6 )
1.8
( 0.5 - 3.0 )
0.0
( 0.0 - 0.0 )
18 or older
7.5
( 0.0 - 17.0 )
.
.
.
.
9th
2.6
( 0.4 - 4.8 )
4.9
( 0.6 - 9.1 )
0.3
( 0.0 - 1.0 )
10th
1.3
( 0.0 - 2.7 )
2.5
( 0.1 - 4.9 )
0.0
( 0.0 - 0.0 )
11th
0.4
( 0.0 - 0.9 )
0.9
( 0.0 - 1.8 )
0.0
( 0.0 - 0.0 )
12th
0.9
( 0.0 - 2.0 )
1.9
( 0.0 - 4.2 )
0.0
( 0.0 - 0.0 )
American Indian/Alaska Native*
.
.
.
.
.
.
Asian*
.
.
.
.
.
.
Black/African American*
.
.
.
.
.
.
Native Hawaiian/Other Pacific Islander*
.
.
.
.
.
.
White*
0.8
( 0.3 - 1.3 )
1.6
( 0.6 - 2.6 )
0.0
( 0.0 - 0.0 )
White Hispanic
1.0
( 0.0 - 2.6 )
.
.
.
.
Other
1.7
( 0.0 - 4.9 )
.
.
.
.
*Non-Hispanic. . = Less than 50 students in the subgroup. Version: HS21OCT2014
[email protected]
2013 HEALTHY KIDS COLORADO SURVEY RESULTS Region 4 High School Summary Tables - Weighted Data Table 54. Percentage of students who have never tried any of these types of tobacco: hookah, snus, dissolvables, e-cigarettes, bidis Total
Age
Grade
Race/Ethnicity
Male
Female
Percentage
95% confidence interval
Percentage
95% confidence interval
Percentage
95% confidence interval
Total
52.0
( 48.4 - 55.6 )
53.6
( 49.0 - 58.3 )
50.3
( 46.9 - 53.7 )
15 or younger
54.4
( 49.8 - 58.9 )
59.7
( 52.2 - 67.2 )
49.4
( 44.6 - 54.2 )
16 or 17
50.1
( 43.0 - 57.1 )
49.2
( 44.2 - 54.2 )
50.6
( 40.7 - 60.5 )
18 or older
51.8
( 40.6 - 63.0 )
.
.
.
.
9th
58.1
( 52.1 - 64.1 )
60.9
( 48.6 - 73.1 )
55.4
( 46.3 - 64.4 )
10th
50.8
( 44.4 - 57.2 )
54.1
( 44.1 - 64.0 )
46.6
( 38.0 - 55.2 )
11th
50.2
( 43.1 - 57.3 )
49.1
( 43.6 - 54.5 )
51.1
( 38.5 - 63.7 )
12th
49.9
( 40.3 - 59.5 )
51.5
( 35.8 - 67.2 )
48.4
( 42.9 - 53.9 )
American Indian/Alaska Native*
.
.
.
.
.
.
Asian*
.
.
.
.
.
.
Black/African American*
.
.
.
.
.
.
Native Hawaiian/Other Pacific Islander*
.
.
.
.
.
.
White*
57.9
( 52.8 - 63.0 )
59.9
( 53.5 - 66.2 )
55.6
( 48.5 - 62.6 )
White Hispanic
39.2
( 23.1 - 55.4 )
.
.
.
.
Other
40.4
( 32.9 - 48.0 )
.
.
.
.
*Non-Hispanic. . = Less than 50 students in the subgroup. Version: HS21OCT2014
[email protected]
2013 HEALTHY KIDS COLORADO SURVEY RESULTS Region 4 High School Summary Tables - Weighted Data Table 55. Percentage of students who don't know what any of these types of tobacco are: hookah, snus, dissolvables, e-cigarettes, bidis Total
Age
Grade
Race/Ethnicity
Male
Female
Percentage
95% confidence interval
Percentage
95% confidence interval
Percentage
95% confidence interval
Total
23.1
( 18.6 - 27.6 )
17.6
( 14.3 - 20.9 )
28.5
( 21.8 - 35.1 )
15 or younger
32.6
( 25.1 - 40.1 )
26.8
( 20.4 - 33.2 )
38.2
( 29.2 - 47.2 )
16 or 17
15.6
( 12.0 - 19.1 )
12.2
( 9.0 - 15.5 )
18.8
( 12.4 - 25.1 )
18 or older
15.3
( 9.7 - 20.9 )
.
.
.
.
9th
36.9
( 30.8 - 42.9 )
32.3
( 25.5 - 39.1 )
41.3
( 34.8 - 47.8 )
10th
21.0
( 13.7 - 28.3 )
13.5
( 7.3 - 19.6 )
29.3
( 19.2 - 39.5 )
11th
17.9
( 12.9 - 22.8 )
16.0
( 8.7 - 23.4 )
19.2
( 9.3 - 29.1 )
12th
15.4
( 12.3 - 18.5 )
7.3
( 4.6 - 10.1 )
23.1
( 15.5 - 30.6 )
American Indian/Alaska Native*
.
.
.
.
.
.
Asian*
.
.
.
.
.
.
Black/African American*
.
.
.
.
.
.
Native Hawaiian/Other Pacific Islander*
.
.
.
.
.
.
White*
23.8
( 19.3 - 28.3 )
18.9
( 15.3 - 22.5 )
29.0
( 21.0 - 36.9 )
White Hispanic
19.7
( 8.4 - 31.0 )
.
.
.
.
Other
18.5
( 5.4 - 31.6 )
.
.
.
.
*Non-Hispanic. . = Less than 50 students in the subgroup. Version: HS21OCT2014
[email protected]
2013 HEALTHY KIDS COLORADO SURVEY RESULTS Region 4 High School Summary Tables - Weighted Data Table 56. Percentage of students who were inside their home while someone was smoking a cigarette, cigar, or pipe during the past 7 days Total
Age
Grade
Race/Ethnicity
Male
Female
Percentage
95% confidence interval
Percentage
95% confidence interval
Percentage
95% confidence interval
Total
10.4
( 7.5 - 13.3 )
11.9
( 9.1 - 14.6 )
8.8
( 4.8 - 12.9 )
15 or younger
9.9
( 6.2 - 13.5 )
9.9
( 4.8 - 14.9 )
9.9
( 5.7 - 14.1 )
16 or 17
11.4
( 8.7 - 14.1 )
13.6
( 11.2 - 15.9 )
8.9
( 3.2 - 14.5 )
18 or older
7.8
( 1.1 - 14.4 )
.
.
.
.
9th
10.0
( 5.3 - 14.8 )
10.0
( 3.5 - 16.6 )
10.0
( 4.4 - 15.6 )
10th
11.3
( 5.8 - 16.9 )
13.0
( 5.5 - 20.6 )
9.0
( 4.3 - 13.6 )
11th
11.6
( 7.0 - 16.3 )
16.5
( 10.1 - 22.9 )
6.8
( 0.0 - 14.6 )
12th
8.8
( 3.3 - 14.3 )
8.1
( 4.3 - 11.8 )
9.5
( 0.9 - 18.2 )
American Indian/Alaska Native*
.
.
.
.
.
.
Asian*
.
.
.
.
.
.
Black/African American*
.
.
.
.
.
.
Native Hawaiian/Other Pacific Islander*
.
.
.
.
.
.
White*
8.7
( 7.5 - 10.0 )
11.2
( 8.9 - 13.4 )
5.9
( 3.5 - 8.4 )
White Hispanic
11.8
( 3.7 - 19.9 )
.
.
.
.
Other
15.3
( 8.8 - 21.8 )
.
.
.
.
*Non-Hispanic. . = Less than 50 students in the subgroup. Version: HS21OCT2014
[email protected]
2013 HEALTHY KIDS COLORADO SURVEY RESULTS Region 4 High School Summary Tables - Weighted Data Table 57. Percentage of students who were inside a car while someone their age was smoking a cigarette, cigar, or pipe during the past 7 days Total
Age
Grade
Race/Ethnicity
Male
Female
Percentage
95% confidence interval
Percentage
95% confidence interval
Percentage
95% confidence interval
Total
13.2
( 8.7 - 17.7 )
14.9
( 9.8 - 20.0 )
11.4
( 7.0 - 15.8 )
15 or younger
7.3
( 3.1 - 11.4 )
7.2
( 2.2 - 12.1 )
7.1
( 3.0 - 11.2 )
16 or 17
16.9
( 11.3 - 22.5 )
17.9
( 11.3 - 24.5 )
16.0
( 8.7 - 23.2 )
18 or older
23.8
( 15.9 - 31.8 )
.
.
.
.
9th
6.4
( 1.7 - 11.1 )
8.3
( 1.2 - 15.5 )
4.4
( 1.4 - 7.3 )
10th
10.7
( 6.2 - 15.2 )
10.1
( 4.9 - 15.3 )
11.5
( 6.6 - 16.4 )
11th
16.4
( 10.4 - 22.5 )
17.9
( 12.2 - 23.7 )
15.0
( 5.7 - 24.3 )
12th
20.1
( 13.3 - 26.9 )
24.9
( 16.4 - 33.3 )
15.5
( 6.8 - 24.1 )
American Indian/Alaska Native*
.
.
.
.
.
.
Asian*
.
.
.
.
.
.
Black/African American*
.
.
.
.
.
.
Native Hawaiian/Other Pacific Islander*
.
.
.
.
.
.
White*
12.4
( 8.0 - 16.8 )
14.7
( 9.0 - 20.4 )
10.1
( 6.0 - 14.1 )
White Hispanic
13.5
( 7.3 - 19.7 )
.
.
.
.
Other
22.7
( 11.9 - 33.5 )
.
.
.
.
*Non-Hispanic. . = Less than 50 students in the subgroup. Version: HS21OCT2014
[email protected]
2013 HEALTHY KIDS COLORADO SURVEY RESULTS Region 4 High School Summary Tables - Weighted Data Table 58. Percentage of students who were inside a car while their parent was smoking a cigarette, cigar, or pipe during the past 7 days Total
Age
Grade
Race/Ethnicity
Male
Female
Percentage
95% confidence interval
Percentage
95% confidence interval
Percentage
95% confidence interval
Total
7.5
( 5.7 - 9.2 )
6.9
( 3.9 - 9.9 )
7.9
( 6.0 - 9.8 )
15 or younger
7.3
( 5.0 - 9.6 )
5.0
( 0.0 - 10.4 )
9.6
( 5.3 - 13.9 )
16 or 17
7.4
( 5.2 - 9.6 )
7.7
( 4.7 - 10.8 )
6.7
( 4.7 - 8.7 )
18 or older
8.9
( 0.5 - 17.3 )
.
.
.
.
9th
6.6
( 2.6 - 10.6 )
4.0
( 0.0 - 9.1 )
9.1
( 3.5 - 14.8 )
10th
10.0
( 6.9 - 13.1 )
11.1
( 4.5 - 17.8 )
8.3
( 2.2 - 14.4 )
11th
6.9
( 3.3 - 10.5 )
6.9
( 2.3 - 11.5 )
6.9
( 2.1 - 11.7 )
12th
6.1
( 2.6 - 9.5 )
4.8
( 2.6 - 7.0 )
7.3
( 2.1 - 12.5 )
American Indian/Alaska Native*
.
.
.
.
.
.
Asian*
.
.
.
.
.
.
Black/African American*
.
.
.
.
.
.
Native Hawaiian/Other Pacific Islander*
.
.
.
.
.
.
White*
6.2
( 3.4 - 8.9 )
4.7
( 2.2 - 7.2 )
7.4
( 3.6 - 11.3 )
White Hispanic
6.0
( 2.2 - 9.8 )
.
.
.
.
Other
14.7
( 6.9 - 22.6 )
.
.
.
.
*Non-Hispanic. . = Less than 50 students in the subgroup. Version: HS21OCT2014
[email protected]
2013 HEALTHY KIDS COLORADO SURVEY RESULTS Region 4 High School Summary Tables - Weighted Data Table 59. Percentage of students who think breathing second hand smoke has a moderate or great risk Total
Age
Grade
Race/Ethnicity
Male
Female
Percentage
95% confidence interval
Percentage
95% confidence interval
Percentage
95% confidence interval
Total
77.1
( 75.5 - 78.8 )
74.3
( 70.6 - 77.9 )
80.3
( 77.5 - 83.2 )
15 or younger
81.6
( 77.8 - 85.4 )
78.5
( 73.4 - 83.7 )
85.2
( 81.6 - 88.8 )
16 or 17
74.5
( 72.1 - 77.0 )
72.9
( 69.2 - 76.6 )
76.4
( 72.1 - 80.7 )
18 or older
67.8
( 58.8 - 76.8 )
.
.
.
.
9th
82.4
( 78.1 - 86.6 )
76.4
( 69.1 - 83.8 )
88.4
( 83.2 - 93.5 )
10th
78.7
( 73.8 - 83.7 )
77.5
( 72.8 - 82.2 )
80.7
( 72.1 - 89.3 )
11th
71.2
( 67.0 - 75.4 )
68.0
( 64.8 - 71.3 )
74.8
( 68.6 - 80.9 )
12th
76.3
( 70.7 - 82.0 )
76.0
( 63.7 - 88.2 )
76.7
( 68.5 - 84.9 )
American Indian/Alaska Native*
.
.
.
.
.
.
Asian*
.
.
.
.
.
.
Black/African American*
.
.
.
.
.
.
Native Hawaiian/Other Pacific Islander*
.
.
.
.
.
.
White*
77.9
( 74.3 - 81.6 )
74.5
( 66.6 - 82.4 )
81.6
( 76.9 - 86.3 )
White Hispanic
83.1
( 76.8 - 89.4 )
.
.
.
.
Other
64.0
( 57.4 - 70.6 )
.
.
.
.
*Non-Hispanic. . = Less than 50 students in the subgroup. Version: HS21OCT2014
[email protected]
2013 HEALTHY KIDS COLORADO SURVEY RESULTS Region 4 High School Summary Tables - Weighted Data Table 60. Percentage of students who had at least one drink of alcohol on one or more days during their life Total
Age
Grade
Race/Ethnicity
Male
Female
Percentage
95% confidence interval
Percentage
95% confidence interval
Percentage
95% confidence interval
Total
54.8
( 48.6 - 60.9 )
56.2
( 49.7 - 62.7 )
53.1
( 46.1 - 60.0 )
15 or younger
47.2
( 41.5 - 52.8 )
49.8
( 41.0 - 58.7 )
44.2
( 40.0 - 48.5 )
16 or 17
59.9
( 52.5 - 67.4 )
59.8
( 52.9 - 66.7 )
60.1
( 50.7 - 69.5 )
18 or older
66.8
( 53.5 - 80.0 )
68.3
( 55.7 - 80.8 )
64.5
( 43.0 - 86.1 )
9th
40.5
( 32.5 - 48.4 )
42.9
( 33.4 - 52.4 )
37.9
( 27.4 - 48.5 )
10th
56.2
( 52.5 - 59.9 )
58.5
( 51.3 - 65.8 )
53.6
( 46.8 - 60.5 )
11th
57.8
( 46.9 - 68.6 )
58.2
( 49.9 - 66.6 )
57.2
( 42.2 - 72.2 )
12th
64.0
( 55.3 - 72.8 )
64.4
( 55.6 - 73.3 )
63.6
( 52.6 - 74.6 )
.
.
.
.
.
.
Asian*
41.5
( 32.2 - 50.8 )
.
.
.
.
Black/African American*
58.3
( 37.9 - 78.7 )
.
.
.
.
.
.
.
.
.
.
White*
52.2
( 46.4 - 57.9 )
50.7
( 43.5 - 57.9 )
53.6
( 48.7 - 58.6 )
White Hispanic
60.6
( 50.4 - 70.8 )
70.1
( 60.9 - 79.2 )
51.1
( 35.1 - 67.1 )
Other
65.2
( 56.0 - 74.3 )
65.7
( 52.6 - 78.8 )
64.3
( 53.6 - 75.0 )
American Indian/Alaska Native*
Native Hawaiian/Other Pacific Islander*
*Non-Hispanic. . = Less than 50 students in the subgroup. Version: HS21OCT2014
[email protected]
2013 HEALTHY KIDS COLORADO SURVEY RESULTS Region 4 High School Summary Tables - Weighted Data Table 61. Percentage of students who had their first drink of alcohol other than a few sips before age 13 years Total
Age
Grade
Race/Ethnicity
Male
Female
Percentage
95% confidence interval
Percentage
95% confidence interval
Percentage
95% confidence interval
Total
14.5
( 12.7 - 16.3 )
15.1
( 11.6 - 18.6 )
13.6
( 12.4 - 14.7 )
15 or younger
18.4
( 15.6 - 21.3 )
19.5
( 14.5 - 24.5 )
17.1
( 15.0 - 19.2 )
16 or 17
10.7
( 8.5 - 12.9 )
10.9
( 7.9 - 13.8 )
10.4
( 7.3 - 13.5 )
18 or older
14.0
( 6.8 - 21.2 )
15.5
( 8.3 - 22.8 )
11.7
( 3.6 - 19.8 )
9th
16.7
( 13.3 - 20.1 )
16.2
( 12.9 - 19.6 )
17.2
( 13.2 - 21.2 )
10th
16.9
( 13.3 - 20.5 )
19.0
( 11.9 - 26.0 )
14.2
( 9.5 - 19.0 )
11th
11.5
( 7.9 - 15.1 )
8.6
( 5.2 - 12.0 )
14.2
( 7.6 - 20.7 )
12th
10.9
( 6.0 - 15.7 )
13.4
( 8.7 - 18.0 )
8.4
( 1.8 - 15.0 )
.
.
.
.
.
.
Asian*
13.1
( 7.2 - 19.0 )
.
.
.
.
Black/African American*
20.7
( 9.8 - 31.5 )
.
.
.
.
.
.
.
.
.
.
White*
12.3
( 11.0 - 13.6 )
12.1
( 8.9 - 15.2 )
12.5
( 10.8 - 14.2 )
White Hispanic
14.7
( 9.5 - 20.0 )
15.5
( 7.2 - 23.8 )
14.0
( 9.5 - 18.5 )
Other
26.4
( 17.8 - 35.0 )
26.7
( 18.9 - 34.6 )
25.5
( 15.2 - 35.7 )
American Indian/Alaska Native*
Native Hawaiian/Other Pacific Islander*
*Non-Hispanic. . = Less than 50 students in the subgroup. Version: HS21OCT2014
[email protected]
2013 HEALTHY KIDS COLORADO SURVEY RESULTS Region 4 High School Summary Tables - Weighted Data Table 62. Percentage of students who began drinking alcohol regularly (at least once or twice per month) before the age of 13 Total
Age
Grade
Race/Ethnicity
Male
Female
Percentage
95% confidence interval
Percentage
95% confidence interval
Percentage
95% confidence interval
Total
2.6
( 1.1 - 4.1 )
2.8
( 1.1 - 4.5 )
2.2
( 0.6 - 3.8 )
15 or younger
3.7
( 1.2 - 6.2 )
3.1
( 0.8 - 5.4 )
4.2
( 1.4 - 7.0 )
16 or 17
0.5
( 0.0 - 1.1 )
0.6
( 0.0 - 1.5 )
0.3
( 0.0 - 0.9 )
18 or older
8.8
( 0.9 - 16.6 )
.
.
.
.
9th
2.2
( 0.0 - 5.7 )
0.0
( 0.0 - 0.0 )
4.5
( 0.0 - 11.4 )
10th
1.6
( 0.7 - 2.5 )
1.2
( 0.0 - 2.9 )
2.0
( 0.0 - 4.5 )
11th
1.3
( 0.0 - 3.1 )
1.2
( 0.0 - 2.8 )
1.5
( 0.0 - 3.5 )
12th
3.6
( 0.6 - 6.6 )
6.4
( 1.3 - 11.6 )
0.8
( 0.0 - 2.1 )
American Indian/Alaska Native*
.
.
.
.
.
.
Asian*
.
.
.
.
.
.
Black/African American*
.
.
.
.
.
.
Native Hawaiian/Other Pacific Islander*
.
.
.
.
.
.
White*
0.8
( 0.3 - 1.2 )
0.7
( 0.1 - 1.2 )
0.9
( 0.3 - 1.5 )
White Hispanic
5.0
( 2.1 - 7.9 )
.
.
.
.
Other
10.0
( 2.0 - 18.0 )
11.6
( 3.4 - 19.8 )
7.0
( 0.0 - 15.7 )
*Non-Hispanic. . = Less than 50 students in the subgroup. Version: HS21OCT2014
[email protected]
2013 HEALTHY KIDS COLORADO SURVEY RESULTS Region 4 High School Summary Tables - Weighted Data Table 63. Percentage of students who had at least one drink of alcohol on one or more of the past 30 days Total
Age
Grade
Race/Ethnicity
Male
Female
Percentage
95% confidence interval
Percentage
95% confidence interval
Percentage
95% confidence interval
Total
24.6
( 17.7 - 31.5 )
24.0
( 17.3 - 30.7 )
25.0
( 17.6 - 32.5 )
15 or younger
18.9
( 13.8 - 23.9 )
16.4
( 10.5 - 22.3 )
21.0
( 16.2 - 25.8 )
16 or 17
27.5
( 18.9 - 36.1 )
27.1
( 19.7 - 34.5 )
27.9
( 18.0 - 37.9 )
18 or older
38.9
( 23.3 - 54.6 )
43.1
( 27.2 - 58.9 )
32.6
( 12.7 - 52.5 )
9th
11.7
( 6.0 - 17.5 )
9.7
( 5.1 - 14.4 )
13.7
( 6.3 - 21.1 )
10th
25.1
( 22.9 - 27.3 )
22.1
( 17.6 - 26.7 )
28.5
( 24.7 - 32.3 )
11th
26.4
( 15.2 - 37.6 )
28.0
( 17.6 - 38.4 )
24.7
( 12.7 - 36.7 )
12th
34.3
( 22.4 - 46.1 )
35.0
( 23.8 - 46.3 )
33.5
( 18.8 - 48.1 )
.
.
.
.
.
.
Asian*
15.5
( 8.1 - 22.9 )
.
.
.
.
Black/African American*
37.1
( 19.3 - 54.9 )
.
.
.
.
.
.
.
.
.
.
White*
22.2
( 14.9 - 29.4 )
21.1
( 13.5 - 28.8 )
23.3
( 16.3 - 30.4 )
White Hispanic
26.0
( 16.6 - 35.4 )
28.4
( 18.8 - 38.0 )
23.7
( 11.0 - 36.3 )
Other
34.6
( 26.0 - 43.3 )
31.9
( 20.6 - 43.3 )
36.8
( 27.6 - 46.1 )
American Indian/Alaska Native*
Native Hawaiian/Other Pacific Islander*
*Non-Hispanic. . = Less than 50 students in the subgroup. Version: HS21OCT2014
[email protected]
2013 HEALTHY KIDS COLORADO SURVEY RESULTS Region 4 High School Summary Tables - Weighted Data Table 64. Percentage of students who had five or more drinks of alcohol in a row, that is, within a couple of hours, on one or more of the past 30 days Total
Age
Grade
Race/Ethnicity
Male
Female
Percentage
95% confidence interval
Percentage
95% confidence interval
Percentage
95% confidence interval
Total
13.0
( 8.7 - 17.3 )
12.8
( 8.0 - 17.7 )
13.1
( 8.7 - 17.6 )
15 or younger
9.1
( 5.2 - 12.9 )
8.0
( 3.4 - 12.6 )
9.7
( 6.3 - 13.1 )
16 or 17
15.3
( 9.4 - 21.2 )
15.4
( 8.8 - 22.1 )
15.2
( 9.5 - 20.9 )
18 or older
22.3
( 10.4 - 34.3 )
22.1
( 11.2 - 33.0 )
22.8
( 3.3 - 42.2 )
9th
5.5
( 2.8 - 8.3 )
4.5
( 2.2 - 6.8 )
6.5
( 3.3 - 9.8 )
10th
12.0
( 10.0 - 14.0 )
11.2
( 7.1 - 15.4 )
12.9
( 8.8 - 17.1 )
11th
15.0
( 8.0 - 22.0 )
15.7
( 7.4 - 24.0 )
14.3
( 7.3 - 21.2 )
12th
18.4
( 9.5 - 27.3 )
17.6
( 9.9 - 25.3 )
19.2
( 7.3 - 31.1 )
.
.
.
.
.
.
Asian*
2.1
( 0.0 - 6.1 )
.
.
.
.
Black/African American*
20.5
( 11.4 - 29.7 )
.
.
.
.
.
.
.
.
.
.
White*
11.8
( 6.1 - 17.4 )
10.8
( 5.1 - 16.5 )
12.8
( 6.7 - 19.0 )
White Hispanic
13.9
( 8.1 - 19.7 )
15.4
( 7.3 - 23.5 )
12.5
( 6.2 - 18.9 )
Other
20.0
( 10.7 - 29.3 )
20.4
( 9.4 - 31.5 )
18.9
( 10.0 - 27.8 )
American Indian/Alaska Native*
Native Hawaiian/Other Pacific Islander*
*Non-Hispanic. . = Less than 50 students in the subgroup. Version: HS21OCT2014
[email protected]
2013 HEALTHY KIDS COLORADO SURVEY RESULTS Region 4 High School Summary Tables - Weighted Data Table 65. Percentage of students who drank on school property during the past 30 days Total
Age
Grade
Race/Ethnicity
Male
Female
Percentage
95% confidence interval
Percentage
95% confidence interval
Percentage
95% confidence interval
Total
3.5
( 2.2 - 4.8 )
3.8
( 1.6 - 5.9 )
3.1
( 2.1 - 4.1 )
15 or younger
2.8
( 0.8 - 4.9 )
2.5
( 0.0 - 5.0 )
3.0
( 0.8 - 5.1 )
16 or 17
3.1
( 1.8 - 4.4 )
3.0
( 0.7 - 5.3 )
3.2
( 1.0 - 5.4 )
18 or older
9.6
( 2.0 - 17.3 )
.
.
.
.
9th
2.6
( 0.1 - 5.0 )
0.4
( 0.0 - 1.1 )
4.8
( 0.0 - 9.5 )
10th
1.3
( 0.5 - 2.2 )
2.3
( 0.6 - 4.0 )
0.3
( 0.0 - 0.8 )
11th
3.3
( 0.7 - 5.8 )
2.2
( 0.0 - 5.7 )
4.4
( 1.3 - 7.4 )
12th
5.4
( 2.5 - 8.4 )
8.2
( 2.0 - 14.3 )
2.7
( 0.0 - 6.8 )
American Indian/Alaska Native*
.
.
.
.
.
.
Asian*
.
.
.
.
.
.
Black/African American*
.
.
.
.
.
.
Native Hawaiian/Other Pacific Islander*
.
.
.
.
.
.
White*
1.7
( 0.5 - 2.8 )
2.2
( 0.5 - 4.0 )
1.0
( 0.0 - 2.0 )
White Hispanic
5.4
( 2.7 - 8.1 )
.
.
.
.
Other
8.6
( 2.1 - 15.1 )
10.2
( 2.1 - 18.3 )
5.7
( 0.0 - 12.8 )
*Non-Hispanic. . = Less than 50 students in the subgroup. Version: HS21OCT2014
[email protected]
2013 HEALTHY KIDS COLORADO SURVEY RESULTS Region 4 High School Summary Tables - Weighted Data Table 66. Percentage of students who think a typical student drank 1+ days in the past 30 days Total
Age
Grade
Race/Ethnicity
Male
Female
Percentage
95% confidence interval
Percentage
95% confidence interval
Percentage
95% confidence interval
Total
73.1
( 63.7 - 82.4 )
68.1
( 56.4 - 79.9 )
78.2
( 71.3 - 85.1 )
15 or younger
69.6
( 58.5 - 80.7 )
64.7
( 51.2 - 78.2 )
74.6
( 64.9 - 84.4 )
16 or 17
76.1
( 69.3 - 83.0 )
71.7
( 63.7 - 79.8 )
80.4
( 74.8 - 86.0 )
18 or older
75.2
( 54.7 - 95.8 )
.
.
.
.
9th
63.1
( 51.7 - 74.5 )
56.6
( 46.5 - 66.7 )
69.8
( 55.9 - 83.8 )
10th
76.1
( 70.1 - 82.2 )
71.7
( 61.6 - 81.8 )
81.0
( 78.1 - 83.9 )
11th
70.4
( 60.5 - 80.2 )
63.9
( 51.3 - 76.5 )
77.0
( 69.8 - 84.2 )
12th
81.7
( 71.2 - 92.1 )
78.8
( 63.8 - 93.9 )
84.6
( 75.0 - 94.1 )
American Indian/Alaska Native*
.
.
.
.
.
.
Asian*
.
.
.
.
.
.
Black/African American*
.
.
.
.
.
.
Native Hawaiian/Other Pacific Islander*
.
.
.
.
.
.
White*
70.7
( 60.2 - 81.2 )
66.5
( 53.4 - 79.6 )
75.2
( 67.3 - 83.1 )
White Hispanic
74.0
( 65.9 - 82.0 )
.
.
.
.
Other
80.9
( 67.8 - 94.0 )
74.2
( 52.9 - 95.4 )
87.6
( 80.3 - 95.0 )
*Non-Hispanic. . = Less than 50 students in the subgroup. Version: HS21OCT2014
[email protected]
2013 HEALTHY KIDS COLORADO SURVEY RESULTS Region 4 High School Summary Tables - Weighted Data Table 67. Percentage of students who think a typical student binge drank 1+ days in the past 30 days Total
Age
Grade
Race/Ethnicity
Male
Female
Percentage
95% confidence interval
Percentage
95% confidence interval
Percentage
95% confidence interval
Total
59.3
( 47.8 - 70.8 )
53.0
( 40.4 - 65.7 )
65.8
( 56.1 - 75.5 )
15 or younger
55.3
( 46.0 - 64.7 )
49.2
( 39.4 - 59.0 )
61.6
( 51.8 - 71.4 )
16 or 17
63.6
( 51.7 - 75.6 )
57.0
( 43.1 - 70.8 )
70.0
( 60.1 - 79.8 )
18 or older
56.5
( 34.2 - 78.8 )
.
.
.
.
9th
48.9
( 39.9 - 58.0 )
42.1
( 33.4 - 50.7 )
56.1
( 43.4 - 68.8 )
10th
59.8
( 52.1 - 67.5 )
49.6
( 39.3 - 59.8 )
70.8
( 64.2 - 77.4 )
11th
62.9
( 50.4 - 75.4 )
60.0
( 45.6 - 74.5 )
65.8
( 53.7 - 77.9 )
12th
65.3
( 48.5 - 82.1 )
59.4
( 40.1 - 78.7 )
71.2
( 55.9 - 86.5 )
American Indian/Alaska Native*
.
.
.
.
.
.
Asian*
.
.
.
.
.
.
Black/African American*
.
.
.
.
.
.
Native Hawaiian/Other Pacific Islander*
.
.
.
.
.
.
White*
56.7
( 44.4 - 69.0 )
49.7
( 36.4 - 63.0 )
64.1
( 53.7 - 74.4 )
White Hispanic
62.8
( 47.7 - 77.9 )
.
.
.
.
Other
62.6
( 45.1 - 80.2 )
60.6
( 42.0 - 79.2 )
64.3
( 43.1 - 85.5 )
*Non-Hispanic. . = Less than 50 students in the subgroup. Version: HS21OCT2014
[email protected]
2013 HEALTHY KIDS COLORADO SURVEY RESULTS Region 4 High School Summary Tables - Weighted Data Table 68. Percentage of students who feel it would be sort of easy or very easy to get alcohol if they wanted Total
Age
Grade
Race/Ethnicity
Male
Female
Percentage
95% confidence interval
Percentage
95% confidence interval
Percentage
95% confidence interval
Total
52.2
( 46.9 - 57.5 )
55.5
( 48.1 - 62.9 )
48.7
( 45.1 - 52.3 )
15 or younger
44.8
( 38.3 - 51.4 )
51.1
( 41.0 - 61.3 )
38.1
( 30.2 - 46.0 )
16 or 17
57.3
( 50.0 - 64.6 )
57.9
( 45.1 - 70.6 )
56.7
( 50.1 - 63.3 )
18 or older
64.5
( 49.2 - 79.7 )
.
.
.
.
9th
37.2
( 31.0 - 43.5 )
43.1
( 36.5 - 49.8 )
31.1
( 23.3 - 38.9 )
10th
50.0
( 45.3 - 54.7 )
55.6
( 45.6 - 65.7 )
43.9
( 29.4 - 58.5 )
11th
59.5
( 50.5 - 68.6 )
58.0
( 40.0 - 76.0 )
61.1
( 47.2 - 75.0 )
12th
62.0
( 52.8 - 71.3 )
65.7
( 52.3 - 79.1 )
58.3
( 47.8 - 68.8 )
American Indian/Alaska Native*
.
.
.
.
.
.
Asian*
.
.
.
.
.
.
Black/African American*
.
.
.
.
.
.
Native Hawaiian/Other Pacific Islander*
.
.
.
.
.
.
White*
49.6
( 41.2 - 58.0 )
53.3
( 44.9 - 61.7 )
45.7
( 36.8 - 54.6 )
White Hispanic
54.6
( 46.5 - 62.7 )
.
.
.
.
Other
70.1
( 61.8 - 78.4 )
69.7
( 64.3 - 75.2 )
70.1
( 52.7 - 87.5 )
*Non-Hispanic. . = Less than 50 students in the subgroup. Version: HS21OCT2014
[email protected]
2013 HEALTHY KIDS COLORADO SURVEY RESULTS Region 4 High School Summary Tables - Weighted Data Table 69. Among students who reported current alcohol use, the percentage who usually got the alcohol they drank from someone who gave it to them during the past 30 days Total
Age
Race/Ethnicity
Female
Percentage
95% confidence interval
Percentage
95% confidence interval
Percentage
95% confidence interval
Total
36.3
( 34.9 - 37.8 )
29.0
( 23.8 - 34.1 )
44.0
( 39.8 - 48.1 )
15 or younger
37.3
( 30.5 - 44.1 )
32.4
( 24.2 - 40.6 )
41.9
( 30.5 - 53.3 )
16 or 17
39.0
( 34.3 - 43.7 )
31.0
( 19.9 - 42.1 )
46.8
( 41.5 - 52.0 )
.
.
.
.
.
.
9th
33.6
( 13.6 - 53.6 )
.
.
.
.
10th
38.8
( 30.7 - 47.0 )
.
.
48.2
( 40.8 - 55.5 )
11th
42.9
( 32.4 - 53.5 )
30.1
( 19.0 - 41.2 )
57.8
( 46.6 - 69.1 )
12th
31.9
( 25.6 - 38.3 )
28.9
( 23.2 - 34.5 )
35.0
( 25.5 - 44.6 )
American Indian/Alaska Native*
.
.
.
.
.
.
Asian*
.
.
.
.
.
.
Black/African American*
.
.
.
.
.
.
Native Hawaiian/Other Pacific Islander*
.
.
.
.
.
.
41.1
( 35.8 - 46.3 )
37.1
( 29.0 - 45.2 )
45.0
( 39.1 - 50.9 )
.
.
.
.
.
.
32.3
( 7.3 - 57.3 )
.
.
.
.
18 or older
Grade
Male
White* White Hispanic Other
*Non-Hispanic. . = Less than 50 students in the subgroup. Version: HS21OCT2014
[email protected]
2013 HEALTHY KIDS COLORADO SURVEY RESULTS Region 4 High School Summary Tables - Weighted Data Table 70. Percentage of students who usually drank in a public setting, on school property, or riding in a car of all student who drank in past 12 months Total
Age
Race/Ethnicity
Female
Percentage
95% confidence interval
Percentage
95% confidence interval
Percentage
95% confidence interval
Total
13.4
( 7.4 - 19.5 )
12.6
( 5.1 - 20.0 )
14.0
( 8.1 - 19.9 )
15 or younger
14.8
( 9.2 - 20.4 )
9.9
( 0.0 - 19.8 )
18.6
( 12.6 - 24.6 )
16 or 17
9.8
( 4.6 - 14.9 )
7.2
( 1.7 - 12.6 )
11.8
( 1.8 - 21.9 )
.
.
.
.
.
.
9th
20.0
( 6.7 - 33.3 )
.
.
.
.
10th
5.7
( 0.5 - 10.9 )
.
.
.
.
11th
14.1
( 6.5 - 21.7 )
.
.
16.6
( 4.0 - 29.1 )
12th
15.6
( 6.3 - 24.8 )
.
.
8.1
( 1.0 - 15.2 )
American Indian/Alaska Native*
.
.
.
.
.
.
Asian*
.
.
.
.
.
.
Black/African American*
.
.
.
.
.
.
Native Hawaiian/Other Pacific Islander*
.
.
.
.
.
.
11.6
( 7.0 - 16.1 )
9.7
( 3.8 - 15.6 )
13.2
( 5.4 - 21.1 )
.
.
.
.
.
.
10.8
( 0.0 - 23.5 )
.
.
.
.
18 or older
Grade
Male
White* White Hispanic Other
*Non-Hispanic. . = Less than 50 students in the subgroup. Version: HS21OCT2014
[email protected]
2013 HEALTHY KIDS COLORADO SURVEY RESULTS Region 4 High School Summary Tables - Weighted Data Table 71. Percentage of students who think people who have one or two drinks nearly every day have moderate/great risk of harming themselves Total
Age
Grade
Race/Ethnicity
Male
Female
Percentage
95% confidence interval
Percentage
95% confidence interval
Percentage
95% confidence interval
Total
71.6
( 67.7 - 75.6 )
64.4
( 58.4 - 70.5 )
79.3
( 74.8 - 83.8 )
15 or younger
72.2
( 68.3 - 76.1 )
64.9
( 57.0 - 72.7 )
80.1
( 72.7 - 87.6 )
16 or 17
72.8
( 65.0 - 80.6 )
65.9
( 51.7 - 80.1 )
79.5
( 74.3 - 84.6 )
18 or older
62.2
( 52.3 - 72.0 )
.
.
.
.
9th
77.6
( 71.7 - 83.5 )
68.2
( 58.4 - 78.0 )
87.4
( 80.9 - 93.9 )
10th
68.5
( 63.5 - 73.5 )
62.5
( 57.8 - 67.2 )
75.2
( 68.3 - 82.1 )
11th
71.7
( 59.4 - 84.0 )
65.4
( 50.1 - 80.7 )
78.1
( 68.9 - 87.2 )
12th
69.6
( 62.1 - 77.2 )
62.4
( 48.9 - 75.9 )
76.9
( 72.7 - 81.2 )
American Indian/Alaska Native*
.
.
.
.
.
.
Asian*
.
.
.
.
.
.
Black/African American*
.
.
.
.
.
.
Native Hawaiian/Other Pacific Islander*
.
.
.
.
.
.
White*
70.4
( 65.9 - 75.0 )
61.9
( 54.9 - 69.0 )
79.6
( 75.6 - 83.6 )
White Hispanic
75.7
( 66.5 - 84.9 )
.
.
.
.
Other
71.2
( 61.7 - 80.7 )
62.1
( 42.0 - 82.1 )
81.9
( 70.7 - 93.0 )
*Non-Hispanic. . = Less than 50 students in the subgroup. Version: HS21OCT2014
[email protected]
2013 HEALTHY KIDS COLORADO SURVEY RESULTS Region 4 High School Summary Tables - Weighted Data Table 72. Percentage of students who think people who binge drink each weekend have moderate/great risk of harming themselves Total
Age
Grade
Race/Ethnicity
Male
Female
Percentage
95% confidence interval
Percentage
95% confidence interval
Percentage
95% confidence interval
Total
77.7
( 73.7 - 81.7 )
73.6
( 67.8 - 79.4 )
82.1
( 79.3 - 85.0 )
15 or younger
81.3
( 76.5 - 86.1 )
75.9
( 69.8 - 82.1 )
87.2
( 83.2 - 91.2 )
16 or 17
76.9
( 70.8 - 82.9 )
73.8
( 66.0 - 81.7 )
79.8
( 73.5 - 86.0 )
18 or older
61.9
( 52.6 - 71.2 )
.
.
.
.
9th
84.2
( 76.5 - 91.9 )
78.2
( 68.4 - 88.0 )
90.5
( 84.5 - 96.5 )
10th
81.3
( 75.1 - 87.5 )
76.9
( 67.6 - 86.2 )
86.3
( 81.0 - 91.6 )
11th
75.9
( 66.7 - 85.1 )
71.2
( 62.4 - 80.1 )
80.6
( 69.9 - 91.2 )
12th
69.9
( 63.7 - 76.0 )
68.7
( 60.9 - 76.5 )
71.0
( 63.9 - 78.1 )
American Indian/Alaska Native*
.
.
.
.
.
.
Asian*
.
.
.
.
.
.
Black/African American*
.
.
.
.
.
.
Native Hawaiian/Other Pacific Islander*
.
.
.
.
.
.
White*
80.2
( 76.0 - 84.3 )
77.1
( 71.4 - 82.9 )
83.5
( 77.9 - 89.1 )
White Hispanic
75.5
( 66.3 - 84.7 )
.
.
.
.
Other
77.2
( 72.8 - 81.5 )
78.8
( 70.5 - 87.1 )
76.5
( 68.8 - 84.2 )
*Non-Hispanic. . = Less than 50 students in the subgroup. Version: HS21OCT2014
[email protected]
2013 HEALTHY KIDS COLORADO SURVEY RESULTS Region 4 High School Summary Tables - Weighted Data Table 73. Percentage of students who think it is wrong/very wrong for someone their age to drink alcohol regularly (once or twice per month) Total
Age
Grade
Race/Ethnicity
Male
Female
Percentage
95% confidence interval
Percentage
95% confidence interval
Percentage
95% confidence interval
Total
66.8
( 59.1 - 74.4 )
65.7
( 55.8 - 75.5 )
68.0
( 62.1 - 73.9 )
15 or younger
76.4
( 67.9 - 85.0 )
77.1
( 67.0 - 87.2 )
76.0
( 68.2 - 83.7 )
16 or 17
59.9
( 50.7 - 69.2 )
58.3
( 46.8 - 69.8 )
61.5
( 54.1 - 68.9 )
18 or older
51.7
( 39.7 - 63.7 )
.
.
.
.
9th
86.2
( 78.6 - 93.7 )
86.5
( 77.2 - 95.7 )
85.8
( 77.7 - 94.0 )
10th
65.4
( 59.0 - 71.8 )
67.4
( 54.5 - 80.2 )
63.2
( 55.9 - 70.5 )
11th
64.7
( 54.1 - 75.3 )
59.9
( 48.5 - 71.4 )
69.4
( 59.4 - 79.5 )
12th
50.7
( 39.2 - 62.2 )
49.0
( 38.4 - 59.7 )
52.4
( 38.4 - 66.4 )
American Indian/Alaska Native*
.
.
.
.
.
.
Asian*
.
.
.
.
.
.
Black/African American*
.
.
.
.
.
.
Native Hawaiian/Other Pacific Islander*
.
.
.
.
.
.
White*
67.6
( 58.9 - 76.3 )
67.7
( 57.8 - 77.7 )
67.5
( 59.6 - 75.5 )
White Hispanic
68.8
( 60.7 - 76.8 )
.
.
.
.
Other
51.0
( 43.8 - 58.3 )
41.9
( 27.0 - 56.8 )
61.4
( 51.2 - 71.7 )
*Non-Hispanic. . = Less than 50 students in the subgroup. Version: HS21OCT2014
[email protected]
2013 HEALTHY KIDS COLORADO SURVEY RESULTS Region 4 High School Summary Tables - Weighted Data Table 74. Percentage of students who think their parents would feel it is wrong/very wrong if they drank alcohol regularly (once or twice per month) Total
Age
Grade
Race/Ethnicity
Male
Female
Percentage
95% confidence interval
Percentage
95% confidence interval
Percentage
95% confidence interval
Total
85.0
( 80.1 - 89.8 )
83.1
( 75.9 - 90.3 )
87.0
( 82.9 - 91.1 )
15 or younger
87.6
( 82.9 - 92.4 )
86.7
( 81.8 - 91.6 )
88.9
( 83.4 - 94.3 )
16 or 17
84.1
( 76.7 - 91.6 )
83.0
( 73.5 - 92.5 )
85.2
( 78.7 - 91.7 )
18 or older
74.3
( 56.5 - 92.2 )
.
.
.
.
9th
90.8
( 85.4 - 96.3 )
91.0
( 85.9 - 96.0 )
90.7
( 83.0 - 98.3 )
10th
85.1
( 81.8 - 88.5 )
84.1
( 77.6 - 90.6 )
86.3
( 81.9 - 90.7 )
11th
86.4
( 76.1 - 96.6 )
83.8
( 75.3 - 92.4 )
88.9
( 76.7 - 100.0 )
12th
78.3
( 69.0 - 87.7 )
74.8
( 59.8 - 89.9 )
81.8
( 72.3 - 91.4 )
American Indian/Alaska Native*
.
.
.
.
.
.
Asian*
.
.
.
.
.
.
Black/African American*
.
.
.
.
.
.
Native Hawaiian/Other Pacific Islander*
.
.
.
.
.
.
White*
85.7
( 80.5 - 90.9 )
83.4
( 75.6 - 91.1 )
88.2
( 84.8 - 91.6 )
White Hispanic
84.9
( 75.1 - 94.6 )
.
.
.
.
Other
73.1
( 68.6 - 77.7 )
64.3
( 49.5 - 79.1 )
83.6
( 75.4 - 91.8 )
*Non-Hispanic. . = Less than 50 students in the subgroup. Version: HS21OCT2014
[email protected]
2013 HEALTHY KIDS COLORADO SURVEY RESULTS Region 4 High School Summary Tables - Weighted Data Table 75. Percentage of students who think adults in their neighborhood would feel it is wrong/very wrong if they used alcohol regularly (at least once or twice per month) Total
Age
Grade
Race/Ethnicity
Male
Female
Percentage
95% confidence interval
Percentage
95% confidence interval
Percentage
95% confidence interval
Total
84.1
( 78.8 - 89.5 )
81.3
( 74.2 - 88.4 )
87.1
( 81.4 - 92.8 )
15 or younger
86.3
( 80.8 - 91.8 )
84.7
( 80.1 - 89.4 )
88.1
( 80.3 - 95.9 )
16 or 17
83.3
( 77.5 - 89.1 )
80.8
( 72.1 - 89.6 )
85.7
( 81.4 - 90.0 )
18 or older
76.5
( 62.4 - 90.5 )
.
.
.
.
9th
90.2
( 85.8 - 94.7 )
89.0
( 82.7 - 95.4 )
91.5
( 85.1 - 97.8 )
10th
83.4
( 75.6 - 91.3 )
81.7
( 72.5 - 90.9 )
85.3
( 78.1 - 92.5 )
11th
84.5
( 78.3 - 90.7 )
79.9
( 71.7 - 88.1 )
89.1
( 83.7 - 94.5 )
12th
79.2
( 70.3 - 88.1 )
75.9
( 65.7 - 86.0 )
82.6
( 72.8 - 92.5 )
American Indian/Alaska Native*
.
.
.
.
.
.
Asian*
.
.
.
.
.
.
Black/African American*
.
.
.
.
.
.
Native Hawaiian/Other Pacific Islander*
.
.
.
.
.
.
White*
86.2
( 82.0 - 90.5 )
83.9
( 78.0 - 89.8 )
88.7
( 85.0 - 92.3 )
White Hispanic
84.3
( 73.1 - 95.6 )
.
.
.
.
Other
75.8
( 63.7 - 88.0 )
71.4
( 57.8 - 85.0 )
81.6
( 70.3 - 93.0 )
*Non-Hispanic. . = Less than 50 students in the subgroup. Version: HS21OCT2014
[email protected]
2013 HEALTHY KIDS COLORADO SURVEY RESULTS Region 4 High School Summary Tables - Weighted Data Table 76. Percentage of students who said police would catch kids drinking alcohol in the neighborhood Total
Age
Grade
Race/Ethnicity
Male
Female
Percentage
95% confidence interval
Percentage
95% confidence interval
Percentage
95% confidence interval
Total
25.4
( 22.6 - 28.2 )
23.3
( 16.3 - 30.3 )
27.6
( 24.6 - 30.5 )
15 or younger
29.7
( 26.7 - 32.8 )
28.0
( 20.9 - 35.1 )
31.6
( 25.3 - 37.9 )
16 or 17
21.6
( 17.1 - 26.2 )
19.8
( 12.9 - 26.7 )
23.4
( 18.5 - 28.3 )
18 or older
22.2
( 8.5 - 36.0 )
.
.
.
.
9th
35.6
( 30.5 - 40.6 )
37.7
( 26.9 - 48.6 )
33.3
( 25.7 - 40.9 )
10th
24.5
( 22.0 - 27.0 )
19.0
( 11.6 - 26.4 )
30.5
( 22.0 - 38.9 )
11th
21.8
( 19.3 - 24.3 )
19.2
( 16.1 - 22.3 )
24.5
( 20.6 - 28.3 )
12th
20.1
( 13.2 - 27.1 )
17.6
( 8.0 - 27.2 )
22.6
( 12.0 - 33.2 )
American Indian/Alaska Native*
.
.
.
.
.
.
Asian*
.
.
.
.
.
.
Black/African American*
.
.
.
.
.
.
Native Hawaiian/Other Pacific Islander*
.
.
.
.
.
.
White*
27.4
( 22.9 - 31.8 )
26.6
( 19.0 - 34.2 )
28.2
( 24.7 - 31.7 )
White Hispanic
25.9
( 18.7 - 33.1 )
.
.
.
.
Other
24.3
( 17.5 - 31.0 )
20.6
( 9.9 - 31.3 )
28.4
( 9.1 - 47.6 )
*Non-Hispanic. . = Less than 50 students in the subgroup. Version: HS21OCT2014
[email protected]
2013 HEALTHY KIDS COLORADO SURVEY RESULTS Region 4 High School Summary Tables - Weighted Data Table 77. Percentage of students who have one or more best friends who have tried alcohol without their parents knowing about it Total
Age
Grade
Race/Ethnicity
Male
Female
Percentage
95% confidence interval
Percentage
95% confidence interval
Percentage
95% confidence interval
Total
51.0
( 39.7 - 62.3 )
51.6
( 40.6 - 62.6 )
50.4
( 37.8 - 63.0 )
15 or younger
45.2
( 36.9 - 53.5 )
45.5
( 37.9 - 53.1 )
44.7
( 34.0 - 55.5 )
16 or 17
54.2
( 39.6 - 68.9 )
54.0
( 38.8 - 69.2 )
54.4
( 36.1 - 72.7 )
18 or older
65.4
( 51.4 - 79.4 )
.
.
.
.
9th
34.2
( 23.3 - 45.0 )
38.0
( 27.2 - 48.7 )
30.3
( 13.8 - 46.8 )
10th
55.0
( 49.7 - 60.2 )
47.3
( 37.7 - 57.0 )
63.7
( 58.3 - 69.0 )
11th
52.4
( 35.6 - 69.2 )
55.5
( 42.9 - 68.1 )
49.3
( 24.4 - 74.2 )
12th
61.7
( 46.6 - 76.8 )
65.9
( 49.4 - 82.3 )
57.5
( 40.8 - 74.2 )
American Indian/Alaska Native*
.
.
.
.
.
.
Asian*
.
.
.
.
.
.
Black/African American*
.
.
.
.
.
.
Native Hawaiian/Other Pacific Islander*
.
.
.
.
.
.
White*
46.0
( 34.5 - 57.5 )
43.4
( 31.5 - 55.3 )
48.8
( 37.1 - 60.6 )
White Hispanic
69.2
( 50.0 - 88.4 )
.
.
.
.
Other
54.1
( 36.6 - 71.5 )
55.5
( 35.9 - 75.1 )
51.9
( 33.5 - 70.4 )
*Non-Hispanic. . = Less than 50 students in the subgroup. Version: HS21OCT2014
[email protected]
2013 HEALTHY KIDS COLORADO SURVEY RESULTS Region 4 High School Summary Tables - Weighted Data Table 78. Percentage of students who used marijuana one or more times during their life Total
Age
Grade
Race/Ethnicity
Male
Female
Percentage
95% confidence interval
Percentage
95% confidence interval
Percentage
95% confidence interval
Total
29.1
( 22.3 - 35.8 )
31.4
( 23.5 - 39.2 )
26.6
( 20.6 - 32.6 )
15 or younger
21.0
( 12.4 - 29.6 )
23.2
( 14.0 - 32.5 )
18.5
( 10.3 - 26.7 )
16 or 17
34.1
( 28.6 - 39.6 )
34.6
( 28.9 - 40.3 )
33.5
( 27.6 - 39.3 )
18 or older
45.5
( 29.6 - 61.4 )
53.6
( 32.3 - 74.9 )
33.4
( 22.4 - 44.4 )
9th
13.8
( 7.0 - 20.6 )
16.5
( 6.3 - 26.7 )
11.1
( 6.3 - 15.9 )
10th
32.1
( 23.9 - 40.3 )
33.4
( 27.0 - 39.7 )
30.7
( 19.5 - 41.9 )
11th
30.1
( 24.2 - 36.1 )
32.9
( 27.3 - 38.6 )
27.4
( 20.7 - 34.0 )
12th
39.5
( 29.6 - 49.4 )
41.6
( 27.5 - 55.8 )
37.4
( 30.1 - 44.7 )
.
.
.
.
.
.
Asian*
16.1
( 4.9 - 27.3 )
.
.
.
.
Black/African American*
36.3
( 29.9 - 42.7 )
.
.
.
.
.
.
.
.
.
.
White*
25.0
( 18.3 - 31.8 )
25.8
( 16.7 - 34.9 )
24.2
( 19.6 - 28.9 )
White Hispanic
38.5
( 24.1 - 52.9 )
43.1
( 27.3 - 58.9 )
34.2
( 17.9 - 50.5 )
Other
40.0
( 30.6 - 49.5 )
47.1
( 36.3 - 57.8 )
32.4
( 20.3 - 44.5 )
American Indian/Alaska Native*
Native Hawaiian/Other Pacific Islander*
*Non-Hispanic. . = Less than 50 students in the subgroup. Version: HS21OCT2014
[email protected]
2013 HEALTHY KIDS COLORADO SURVEY RESULTS Region 4 High School Summary Tables - Weighted Data Table 79. Percentage of students who tried marijuana for the first time before age 13 years Total
Age
Grade
Race/Ethnicity
Male
Female
Percentage
95% confidence interval
Percentage
95% confidence interval
Percentage
95% confidence interval
Total
5.3
( 3.1 - 7.6 )
7.7
( 3.7 - 11.8 )
2.8
( 1.8 - 3.8 )
15 or younger
6.1
( 2.9 - 9.3 )
8.6
( 2.8 - 14.3 )
3.6
( 2.0 - 5.1 )
16 or 17
3.8
( 2.6 - 5.0 )
5.9
( 3.9 - 7.9 )
1.7
( 0.5 - 2.9 )
18 or older
9.9
( 4.1 - 15.7 )
13.0
( 5.0 - 21.0 )
5.3
( 0.0 - 10.8 )
9th
6.0
( 1.7 - 10.2 )
8.1
( 1.3 - 15.0 )
3.8
( 1.0 - 6.6 )
10th
5.5
( 2.5 - 8.4 )
8.4
( 3.4 - 13.4 )
2.3
( 0.9 - 3.8 )
11th
3.6
( 2.4 - 4.8 )
5.0
( 2.9 - 7.2 )
2.1
( 1.0 - 3.2 )
12th
4.4
( 1.9 - 6.8 )
6.2
( 1.4 - 11.0 )
2.5
( 0.0 - 5.1 )
.
.
.
.
.
.
Asian*
4.6
( 0.0 - 9.9 )
.
.
.
.
Black/African American*
11.1
( 3.2 - 19.0 )
.
.
.
.
.
.
.
.
.
.
White*
2.8
( 1.6 - 4.0 )
3.7
( 2.0 - 5.3 )
1.9
( 1.1 - 2.6 )
White Hispanic
7.8
( 1.9 - 13.8 )
12.9
( 1.3 - 24.6 )
3.1
( 0.3 - 5.8 )
Other
15.1
( 7.7 - 22.5 )
17.9
( 8.3 - 27.5 )
11.5
( 2.8 - 20.2 )
American Indian/Alaska Native*
Native Hawaiian/Other Pacific Islander*
*Non-Hispanic. . = Less than 50 students in the subgroup. Version: HS21OCT2014
[email protected]
2013 HEALTHY KIDS COLORADO SURVEY RESULTS Region 4 High School Summary Tables - Weighted Data Table 80. Percentage of students who used marijuana one or more times during the past 30 days Total
Age
Grade
Race/Ethnicity
Male
Female
Percentage
95% confidence interval
Percentage
95% confidence interval
Percentage
95% confidence interval
Total
14.8
( 10.4 - 19.2 )
16.8
( 11.3 - 22.3 )
12.5
( 9.1 - 16.0 )
15 or younger
10.5
( 6.1 - 14.9 )
11.5
( 5.6 - 17.3 )
9.3
( 5.9 - 12.6 )
16 or 17
17.1
( 12.8 - 21.4 )
19.2
( 14.2 - 24.2 )
15.1
( 10.6 - 19.6 )
18 or older
24.9
( 11.7 - 38.1 )
30.1
( 9.4 - 50.9 )
17.1
( 7.4 - 26.7 )
9th
7.1
( 3.6 - 10.6 )
8.6
( 2.9 - 14.2 )
5.6
( 2.4 - 8.8 )
10th
15.5
( 10.3 - 20.8 )
16.0
( 7.8 - 24.3 )
15.1
( 12.4 - 17.8 )
11th
14.8
( 10.2 - 19.4 )
16.2
( 10.5 - 21.9 )
13.4
( 9.3 - 17.5 )
12th
19.9
( 12.4 - 27.4 )
24.1
( 13.5 - 34.7 )
15.8
( 8.0 - 23.5 )
.
.
.
.
.
.
Asian*
8.3
( 1.8 - 14.9 )
.
.
.
.
Black/African American*
19.5
( 10.0 - 28.9 )
.
.
.
.
.
.
.
.
.
.
White*
11.9
( 8.1 - 15.7 )
12.2
( 7.1 - 17.3 )
11.7
( 8.8 - 14.5 )
White Hispanic
19.5
( 9.7 - 29.2 )
25.0
( 14.0 - 36.0 )
14.1
( 4.7 - 23.5 )
Other
24.0
( 16.6 - 31.3 )
26.1
( 22.3 - 29.9 )
21.2
( 10.0 - 32.3 )
American Indian/Alaska Native*
Native Hawaiian/Other Pacific Islander*
*Non-Hispanic. . = Less than 50 students in the subgroup. Version: HS21OCT2014
[email protected]
2013 HEALTHY KIDS COLORADO SURVEY RESULTS Region 4 High School Summary Tables - Weighted Data Table 81. Among students who used marijuana in past 30 days, the percentage that smoked it Total 95% confidence interval
Percentage
95% confidence interval
Percentage
95% confidence interval
82.7
( 78.2 - 87.2 )
86.0
( 80.1 - 91.8 )
79.3
( 74.7 - 83.8 )
.
.
.
.
.
.
85.2
( 79.7 - 90.6 )
.
.
.
.
18 or older
.
.
.
.
.
.
9th
.
.
.
.
.
.
10th
.
.
.
.
.
.
11th
.
.
.
.
.
.
12th
.
.
.
.
.
.
American Indian/Alaska Native*
.
.
.
.
.
.
Asian*
.
.
.
.
.
.
Black/African American*
.
.
.
.
.
.
Native Hawaiian/Other Pacific Islander*
.
.
.
.
.
.
81.7
( 77.4 - 85.9 )
.
.
.
.
White Hispanic
.
.
.
.
.
.
Other
.
.
.
.
.
.
15 or younger 16 or 17
Grade
Race/Ethnicity
Female
Percentage
Total
Age
Male
White*
*Non-Hispanic. . = Less than 50 students in the subgroup. Version: HS21OCT2014
[email protected]
2013 HEALTHY KIDS COLORADO SURVEY RESULTS Region 4 High School Summary Tables - Weighted Data Table 82. Percentage of students who feel it would be sort of easy or very easy to get marijuana if they wanted Total
Age
Grade
Race/Ethnicity
Male
Female
Percentage
95% confidence interval
Percentage
95% confidence interval
Percentage
95% confidence interval
Total
43.1
( 34.4 - 51.8 )
46.4
( 34.4 - 58.3 )
39.6
( 33.7 - 45.5 )
15 or younger
31.7
( 21.6 - 41.9 )
31.1
( 21.5 - 40.7 )
32.2
( 21.0 - 43.5 )
16 or 17
50.8
( 40.2 - 61.4 )
56.4
( 41.9 - 70.9 )
45.3
( 37.0 - 53.7 )
18 or older
62.7
( 52.5 - 72.9 )
.
.
.
.
9th
21.5
( 15.2 - 27.9 )
24.6
( 18.8 - 30.4 )
18.4
( 9.1 - 27.6 )
10th
43.1
( 33.6 - 52.6 )
38.4
( 23.8 - 53.0 )
48.2
( 42.4 - 53.9 )
11th
48.8
( 38.6 - 59.0 )
57.0
( 48.5 - 65.5 )
40.3
( 25.2 - 55.5 )
12th
58.5
( 45.3 - 71.8 )
65.7
( 49.1 - 82.4 )
51.2
( 37.1 - 65.3 )
American Indian/Alaska Native*
.
.
.
.
.
.
Asian*
.
.
.
.
.
.
Black/African American*
.
.
.
.
.
.
Native Hawaiian/Other Pacific Islander*
.
.
.
.
.
.
White*
39.9
( 30.0 - 49.8 )
42.3
( 30.4 - 54.2 )
37.3
( 29.1 - 45.4 )
White Hispanic
53.3
( 44.9 - 61.8 )
.
.
.
.
Other
54.1
( 45.2 - 63.1 )
69.9
( 58.9 - 80.9 )
35.6
( 25.3 - 45.8 )
*Non-Hispanic. . = Less than 50 students in the subgroup. Version: HS21OCT2014
[email protected]
2013 HEALTHY KIDS COLORADO SURVEY RESULTS Region 4 High School Summary Tables - Weighted Data Table 83. Among students who used marijuana in past 30 days, the percentage that usually got it at school Total 95% confidence interval
Percentage
95% confidence interval
Percentage
95% confidence interval
3.9
( 0.0 - 7.7 )
5.6
( 0.0 - 11.7 )
1.6
( 0.0 - 5.2 )
.
.
.
.
.
.
1.2
( 0.0 - 3.6 )
.
.
.
.
18 or older
.
.
.
.
.
.
9th
.
.
.
.
.
.
10th
.
.
.
.
.
.
11th
.
.
.
.
.
.
12th
.
.
.
.
.
.
American Indian/Alaska Native*
.
.
.
.
.
.
Asian*
.
.
.
.
.
.
Black/African American*
.
.
.
.
.
.
Native Hawaiian/Other Pacific Islander*
.
.
.
.
.
.
2.9
( 0.0 - 6.8 )
.
.
.
.
White Hispanic
.
.
.
.
.
.
Other
.
.
.
.
.
.
15 or younger 16 or 17
Grade
Race/Ethnicity
Female
Percentage
Total
Age
Male
White*
*Non-Hispanic. . = Less than 50 students in the subgroup. Version: HS21OCT2014
[email protected]
2013 HEALTHY KIDS COLORADO SURVEY RESULTS Region 4 High School Summary Tables - Weighted Data Table 84. Percentage of students who used marijuana on school property during the past 30 days Total
Age
Grade
Race/Ethnicity
Male
Female
Percentage
95% confidence interval
Percentage
95% confidence interval
Percentage
95% confidence interval
Total
3.9
( 1.5 - 6.2 )
5.3
( 1.7 - 8.9 )
2.2
( 0.6 - 3.7 )
15 or younger
4.1
( 0.2 - 8.1 )
5.0
( 0.0 - 10.3 )
3.0
( 0.2 - 5.8 )
16 or 17
2.6
( 0.7 - 4.4 )
3.9
( 1.2 - 6.7 )
1.3
( 0.0 - 2.7 )
18 or older
9.9
( 3.5 - 16.4 )
.
.
.
.
9th
1.9
( 0.0 - 4.5 )
0.4
( 0.0 - 1.1 )
3.5
( 0.0 - 8.6 )
10th
3.7
( 0.3 - 7.2 )
6.2
( 0.0 - 12.3 )
0.9
( 0.3 - 1.5 )
11th
3.0
( 0.1 - 5.8 )
4.8
( 0.0 - 9.6 )
1.0
( 0.0 - 3.1 )
12th
5.3
( 2.6 - 8.1 )
7.7
( 2.9 - 12.5 )
3.0
( 0.0 - 6.1 )
American Indian/Alaska Native*
.
.
.
.
.
.
Asian*
.
.
.
.
.
.
Black/African American*
.
.
.
.
.
.
Native Hawaiian/Other Pacific Islander*
.
.
.
.
.
.
White*
1.6
( 0.5 - 2.8 )
1.7
( 0.7 - 2.8 )
1.5
( 0.0 - 3.3 )
White Hispanic
7.0
( 0.6 - 13.4 )
.
.
.
.
Other
15.7
( 3.6 - 27.7 )
23.5
( 0.1 - 46.8 )
6.0
( 0.0 - 16.0 )
*Non-Hispanic. . = Less than 50 students in the subgroup. Version: HS21OCT2014
[email protected]
2013 HEALTHY KIDS COLORADO SURVEY RESULTS Region 4 High School Summary Tables - Weighted Data Table 85. Percentage of students who think people who use marijuana once or twice have moderate/great risk of harming themselves Total
Age
Grade
Race/Ethnicity
Male
Female
Percentage
95% confidence interval
Percentage
95% confidence interval
Percentage
95% confidence interval
Total
41.1
( 34.4 - 47.8 )
35.6
( 27.3 - 44.0 )
47.0
( 40.3 - 53.7 )
15 or younger
49.4
( 40.5 - 58.4 )
46.1
( 39.6 - 52.6 )
53.2
( 40.2 - 66.1 )
16 or 17
35.7
( 28.0 - 43.5 )
28.2
( 18.0 - 38.5 )
43.0
( 35.3 - 50.8 )
18 or older
25.7
( 10.6 - 40.9 )
.
.
.
.
9th
58.2
( 44.0 - 72.5 )
53.8
( 39.3 - 68.3 )
62.8
( 47.4 - 78.2 )
10th
39.1
( 36.2 - 42.0 )
38.7
( 32.1 - 45.3 )
39.6
( 28.3 - 50.9 )
11th
38.4
( 25.1 - 51.8 )
27.3
( 18.7 - 35.9 )
49.8
( 33.6 - 66.1 )
12th
29.0
( 19.5 - 38.5 )
21.8
( 9.8 - 33.8 )
36.4
( 27.2 - 45.6 )
American Indian/Alaska Native*
.
.
.
.
.
.
Asian*
.
.
.
.
.
.
Black/African American*
.
.
.
.
.
.
Native Hawaiian/Other Pacific Islander*
.
.
.
.
.
.
White*
41.6
( 35.0 - 48.3 )
37.6
( 30.0 - 45.3 )
46.0
( 38.3 - 53.6 )
White Hispanic
42.5
( 28.7 - 56.3 )
.
.
.
.
Other
41.8
( 28.3 - 55.4 )
31.5
( 11.0 - 52.1 )
54.2
( 37.4 - 70.9 )
*Non-Hispanic. . = Less than 50 students in the subgroup. Version: HS21OCT2014
[email protected]
2013 HEALTHY KIDS COLORADO SURVEY RESULTS Region 4 High School Summary Tables - Weighted Data Table 86. Percentage of students who think people who use marijuana regularly have moderate/great risk of harming themselves Total
Age
Grade
Race/Ethnicity
Male
Female
Percentage
95% confidence interval
Percentage
95% confidence interval
Percentage
95% confidence interval
Total
61.4
( 55.4 - 67.4 )
56.2
( 48.5 - 64.0 )
66.9
( 61.0 - 72.8 )
15 or younger
69.2
( 60.1 - 78.2 )
66.0
( 57.5 - 74.4 )
72.7
( 61.2 - 84.2 )
16 or 17
54.5
( 48.4 - 60.7 )
48.4
( 38.8 - 58.1 )
60.5
( 53.2 - 67.9 )
18 or older
57.2
( 51.8 - 62.5 )
.
.
.
.
9th
76.4
( 63.7 - 89.1 )
74.0
( 59.7 - 88.3 )
78.9
( 65.8 - 92.0 )
10th
59.3
( 53.4 - 65.3 )
56.0
( 46.8 - 65.1 )
63.2
( 55.4 - 71.0 )
11th
60.1
( 50.8 - 69.5 )
55.5
( 47.1 - 63.9 )
64.9
( 52.0 - 77.9 )
12th
50.1
( 42.4 - 57.7 )
39.5
( 24.3 - 54.7 )
60.9
( 53.7 - 68.1 )
American Indian/Alaska Native*
.
.
.
.
.
.
Asian*
.
.
.
.
.
.
Black/African American*
.
.
.
.
.
.
Native Hawaiian/Other Pacific Islander*
.
.
.
.
.
.
White*
64.4
( 58.0 - 70.8 )
59.9
( 50.5 - 69.3 )
69.3
( 63.8 - 74.7 )
White Hispanic
55.6
( 41.5 - 69.8 )
.
.
.
.
Other
56.3
( 45.4 - 67.2 )
48.7
( 34.0 - 63.3 )
65.6
( 47.5 - 83.7 )
*Non-Hispanic. . = Less than 50 students in the subgroup. Version: HS21OCT2014
[email protected]
2013 HEALTHY KIDS COLORADO SURVEY RESULTS Region 4 High School Summary Tables - Weighted Data Table 87. Percentage of students who think it is wrong/very wrong for someone their age to use marijuana Total
Age
Grade
Race/Ethnicity
Male
Female
Percentage
95% confidence interval
Percentage
95% confidence interval
Percentage
95% confidence interval
Total
65.0
( 56.9 - 73.1 )
60.9
( 50.9 - 70.9 )
69.4
( 62.1 - 76.6 )
15 or younger
75.8
( 66.2 - 85.4 )
75.1
( 66.2 - 84.0 )
76.7
( 65.6 - 87.7 )
16 or 17
57.5
( 49.1 - 65.9 )
51.5
( 39.3 - 63.8 )
63.2
( 57.7 - 68.7 )
18 or older
47.3
( 37.9 - 56.7 )
.
.
.
.
9th
83.2
( 73.7 - 92.6 )
79.9
( 69.3 - 90.4 )
86.5
( 74.9 - 98.1 )
10th
67.3
( 59.6 - 75.0 )
68.7
( 58.6 - 78.8 )
65.6
( 57.8 - 73.5 )
11th
61.9
( 55.5 - 68.3 )
55.0
( 48.2 - 61.8 )
69.0
( 63.5 - 74.6 )
12th
47.2
( 35.0 - 59.4 )
39.1
( 24.8 - 53.5 )
55.2
( 44.0 - 66.4 )
American Indian/Alaska Native*
.
.
.
.
.
.
Asian*
.
.
.
.
.
.
Black/African American*
.
.
.
.
.
.
Native Hawaiian/Other Pacific Islander*
.
.
.
.
.
.
White*
67.7
( 59.7 - 75.8 )
64.9
( 54.6 - 75.3 )
70.8
( 64.3 - 77.2 )
White Hispanic
59.9
( 46.3 - 73.4 )
.
.
.
.
Other
60.7
( 47.8 - 73.6 )
50.0
( 34.0 - 66.0 )
73.5
( 55.4 - 91.7 )
*Non-Hispanic. . = Less than 50 students in the subgroup. Version: HS21OCT2014
[email protected]
2013 HEALTHY KIDS COLORADO SURVEY RESULTS Region 4 High School Summary Tables - Weighted Data Table 88. Percentage of students who think their parents would feel it is wrong/very wrong if they used marijuana Total
Age
Grade
Race/Ethnicity
Male
Female
Percentage
95% confidence interval
Percentage
95% confidence interval
Percentage
95% confidence interval
Total
89.1
( 85.5 - 92.7 )
87.1
( 81.7 - 92.5 )
91.4
( 88.1 - 94.7 )
15 or younger
92.7
( 89.1 - 96.4 )
91.9
( 87.2 - 96.6 )
93.9
( 91.0 - 96.8 )
16 or 17
87.1
( 82.8 - 91.4 )
84.0
( 77.3 - 90.7 )
90.2
( 85.3 - 95.0 )
18 or older
80.0
( 70.0 - 90.0 )
.
.
.
.
9th
95.5
( 92.1 - 98.9 )
95.7
( 91.4 - 99.9 )
95.4
( 89.5 - 100.0 )
10th
91.7
( 88.6 - 94.8 )
89.3
( 82.5 - 96.0 )
94.4
( 90.8 - 98.1 )
11th
84.6
( 79.0 - 90.2 )
81.5
( 73.3 - 89.7 )
87.9
( 82.5 - 93.3 )
12th
86.3
( 82.5 - 90.1 )
83.3
( 77.8 - 88.7 )
89.3
( 83.0 - 95.7 )
American Indian/Alaska Native*
.
.
.
.
.
.
Asian*
.
.
.
.
.
.
Black/African American*
.
.
.
.
.
.
Native Hawaiian/Other Pacific Islander*
.
.
.
.
.
.
White*
90.6
( 87.7 - 93.5 )
89.1
( 84.7 - 93.5 )
92.3
( 89.7 - 95.0 )
White Hispanic
91.8
( 85.3 - 98.3 )
.
.
.
.
Other
77.2
( 66.1 - 88.2 )
64.1
( 46.3 - 81.9 )
92.7
( 81.9 - 100.0 )
*Non-Hispanic. . = Less than 50 students in the subgroup. Version: HS21OCT2014
[email protected]
2013 HEALTHY KIDS COLORADO SURVEY RESULTS Region 4 High School Summary Tables - Weighted Data Table 89. Percentage of students who think adults in their neighborhood would feel it is wrong/very wrong if they use marijuana Total
Age
Grade
Race/Ethnicity
Male
Female
Percentage
95% confidence interval
Percentage
95% confidence interval
Percentage
95% confidence interval
Total
86.8
( 82.3 - 91.4 )
86.2
( 80.6 - 91.9 )
87.6
( 83.3 - 91.9 )
15 or younger
88.1
( 83.5 - 92.7 )
89.9
( 87.0 - 92.8 )
86.4
( 79.7 - 93.0 )
16 or 17
85.5
( 81.0 - 90.0 )
82.7
( 74.4 - 91.0 )
88.2
( 82.9 - 93.5 )
18 or older
87.6
( 81.8 - 93.4 )
.
.
.
.
9th
90.4
( 85.8 - 95.0 )
92.6
( 87.5 - 97.7 )
88.1
( 81.3 - 94.8 )
10th
86.4
( 77.5 - 95.3 )
85.6
( 74.8 - 96.3 )
87.4
( 80.0 - 94.7 )
11th
84.3
( 81.7 - 87.0 )
80.2
( 73.4 - 86.9 )
88.6
( 83.3 - 94.0 )
12th
87.1
( 81.0 - 93.1 )
87.7
( 83.3 - 92.1 )
86.4
( 78.3 - 94.6 )
American Indian/Alaska Native*
.
.
.
.
.
.
Asian*
.
.
.
.
.
.
Black/African American*
.
.
.
.
.
.
Native Hawaiian/Other Pacific Islander*
.
.
.
.
.
.
White*
89.2
( 86.1 - 92.3 )
88.3
( 83.7 - 92.9 )
90.1
( 86.7 - 93.5 )
White Hispanic
86.9
( 78.4 - 95.4 )
.
.
.
.
Other
79.5
( 67.3 - 91.8 )
74.3
( 58.1 - 90.5 )
86.5
( 78.1 - 94.9 )
*Non-Hispanic. . = Less than 50 students in the subgroup. Version: HS21OCT2014
[email protected]
2013 HEALTHY KIDS COLORADO SURVEY RESULTS Region 4 High School Summary Tables - Weighted Data Table 90. Percentage of students who think police would catch kids using marijuana in the neighborhood Total
Age
Grade
Race/Ethnicity
Male
Female
Percentage
95% confidence interval
Percentage
95% confidence interval
Percentage
95% confidence interval
Total
37.3
( 30.6 - 44.1 )
36.3
( 27.2 - 45.4 )
38.4
( 33.6 - 43.3 )
15 or younger
44.1
( 34.5 - 53.8 )
42.1
( 32.8 - 51.5 )
46.4
( 35.1 - 57.7 )
16 or 17
33.3
( 25.4 - 41.1 )
34.1
( 23.3 - 45.0 )
32.4
( 26.7 - 38.1 )
18 or older
21.6
( 15.4 - 27.8 )
.
.
.
.
9th
49.4
( 38.5 - 60.4 )
46.8
( 37.3 - 56.3 )
52.1
( 38.6 - 65.6 )
10th
38.3
( 30.1 - 46.5 )
37.8
( 24.6 - 51.0 )
38.9
( 28.8 - 49.0 )
11th
32.2
( 21.7 - 42.7 )
31.2
( 19.4 - 42.9 )
33.2
( 23.4 - 43.0 )
12th
30.4
( 23.4 - 37.4 )
30.6
( 18.0 - 43.2 )
30.3
( 25.4 - 35.2 )
American Indian/Alaska Native*
.
.
.
.
.
.
Asian*
.
.
.
.
.
.
Black/African American*
.
.
.
.
.
.
Native Hawaiian/Other Pacific Islander*
.
.
.
.
.
.
White*
39.4
( 31.4 - 47.4 )
40.9
( 30.6 - 51.2 )
37.9
( 31.5 - 44.3 )
White Hispanic
31.0
( 24.8 - 37.3 )
.
.
.
.
Other
33.3
( 20.5 - 46.0 )
32.6
( 14.8 - 50.4 )
34.5
( 16.2 - 52.9 )
*Non-Hispanic. . = Less than 50 students in the subgroup. Version: HS21OCT2014
[email protected]
2013 HEALTHY KIDS COLORADO SURVEY RESULTS Region 4 High School Summary Tables - Weighted Data Table 91. Percentage of students who know anyone with a medical marijuana license Total
Age
Grade
Race/Ethnicity
Male
Female
Percentage
95% confidence interval
Percentage
95% confidence interval
Percentage
95% confidence interval
Total
33.9
( 25.9 - 41.9 )
34.4
( 22.5 - 46.3 )
33.3
( 26.4 - 40.3 )
15 or younger
26.1
( 15.1 - 37.2 )
26.1
( 14.1 - 38.2 )
26.2
( 13.8 - 38.6 )
16 or 17
39.8
( 34.1 - 45.5 )
39.9
( 28.3 - 51.5 )
39.6
( 34.7 - 44.6 )
18 or older
43.0
( 24.3 - 61.6 )
.
.
.
.
9th
17.9
( 10.0 - 25.7 )
16.7
( 12.3 - 21.1 )
19.0
( 4.5 - 33.6 )
10th
36.4
( 24.8 - 48.0 )
34.1
( 15.1 - 53.0 )
39.0
( 34.4 - 43.6 )
11th
41.3
( 36.9 - 45.8 )
45.9
( 33.4 - 58.4 )
36.6
( 29.4 - 43.8 )
12th
39.1
( 30.4 - 47.9 )
40.2
( 24.3 - 56.1 )
38.0
( 31.9 - 44.2 )
American Indian/Alaska Native*
.
.
.
.
.
.
Asian*
.
.
.
.
.
.
Black/African American*
.
.
.
.
.
.
Native Hawaiian/Other Pacific Islander*
.
.
.
.
.
.
White*
29.8
( 22.2 - 37.4 )
29.1
( 17.5 - 40.6 )
30.7
( 25.2 - 36.2 )
White Hispanic
41.1
( 33.4 - 48.8 )
.
.
.
.
Other
46.0
( 32.4 - 59.6 )
50.9
( 34.3 - 67.4 )
41.6
( 17.5 - 65.6 )
*Non-Hispanic. . = Less than 50 students in the subgroup. Version: HS21OCT2014
[email protected]
2013 HEALTHY KIDS COLORADO SURVEY RESULTS Region 4 High School Summary Tables - Weighted Data Table 92. Percentage of students who used any form of cocaine, including powder, crack, or freebase, one or more times during their life Total
Age
Grade
Race/Ethnicity
Male
Female
Percentage
95% confidence interval
Percentage
95% confidence interval
Percentage
95% confidence interval
Total
5.3
( 3.4 - 7.3 )
7.3
( 3.8 - 10.8 )
3.2
( 2.2 - 4.2 )
15 or younger
4.6
( 2.3 - 6.9 )
6.1
( 3.0 - 9.3 )
3.0
( 0.4 - 5.5 )
16 or 17
4.1
( 3.1 - 5.0 )
5.3
( 3.2 - 7.5 )
2.8
( 1.4 - 4.2 )
18 or older
16.9
( 5.5 - 28.4 )
22.6
( 5.1 - 40.0 )
8.2
( 0.7 - 15.7 )
9th
2.9
( 0.7 - 5.2 )
3.3
( 0.5 - 6.0 )
2.6
( 0.0 - 5.7 )
10th
3.4
( 1.9 - 5.0 )
4.8
( 3.2 - 6.4 )
2.0
( 0.2 - 3.8 )
11th
5.1
( 3.1 - 7.2 )
7.7
( 3.3 - 12.0 )
2.6
( 0.6 - 4.5 )
12th
8.1
( 3.7 - 12.5 )
10.9
( 2.2 - 19.6 )
5.2
( 2.3 - 8.2 )
.
.
.
.
.
.
Asian*
7.0
( 0.0 - 15.6 )
.
.
.
.
Black/African American*
11.5
( 1.2 - 21.8 )
.
.
.
.
.
.
.
.
.
.
White*
2.8
( 1.6 - 3.9 )
3.7
( 1.5 - 5.8 )
1.8
( 0.9 - 2.8 )
White Hispanic
5.8
( 2.3 - 9.3 )
8.9
( 1.0 - 16.8 )
2.7
( 0.2 - 5.3 )
Other
17.0
( 8.3 - 25.7 )
20.2
( 12.8 - 27.6 )
13.0
( 1.9 - 24.1 )
American Indian/Alaska Native*
Native Hawaiian/Other Pacific Islander*
*Non-Hispanic. . = Less than 50 students in the subgroup. Version: HS21OCT2014
[email protected]
2013 HEALTHY KIDS COLORADO SURVEY RESULTS Region 4 High School Summary Tables - Weighted Data Table 93. Percentage of students who sniffed glue, breathed the contents of aerosol spray cans, or inhaled any paints or sprays to get high one or more times during their life Total
Age
Grade
Race/Ethnicity
Male
Female
Percentage
95% confidence interval
Percentage
95% confidence interval
Percentage
95% confidence interval
Total
7.6
( 5.8 - 9.5 )
7.9
( 5.8 - 10.0 )
7.2
( 5.0 - 9.4 )
15 or younger
9.2
( 4.9 - 13.4 )
8.2
( 3.7 - 12.7 )
10.0
( 5.2 - 14.9 )
16 or 17
5.7
( 4.5 - 6.9 )
6.5
( 5.6 - 7.4 )
4.9
( 2.6 - 7.2 )
18 or older
9.6
( 2.2 - 16.9 )
13.1
( 4.0 - 22.2 )
4.1
( 0.0 - 8.7 )
9th
9.1
( 4.1 - 14.0 )
7.8
( 2.1 - 13.5 )
10.3
( 5.7 - 15.0 )
10th
6.9
( 5.3 - 8.5 )
6.3
( 3.6 - 9.0 )
7.6
( 3.2 - 12.0 )
11th
7.1
( 6.1 - 8.1 )
7.9
( 5.8 - 10.1 )
6.2
( 3.3 - 9.1 )
12th
5.6
( 2.4 - 8.8 )
7.1
( 2.1 - 12.1 )
4.2
( 1.5 - 6.9 )
.
.
.
.
.
.
Asian*
10.2
( 0.0 - 22.1 )
.
.
.
.
Black/African American*
17.0
( 6.1 - 27.9 )
.
.
.
.
.
.
.
.
.
.
White*
5.3
( 4.0 - 6.6 )
4.7
( 3.1 - 6.2 )
5.9
( 3.2 - 8.6 )
White Hispanic
7.3
( 4.2 - 10.5 )
7.9
( 2.6 - 13.2 )
6.8
( 2.1 - 11.4 )
Other
16.9
( 9.3 - 24.5 )
13.8
( 8.7 - 18.9 )
19.5
( 5.7 - 33.2 )
American Indian/Alaska Native*
Native Hawaiian/Other Pacific Islander*
*Non-Hispanic. . = Less than 50 students in the subgroup. Version: HS21OCT2014
[email protected]
2013 HEALTHY KIDS COLORADO SURVEY RESULTS Region 4 High School Summary Tables - Weighted Data Table 94. Percentage of students who used heroin one or more times during their life Total
Age
Grade
Race/Ethnicity
Male
Female
Percentage
95% confidence interval
Percentage
95% confidence interval
Percentage
95% confidence interval
Total
2.8
( 1.4 - 4.3 )
3.9
( 2.0 - 5.9 )
1.5
( 0.2 - 2.8 )
15 or younger
3.0
( 1.0 - 4.9 )
4.0
( 1.1 - 6.9 )
1.8
( 0.0 - 4.0 )
16 or 17
1.4
( 0.6 - 2.1 )
2.1
( 1.1 - 3.0 )
0.7
( 0.1 - 1.2 )
18 or older
9.8
( 0.0 - 20.3 )
12.7
( 0.0 - 25.6 )
5.2
( 0.0 - 13.5 )
9th
2.1
( 0.0 - 4.2 )
2.2
( 0.0 - 5.0 )
2.1
( 0.0 - 4.5 )
10th
1.6
( 0.6 - 2.6 )
2.7
( 1.0 - 4.3 )
0.4
( 0.0 - 0.8 )
11th
1.5
( 0.3 - 2.7 )
2.6
( 0.8 - 4.5 )
0.4
( 0.0 - 1.1 )
12th
4.0
( 0.0 - 8.0 )
5.5
( 0.0 - 12.1 )
2.5
( 0.4 - 4.6 )
.
.
.
.
.
.
Asian*
5.3
( 0.0 - 14.7 )
.
.
.
.
Black/African American*
8.0
( 1.1 - 14.9 )
.
.
.
.
.
.
.
.
.
.
White*
1.2
( 0.2 - 2.2 )
1.9
( 0.3 - 3.5 )
0.4
( 0.1 - 0.8 )
White Hispanic
2.4
( 0.3 - 4.5 )
3.2
( 0.0 - 6.7 )
1.6
( 0.0 - 3.4 )
Other
10.1
( 2.1 - 18.1 )
9.7
( 2.6 - 16.7 )
9.8
( 0.0 - 19.8 )
American Indian/Alaska Native*
Native Hawaiian/Other Pacific Islander*
*Non-Hispanic. . = Less than 50 students in the subgroup. Version: HS21OCT2014
[email protected]
2013 HEALTHY KIDS COLORADO SURVEY RESULTS Region 4 High School Summary Tables - Weighted Data Table 95. Percentage of students who used methamphetamines one or more times during their life Total
Age
Grade
Race/Ethnicity
Male
Female
Percentage
95% confidence interval
Percentage
95% confidence interval
Percentage
95% confidence interval
Total
3.5
( 2.2 - 4.7 )
4.6
( 2.7 - 6.5 )
2.2
( 1.5 - 3.0 )
15 or younger
3.3
( 1.9 - 4.7 )
4.5
( 2.1 - 6.8 )
2.1
( 0.5 - 3.8 )
16 or 17
2.0
( 1.2 - 2.7 )
1.8
( 0.8 - 2.8 )
2.1
( 0.4 - 3.8 )
18 or older
12.8
( 3.1 - 22.6 )
18.7
( 6.0 - 31.4 )
3.8
( 0.0 - 10.0 )
9th
3.4
( 1.7 - 5.1 )
4.2
( 2.1 - 6.2 )
2.7
( 0.0 - 5.4 )
10th
1.2
( 0.5 - 2.0 )
0.8
( 0.0 - 1.8 )
1.7
( 0.0 - 3.6 )
11th
2.5
( 1.5 - 3.4 )
2.4
( 1.2 - 3.6 )
2.5
( 0.1 - 4.9 )
12th
5.2
( 1.9 - 8.5 )
8.5
( 1.2 - 15.7 )
1.9
( 0.9 - 2.8 )
.
.
.
.
.
.
Asian*
1.7
( 0.0 - 3.4 )
.
.
.
.
Black/African American*
10.6
( 0.6 - 20.7 )
.
.
.
.
.
.
.
.
.
.
White*
2.2
( 1.4 - 2.9 )
2.9
( 1.4 - 4.3 )
1.4
( 1.0 - 1.8 )
White Hispanic
2.7
( 0.9 - 4.5 )
3.9
( 0.0 - 8.2 )
1.6
( 0.0 - 3.4 )
Other
9.6
( 2.8 - 16.4 )
11.4
( 5.3 - 17.5 )
7.0
( 0.3 - 13.8 )
American Indian/Alaska Native*
Native Hawaiian/Other Pacific Islander*
*Non-Hispanic. . = Less than 50 students in the subgroup. Version: HS21OCT2014
[email protected]
2013 HEALTHY KIDS COLORADO SURVEY RESULTS Region 4 High School Summary Tables - Weighted Data Table 96. Percentage of students who used ecstasy one or more times during their life Total
Age
Grade
Race/Ethnicity
Male
Female
Percentage
95% confidence interval
Percentage
95% confidence interval
Percentage
95% confidence interval
Total
5.5
( 3.5 - 7.5 )
7.0
( 3.7 - 10.3 )
3.9
( 2.7 - 5.0 )
15 or younger
4.3
( 1.3 - 7.2 )
5.3
( 1.9 - 8.7 )
3.2
( 0.5 - 5.9 )
16 or 17
5.1
( 3.6 - 6.7 )
6.5
( 3.5 - 9.5 )
3.7
( 2.0 - 5.5 )
18 or older
14.4
( 5.6 - 23.2 )
17.5
( 5.7 - 29.4 )
9.7
( 1.4 - 18.0 )
9th
3.3
( 1.0 - 5.5 )
2.5
( 0.5 - 4.5 )
4.1
( 1.2 - 6.9 )
10th
3.9
( 1.9 - 5.9 )
6.2
( 2.9 - 9.5 )
1.5
( 0.2 - 2.8 )
11th
5.3
( 3.2 - 7.4 )
7.0
( 2.7 - 11.3 )
3.5
( 1.3 - 5.7 )
12th
8.2
( 4.8 - 11.5 )
10.3
( 3.5 - 17.1 )
6.1
( 2.2 - 9.9 )
.
.
.
.
.
.
Asian*
7.4
( 0.0 - 16.9 )
.
.
.
.
Black/African American*
8.7
( 1.0 - 16.4 )
.
.
.
.
.
.
.
.
.
.
White*
2.9
( 1.6 - 4.2 )
3.4
( 1.3 - 5.5 )
2.4
( 0.8 - 4.0 )
White Hispanic
7.1
( 3.5 - 10.6 )
10.1
( 2.7 - 17.6 )
4.1
( 2.1 - 6.0 )
Other
17.6
( 6.8 - 28.4 )
21.5
( 9.7 - 33.3 )
12.9
( 0.7 - 25.2 )
American Indian/Alaska Native*
Native Hawaiian/Other Pacific Islander*
*Non-Hispanic. . = Less than 50 students in the subgroup. Version: HS21OCT2014
[email protected]
2013 HEALTHY KIDS COLORADO SURVEY RESULTS Region 4 High School Summary Tables - Weighted Data Table 97. Percentage of students who have taken a prescription drug (such as OxyContin, Percocet, Vicodin, codeine, Adderall, Ritalin, or Xanax) without a doctor's prescription one or more times during their life Total
Age
Grade
Race/Ethnicity
Male
Female
Percentage
95% confidence interval
Percentage
95% confidence interval
Percentage
95% confidence interval
Total
14.6
( 11.9 - 17.4 )
16.2
( 11.1 - 21.2 )
12.9
( 10.6 - 15.1 )
15 or younger
11.7
( 7.6 - 15.8 )
11.2
( 6.2 - 16.2 )
12.2
( 7.6 - 16.8 )
16 or 17
15.7
( 13.5 - 17.9 )
17.4
( 13.8 - 21.0 )
13.8
( 10.3 - 17.3 )
18 or older
24.1
( 11.6 - 36.6 )
32.9
( 16.4 - 49.5 )
10.5
( 3.7 - 17.4 )
9th
8.2
( 4.5 - 11.9 )
5.7
( 2.1 - 9.4 )
10.7
( 5.6 - 15.8 )
10th
15.1
( 11.9 - 18.3 )
16.2
( 11.4 - 20.9 )
13.7
( 7.7 - 19.8 )
11th
14.4
( 10.3 - 18.5 )
16.8
( 10.8 - 22.8 )
12.0
( 7.6 - 16.5 )
12th
19.5
( 14.6 - 24.5 )
24.5
( 16.5 - 32.5 )
14.5
( 6.8 - 22.2 )
.
.
.
.
.
.
Asian*
13.0
( 4.4 - 21.6 )
.
.
.
.
Black/African American*
26.1
( 15.4 - 36.8 )
.
.
.
.
.
.
.
.
.
.
White*
12.8
( 10.2 - 15.3 )
14.0
( 9.3 - 18.7 )
11.4
( 9.5 - 13.3 )
White Hispanic
11.9
( 7.5 - 16.3 )
14.5
( 6.2 - 22.9 )
9.3
( 4.3 - 14.4 )
Other
26.7
( 21.6 - 31.9 )
28.0
( 20.8 - 35.3 )
24.8
( 10.8 - 38.8 )
American Indian/Alaska Native*
Native Hawaiian/Other Pacific Islander*
*Non-Hispanic. . = Less than 50 students in the subgroup. Version: HS21OCT2014
[email protected]
2013 HEALTHY KIDS COLORADO SURVEY RESULTS Region 4 High School Summary Tables - Weighted Data Table 98. Percentage of students who took steroid pills or shots without a doctor's prescription one or more times during their life Total
Age
Grade
Race/Ethnicity
Male
Female
Percentage
95% confidence interval
Percentage
95% confidence interval
Percentage
95% confidence interval
Total
3.0
( 2.0 - 4.1 )
4.0
( 2.3 - 5.6 )
1.8
( 1.1 - 2.5 )
15 or younger
2.6
( 1.1 - 4.1 )
3.7
( 2.2 - 5.2 )
1.5
( 0.0 - 3.4 )
16 or 17
2.8
( 1.4 - 4.1 )
3.1
( 1.5 - 4.7 )
2.2
( 1.0 - 3.5 )
18 or older
6.2
( 0.0 - 12.9 )
9.6
( 0.0 - 19.7 )
0.9
( 0.0 - 2.5 )
9th
1.6
( 0.0 - 3.5 )
2.0
( 0.0 - 4.1 )
1.3
( 0.0 - 3.1 )
10th
2.2
( 1.0 - 3.3 )
3.5
( 1.4 - 5.6 )
0.4
( 0.0 - 1.1 )
11th
2.7
( 1.1 - 4.4 )
2.2
( 0.3 - 4.1 )
3.2
( 1.9 - 4.6 )
12th
3.8
( 0.7 - 6.9 )
5.3
( 0.0 - 11.4 )
2.3
( 0.4 - 4.2 )
.
.
.
.
.
.
Asian*
0.0
( 0.0 - 0.0 )
.
.
.
.
Black/African American*
15.2
( 3.2 - 27.3 )
.
.
.
.
.
.
.
.
.
.
White*
1.7
( 0.7 - 2.6 )
2.3
( 0.8 - 3.8 )
0.9
( 0.3 - 1.4 )
White Hispanic
2.2
( 0.0 - 4.9 )
3.6
( 0.0 - 9.2 )
0.9
( 0.0 - 2.6 )
Other
6.0
( 0.3 - 11.6 )
3.6
( 0.3 - 6.9 )
7.7
( 0.0 - 15.6 )
American Indian/Alaska Native*
Native Hawaiian/Other Pacific Islander*
*Non-Hispanic. . = Less than 50 students in the subgroup. Version: HS21OCT2014
[email protected]
2013 HEALTHY KIDS COLORADO SURVEY RESULTS Region 4 High School Summary Tables - Weighted Data Table 99. Percentage of students who feel it would be sort of easy or very easy to get drugs like cocaine, LSD, amphetamines if they wanted Total
Age
Grade
Race/Ethnicity
Male
Female
Percentage
95% confidence interval
Percentage
95% confidence interval
Percentage
95% confidence interval
Total
13.2
( 10.8 - 15.7 )
12.3
( 9.4 - 15.1 )
14.1
( 11.6 - 16.7 )
15 or younger
11.4
( 8.0 - 14.9 )
10.8
( 8.0 - 13.6 )
11.8
( 6.1 - 17.6 )
16 or 17
13.4
( 9.2 - 17.5 )
11.3
( 6.8 - 15.8 )
15.3
( 8.1 - 22.6 )
18 or older
23.0
( 7.9 - 38.1 )
.
.
.
.
9th
9.9
( 3.7 - 16.1 )
9.3
( 2.8 - 15.8 )
10.4
( 1.3 - 19.5 )
10th
9.5
( 5.3 - 13.8 )
8.6
( 3.6 - 13.6 )
10.5
( 5.3 - 15.6 )
11th
12.9
( 7.7 - 18.1 )
10.5
( 8.3 - 12.6 )
15.5
( 5.3 - 25.7 )
12th
19.9
( 15.3 - 24.5 )
19.9
( 10.8 - 29.0 )
19.9
( 12.5 - 27.3 )
American Indian/Alaska Native*
.
.
.
.
.
.
Asian*
.
.
.
.
.
.
Black/African American*
.
.
.
.
.
.
Native Hawaiian/Other Pacific Islander*
.
.
.
.
.
.
White*
11.2
( 8.6 - 13.9 )
9.0
( 5.8 - 12.2 )
13.6
( 11.0 - 16.1 )
White Hispanic
18.8
( 13.1 - 24.6 )
.
.
.
.
Other
22.5
( 12.2 - 32.8 )
28.5
( 15.2 - 41.8 )
15.0
( 5.7 - 24.2 )
*Non-Hispanic. . = Less than 50 students in the subgroup. Version: HS21OCT2014
[email protected]
2013 HEALTHY KIDS COLORADO SURVEY RESULTS Region 4 High School Summary Tables - Weighted Data Table 100. Percentage of students who were offered drugs at school during the past 12 months Total
Age
Grade
Race/Ethnicity
Male
Female
Percentage
95% confidence interval
Percentage
95% confidence interval
Percentage
95% confidence interval
Total
13.9
( 11.3 - 16.6 )
16.0
( 13.0 - 19.0 )
11.6
( 8.5 - 14.6 )
15 or younger
14.6
( 11.2 - 18.0 )
15.3
( 12.3 - 18.4 )
13.8
( 9.2 - 18.5 )
16 or 17
12.9
( 9.7 - 16.2 )
15.4
( 11.9 - 18.9 )
10.3
( 6.7 - 13.9 )
18 or older
15.3
( 9.1 - 21.5 )
21.9
( 12.6 - 31.3 )
5.1
( 0.0 - 10.6 )
9th
14.9
( 8.1 - 21.7 )
15.3
( 6.9 - 23.7 )
14.4
( 7.8 - 21.0 )
10th
13.3
( 8.5 - 18.0 )
13.4
( 8.8 - 18.0 )
12.9
( 7.7 - 18.1 )
11th
12.3
( 9.3 - 15.4 )
16.2
( 12.6 - 19.8 )
8.4
( 4.7 - 12.0 )
12th
14.6
( 11.9 - 17.4 )
18.7
( 13.4 - 24.1 )
10.5
( 6.5 - 14.5 )
.
.
.
.
.
.
Asian*
15.0
( 7.5 - 22.4 )
.
.
.
.
Black/African American*
16.1
( 9.3 - 22.9 )
.
.
.
.
.
.
.
.
.
.
White*
11.7
( 9.4 - 14.0 )
13.3
( 10.9 - 15.8 )
9.9
( 6.6 - 13.1 )
White Hispanic
16.3
( 11.4 - 21.2 )
18.4
( 11.5 - 25.4 )
14.2
( 9.2 - 19.2 )
Other
26.1
( 17.4 - 34.8 )
29.1
( 18.0 - 40.2 )
22.6
( 10.0 - 35.1 )
American Indian/Alaska Native*
Native Hawaiian/Other Pacific Islander*
*Non-Hispanic. . = Less than 50 students in the subgroup. Version: HS21OCT2014
[email protected]
2013 HEALTHY KIDS COLORADO SURVEY RESULTS Region 4 High School Summary Tables - Weighted Data Table 101. Percentage of students who talked with parent about substance dangers during the past 12 months Total
Age
Grade
Race/Ethnicity
Male
Female
Percentage
95% confidence interval
Percentage
95% confidence interval
Percentage
95% confidence interval
Total
52.4
( 48.4 - 56.4 )
50.0
( 45.9 - 54.1 )
55.1
( 50.9 - 59.2 )
15 or younger
51.4
( 45.9 - 56.9 )
47.0
( 40.9 - 53.1 )
56.3
( 47.7 - 64.8 )
16 or 17
55.7
( 50.8 - 60.6 )
54.6
( 48.2 - 61.0 )
56.8
( 49.5 - 64.1 )
18 or older
38.0
( 31.1 - 45.0 )
.
.
.
.
9th
53.0
( 45.7 - 60.3 )
49.0
( 41.9 - 56.1 )
57.2
( 41.9 - 72.5 )
10th
52.3
( 47.8 - 56.8 )
47.7
( 38.5 - 56.9 )
57.6
( 54.7 - 60.5 )
11th
56.5
( 48.9 - 64.2 )
56.7
( 51.0 - 62.4 )
56.3
( 44.9 - 67.8 )
12th
48.9
( 41.8 - 56.0 )
46.7
( 33.8 - 59.7 )
51.1
( 37.2 - 64.9 )
American Indian/Alaska Native*
.
.
.
.
.
.
Asian*
.
.
.
.
.
.
Black/African American*
.
.
.
.
.
.
Native Hawaiian/Other Pacific Islander*
.
.
.
.
.
.
White*
53.8
( 46.2 - 61.4 )
50.4
( 41.9 - 59.0 )
57.5
( 50.1 - 64.8 )
White Hispanic
58.4
( 45.2 - 71.7 )
.
.
.
.
Other
46.5
( 37.6 - 55.4 )
28.7
( 14.3 - 43.1 )
66.1
( 52.9 - 79.3 )
*Non-Hispanic. . = Less than 50 students in the subgroup. Version: HS21OCT2014
[email protected]
2013 HEALTHY KIDS COLORADO SURVEY RESULTS Region 4 High School Summary Tables - Weighted Data Table 102. Percentage of students who heard, read, or watched an advertisement about preventing tobacco, alcohol, or other drug use sometimes or a lot in past 12 months Total
Age
Grade
Race/Ethnicity
Male
Female
Percentage
95% confidence interval
Percentage
95% confidence interval
Percentage
95% confidence interval
Total
74.0
( 70.0 - 77.9 )
76.6
( 70.6 - 82.6 )
71.3
( 65.0 - 77.6 )
15 or younger
74.3
( 68.9 - 79.7 )
75.5
( 69.0 - 82.0 )
73.2
( 65.1 - 81.4 )
16 or 17
74.2
( 69.0 - 79.4 )
77.8
( 67.9 - 87.6 )
70.7
( 62.0 - 79.4 )
18 or older
70.1
( 60.9 - 79.4 )
.
.
.
.
9th
71.8
( 60.6 - 83.0 )
72.3
( 59.6 - 84.9 )
71.4
( 55.8 - 86.9 )
10th
76.0
( 73.1 - 78.9 )
74.5
( 71.5 - 77.5 )
77.6
( 72.0 - 83.2 )
11th
74.5
( 67.8 - 81.2 )
82.9
( 76.2 - 89.6 )
65.6
( 55.4 - 75.7 )
12th
73.5
( 66.6 - 80.4 )
76.4
( 66.1 - 86.7 )
70.7
( 59.8 - 81.6 )
American Indian/Alaska Native*
.
.
.
.
.
.
Asian*
.
.
.
.
.
.
Black/African American*
.
.
.
.
.
.
Native Hawaiian/Other Pacific Islander*
.
.
.
.
.
.
White*
74.6
( 67.6 - 81.6 )
76.1
( 66.2 - 86.0 )
73.1
( 67.2 - 78.9 )
White Hispanic
75.4
( 68.4 - 82.5 )
.
.
.
.
Other
77.9
( 66.0 - 89.7 )
75.8
( 55.0 - 96.6 )
81.1
( 70.5 - 91.8 )
*Non-Hispanic. . = Less than 50 students in the subgroup. Version: HS21OCT2014
[email protected]
2013 HEALTHY KIDS COLORADO SURVEY RESULTS Region 4 High School Summary Tables - Weighted Data Table 103. Percentage of students who saw/heard advertisements about preventing use of tobacco, alcohol, or other drugs during the past 30 days Total
Age
Grade
Race/Ethnicity
Male
Female
Percentage
95% confidence interval
Percentage
95% confidence interval
Percentage
95% confidence interval
Total
87.7
( 85.1 - 90.3 )
87.7
( 84.6 - 90.8 )
87.7
( 84.1 - 91.3 )
15 or younger
87.7
( 84.2 - 91.2 )
85.8
( 78.3 - 93.3 )
89.7
( 84.7 - 94.7 )
16 or 17
87.7
( 85.1 - 90.2 )
89.4
( 86.4 - 92.5 )
85.9
( 82.3 - 89.6 )
18 or older
87.9
( 79.9 - 96.0 )
.
.
.
.
9th
86.1
( 80.5 - 91.6 )
86.1
( 81.0 - 91.3 )
86.0
( 75.2 - 96.8 )
10th
87.3
( 80.2 - 94.3 )
79.5
( 69.9 - 89.1 )
96.2
( 93.4 - 98.9 )
11th
90.5
( 87.5 - 93.6 )
95.5
( 90.4 - 100.0 )
85.5
( 79.3 - 91.7 )
12th
87.1
( 81.2 - 93.0 )
89.7
( 80.2 - 99.2 )
84.5
( 77.8 - 91.2 )
American Indian/Alaska Native*
.
.
.
.
.
.
Asian*
.
.
.
.
.
.
Black/African American*
.
.
.
.
.
.
Native Hawaiian/Other Pacific Islander*
.
.
.
.
.
.
White*
88.5
( 85.5 - 91.5 )
87.6
( 84.0 - 91.2 )
89.4
( 84.5 - 94.3 )
White Hispanic
86.3
( 78.1 - 94.5 )
.
.
.
.
Other
91.8
( 86.1 - 97.5 )
91.3
( 83.1 - 99.5 )
92.2
( 86.0 - 98.3 )
*Non-Hispanic. . = Less than 50 students in the subgroup. Version: HS21OCT2014
[email protected]
2013 HEALTHY KIDS COLORADO SURVEY RESULTS Region 4 High School Summary Tables - Weighted Data Table 104. Percentage of students who heard, read, or watched an advertisement about promoting tobacco, alcohol, or other drug use sometimes or a lot in past 12 months Total
Age
Grade
Race/Ethnicity
Male
Female
Percentage
95% confidence interval
Percentage
95% confidence interval
Percentage
95% confidence interval
Total
41.4
( 37.4 - 45.4 )
44.5
( 39.5 - 49.6 )
38.2
( 32.4 - 43.9 )
15 or younger
42.4
( 38.5 - 46.3 )
46.0
( 40.5 - 51.5 )
38.8
( 30.3 - 47.3 )
16 or 17
40.8
( 35.3 - 46.3 )
44.2
( 40.4 - 48.0 )
37.5
( 29.0 - 45.9 )
18 or older
39.2
( 21.8 - 56.7 )
.
.
.
.
9th
42.2
( 39.8 - 44.6 )
47.4
( 39.4 - 55.4 )
36.8
( 25.7 - 48.0 )
10th
41.1
( 35.6 - 46.5 )
43.5
( 38.0 - 49.1 )
38.4
( 31.6 - 45.2 )
11th
41.8
( 38.9 - 44.8 )
45.1
( 36.2 - 54.0 )
38.5
( 32.7 - 44.3 )
12th
40.2
( 29.3 - 51.1 )
40.7
( 31.5 - 49.9 )
39.7
( 25.5 - 53.9 )
American Indian/Alaska Native*
.
.
.
.
.
.
Asian*
.
.
.
.
.
.
Black/African American*
.
.
.
.
.
.
Native Hawaiian/Other Pacific Islander*
.
.
.
.
.
.
White*
39.4
( 35.3 - 43.5 )
40.4
( 34.2 - 46.7 )
38.3
( 33.6 - 43.1 )
White Hispanic
44.3
( 35.2 - 53.3 )
.
.
.
.
Other
46.7
( 30.3 - 63.2 )
47.9
( 20.7 - 75.2 )
46.1
( 35.3 - 56.9 )
*Non-Hispanic. . = Less than 50 students in the subgroup. Version: HS21OCT2014
[email protected]
2013 HEALTHY KIDS COLORADO SURVEY RESULTS Region 4 High School Summary Tables - Weighted Data Table 105. Percentage of students who saw/heard/read advertisements about promoting use of tobacco, alcohol, or other drugs during the past 30 days Total
Age
Grade
Race/Ethnicity
Male
Female
Percentage
95% confidence interval
Percentage
95% confidence interval
Percentage
95% confidence interval
Total
61.7
( 58.5 - 65.0 )
66.7
( 61.5 - 71.9 )
56.4
( 51.9 - 61.0 )
15 or younger
59.7
( 56.7 - 62.8 )
63.7
( 59.8 - 67.6 )
55.5
( 48.1 - 62.8 )
16 or 17
63.9
( 57.2 - 70.7 )
70.5
( 63.0 - 78.0 )
57.3
( 48.9 - 65.7 )
18 or older
60.4
( 44.2 - 76.6 )
.
.
.
.
9th
58.0
( 51.1 - 64.8 )
64.3
( 54.7 - 73.9 )
51.4
( 39.7 - 63.2 )
10th
58.7
( 51.1 - 66.4 )
59.2
( 49.7 - 68.8 )
58.1
( 51.7 - 64.5 )
11th
65.6
( 57.9 - 73.3 )
73.8
( 64.5 - 83.0 )
57.2
( 46.8 - 67.7 )
12th
64.7
( 58.4 - 71.0 )
68.7
( 58.8 - 78.6 )
60.4
( 56.5 - 64.4 )
American Indian/Alaska Native*
.
.
.
.
.
.
Asian*
.
.
.
.
.
.
Black/African American*
.
.
.
.
.
.
Native Hawaiian/Other Pacific Islander*
.
.
.
.
.
.
White*
60.8
( 55.6 - 66.1 )
65.7
( 59.7 - 71.7 )
55.5
( 49.7 - 61.4 )
White Hispanic
60.3
( 49.8 - 70.7 )
.
.
.
.
Other
68.5
( 56.3 - 80.7 )
68.5
( 46.9 - 90.1 )
68.1
( 63.7 - 72.4 )
*Non-Hispanic. . = Less than 50 students in the subgroup. Version: HS21OCT2014
[email protected]
2013 HEALTHY KIDS COLORADO SURVEY RESULTS Region 4 High School Summary Tables - Weighted Data Table 106. Percentage of students who ever had sexual intercourse Total
Age
Grade
Race/Ethnicity
Male
Female
Percentage
95% confidence interval
Percentage
95% confidence interval
Percentage
95% confidence interval
Total
26.2
( 20.2 - 32.3 )
27.8
( 20.9 - 34.6 )
24.7
( 18.9 - 30.4 )
15 or younger
13.9
( 10.5 - 17.4 )
16.1
( 11.9 - 20.3 )
11.7
( 8.4 - 15.1 )
16 or 17
34.7
( 26.3 - 43.2 )
34.6
( 25.3 - 43.9 )
35.0
( 26.8 - 43.2 )
18 or older
45.3
( 30.3 - 60.3 )
47.5
( 32.8 - 62.2 )
42.1
( 25.7 - 58.5 )
9th
9.9
( 5.4 - 14.5 )
12.7
( 6.8 - 18.7 )
7.2
( 2.8 - 11.6 )
10th
20.7
( 17.4 - 24.1 )
22.1
( 18.3 - 25.8 )
19.5
( 15.5 - 23.5 )
11th
29.9
( 22.6 - 37.2 )
30.3
( 23.8 - 36.8 )
29.5
( 20.0 - 39.0 )
12th
43.6
( 30.9 - 56.4 )
44.9
( 29.9 - 59.9 )
42.4
( 31.4 - 53.5 )
.
.
.
.
.
.
Asian*
15.7
( 9.7 - 21.8 )
.
.
.
.
Black/African American*
37.4
( 23.0 - 51.8 )
.
.
.
.
.
.
.
.
.
.
White*
23.2
( 16.2 - 30.1 )
22.2
( 13.5 - 30.9 )
24.2
( 19.1 - 29.4 )
White Hispanic
29.2
( 23.5 - 35.0 )
38.4
( 26.2 - 50.6 )
21.0
( 12.8 - 29.1 )
Other
39.9
( 33.6 - 46.1 )
40.3
( 27.9 - 52.6 )
39.4
( 32.9 - 46.0 )
American Indian/Alaska Native*
Native Hawaiian/Other Pacific Islander*
*Non-Hispanic. . = Less than 50 students in the subgroup. Version: HS21OCT2014
[email protected]
2013 HEALTHY KIDS COLORADO SURVEY RESULTS Region 4 High School Summary Tables - Weighted Data Table 107. Percentage of students who had sexual intercourse for the first time before age 13 years Total
Age
Grade
Race/Ethnicity
Male
Female
Percentage
95% confidence interval
Percentage
95% confidence interval
Percentage
95% confidence interval
Total
2.5
( 1.6 - 3.3 )
3.4
( 2.0 - 4.8 )
1.5
( 0.7 - 2.4 )
15 or younger
3.1
( 2.1 - 4.1 )
4.3
( 2.1 - 6.4 )
2.1
( 0.3 - 3.8 )
16 or 17
1.2
( 0.6 - 1.8 )
1.3
( 0.5 - 2.2 )
1.1
( 0.2 - 1.9 )
18 or older
6.4
( 1.7 - 11.0 )
10.0
( 3.4 - 16.6 )
1.0
( 0.0 - 2.7 )
9th
2.3
( 1.2 - 3.3 )
2.5
( 0.6 - 4.4 )
2.1
( 0.4 - 3.7 )
10th
2.2
( 0.9 - 3.5 )
2.7
( 1.3 - 4.0 )
1.7
( 0.1 - 3.3 )
11th
1.0
( 0.2 - 1.8 )
1.6
( 0.1 - 3.0 )
0.4
( 0.0 - 1.2 )
12th
3.5
( 1.2 - 5.8 )
5.3
( 0.8 - 9.8 )
1.7
( 0.6 - 2.9 )
.
.
.
.
.
.
Asian*
0.0
( 0.0 - 0.0 )
.
.
.
.
Black/African American*
6.6
( 0.0 - 13.7 )
.
.
.
.
.
.
.
.
.
.
White*
1.9
( 1.2 - 2.7 )
2.4
( 1.1 - 3.7 )
1.5
( 1.0 - 2.0 )
White Hispanic
2.2
( 0.3 - 4.1 )
3.6
( 0.0 - 8.5 )
1.0
( 0.0 - 2.7 )
Other
5.8
( 0.7 - 10.9 )
5.3
( 1.4 - 9.2 )
6.2
( 0.0 - 14.0 )
American Indian/Alaska Native*
Native Hawaiian/Other Pacific Islander*
*Non-Hispanic. . = Less than 50 students in the subgroup. Version: HS21OCT2014
[email protected]
2013 HEALTHY KIDS COLORADO SURVEY RESULTS Region 4 High School Summary Tables - Weighted Data Table 108. Percentage of students who had sexual intercourse with four or more people during their life Total
Age
Grade
Race/Ethnicity
Male
Female
Percentage
95% confidence interval
Percentage
95% confidence interval
Percentage
95% confidence interval
Total
7.8
( 6.4 - 9.3 )
8.6
( 7.0 - 10.1 )
7.1
( 4.9 - 9.4 )
15 or younger
3.9
( 2.3 - 5.4 )
4.9
( 2.1 - 7.6 )
3.0
( 2.0 - 3.9 )
16 or 17
10.0
( 8.0 - 12.0 )
9.4
( 6.6 - 12.2 )
10.6
( 7.1 - 14.2 )
18 or older
17.5
( 10.3 - 24.6 )
21.6
( 11.7 - 31.4 )
11.5
( 0.3 - 22.7 )
9th
2.5
( 0.7 - 4.3 )
3.5
( 0.6 - 6.5 )
1.5
( 0.1 - 2.9 )
10th
5.4
( 3.6 - 7.2 )
6.3
( 3.1 - 9.6 )
4.4
( 2.7 - 6.1 )
11th
8.3
( 5.6 - 11.0 )
8.7
( 5.6 - 11.8 )
7.8
( 2.5 - 13.2 )
12th
14.4
( 10.3 - 18.6 )
14.3
( 7.9 - 20.6 )
14.6
( 10.1 - 19.1 )
.
.
.
.
.
.
Asian*
6.6
( 1.1 - 12.1 )
.
.
.
.
Black/African American*
17.2
( 13.7 - 20.7 )
.
.
.
.
.
.
.
.
.
.
White*
6.1
( 4.5 - 7.7 )
5.9
( 3.4 - 8.5 )
6.3
( 3.7 - 8.9 )
White Hispanic
8.2
( 5.9 - 10.5 )
11.2
( 4.0 - 18.4 )
5.5
( 1.7 - 9.4 )
Other
16.4
( 10.1 - 22.6 )
17.0
( 4.6 - 29.4 )
15.7
( 11.0 - 20.5 )
American Indian/Alaska Native*
Native Hawaiian/Other Pacific Islander*
*Non-Hispanic. . = Less than 50 students in the subgroup. Version: HS21OCT2014
[email protected]
2013 HEALTHY KIDS COLORADO SURVEY RESULTS Region 4 High School Summary Tables - Weighted Data Table 109. Percentage of students who had sexual intercourse with one or more people during the past three months Total
Age
Grade
Race/Ethnicity
Male
Female
Percentage
95% confidence interval
Percentage
95% confidence interval
Percentage
95% confidence interval
Total
18.9
( 14.7 - 23.1 )
19.3
( 14.7 - 24.0 )
18.6
( 14.8 - 22.4 )
15 or younger
9.5
( 6.9 - 12.1 )
10.4
( 7.1 - 13.6 )
8.7
( 5.8 - 11.7 )
16 or 17
25.6
( 19.4 - 31.9 )
24.4
( 17.4 - 31.5 )
26.9
( 21.4 - 32.5 )
18 or older
32.6
( 21.0 - 44.3 )
35.3
( 25.5 - 45.1 )
28.7
( 10.4 - 47.1 )
9th
5.3
( 2.1 - 8.5 )
7.2
( 3.0 - 11.4 )
3.5
( 0.0 - 7.4 )
10th
15.3
( 12.9 - 17.8 )
14.6
( 11.3 - 17.8 )
16.3
( 12.6 - 20.0 )
11th
22.3
( 14.7 - 29.9 )
21.0
( 14.1 - 27.8 )
23.7
( 15.5 - 31.8 )
12th
31.8
( 20.9 - 42.6 )
32.9
( 20.2 - 45.7 )
30.6
( 21.4 - 39.8 )
.
.
.
.
.
.
Asian*
13.2
( 9.2 - 17.2 )
.
.
.
.
Black/African American*
26.0
( 12.6 - 39.3 )
.
.
.
.
.
.
.
.
.
.
White*
16.4
( 11.6 - 21.3 )
15.3
( 9.3 - 21.3 )
17.7
( 14.1 - 21.2 )
White Hispanic
22.1
( 17.2 - 27.0 )
27.5
( 21.3 - 33.7 )
17.2
( 9.1 - 25.4 )
Other
28.8
( 25.8 - 31.9 )
27.1
( 20.6 - 33.5 )
30.6
( 25.0 - 36.3 )
American Indian/Alaska Native*
Native Hawaiian/Other Pacific Islander*
*Non-Hispanic. . = Less than 50 students in the subgroup. Version: HS21OCT2014
[email protected]
2013 HEALTHY KIDS COLORADO SURVEY RESULTS Region 4 High School Summary Tables - Weighted Data Table 110. Among students who had sexual intercourse during the past three months, the percentage who drank alcohol or used drugs before last sexual intercourse Total
Age
Grade
Race/Ethnicity
Male
Female
Percentage
95% confidence interval
Percentage
95% confidence interval
Percentage
95% confidence interval
Total
26.9
( 20.2 - 33.5 )
34.5
( 27.1 - 41.8 )
18.9
( 10.9 - 27.0 )
15 or younger
36.3
( 28.3 - 44.3 )
.
.
.
.
16 or 17
20.7
( 10.8 - 30.6 )
24.9
( 12.7 - 37.1 )
16.9
( 8.2 - 25.6 )
18 or older
.
.
.
.
.
.
9th
.
.
.
.
.
.
10th
28.3
( 13.5 - 43.1 )
.
.
.
.
11th
20.9
( 3.0 - 38.9 )
.
.
.
.
12th
23.4
( 18.9 - 28.0 )
33.1
( 20.7 - 45.5 )
13.4
( 9.4 - 17.5 )
American Indian/Alaska Native*
.
.
.
.
.
.
Asian*
.
.
.
.
.
.
Black/African American*
.
.
.
.
.
.
Native Hawaiian/Other Pacific Islander*
.
.
.
.
.
.
24.0
( 15.8 - 32.2 )
29.1
( 19.1 - 39.1 )
19.3
( 8.2 - 30.4 )
White Hispanic
.
.
.
.
.
.
Other
.
.
.
.
.
.
White*
*Non-Hispanic. . = Less than 50 students in the subgroup. Version: HS21OCT2014
[email protected]
2013 HEALTHY KIDS COLORADO SURVEY RESULTS Region 4 High School Summary Tables - Weighted Data Table 111. Among students who had sexual intercourse during the past three months, the percentage who used a condom during last sexual intercourse Total
Age
Grade
Race/Ethnicity
Male
Female
Percentage
95% confidence interval
Percentage
95% confidence interval
Percentage
95% confidence interval
Total
64.1
( 57.6 - 70.7 )
64.6
( 53.3 - 75.9 )
63.7
( 56.4 - 71.0 )
15 or younger
64.7
( 57.9 - 71.5 )
.
.
.
.
16 or 17
67.0
( 61.2 - 72.8 )
72.5
( 63.6 - 81.4 )
62.3
( 52.0 - 72.6 )
18 or older
.
.
.
.
.
.
9th
.
.
.
.
.
.
10th
72.0
( 61.5 - 82.5 )
.
.
.
.
11th
65.3
( 54.1 - 76.6 )
.
.
.
.
12th
63.4
( 53.9 - 72.8 )
65.4
( 52.0 - 78.7 )
61.3
( 47.7 - 74.9 )
American Indian/Alaska Native*
.
.
.
.
.
.
Asian*
.
.
.
.
.
.
Black/African American*
.
.
.
.
.
.
Native Hawaiian/Other Pacific Islander*
.
.
.
.
.
.
69.1
( 59.9 - 78.3 )
70.3
( 53.7 - 86.9 )
67.9
( 57.5 - 78.4 )
White Hispanic
.
.
.
.
.
.
Other
.
.
.
.
.
.
White*
*Non-Hispanic. . = Less than 50 students in the subgroup. Version: HS21OCT2014
[email protected]
2013 HEALTHY KIDS COLORADO SURVEY RESULTS Region 4 High School Summary Tables - Weighted Data Table 112. Among students who had sexual intercourse during the past three months, the percentage who used birth control pills to prevent pregnancy before last sexual intercourse Total
Age
Grade
Race/Ethnicity
Male
Female
Percentage
95% confidence interval
Percentage
95% confidence interval
Percentage
95% confidence interval
Total
22.7
( 18.3 - 27.0 )
12.4
( 7.4 - 17.3 )
32.9
( 25.6 - 40.2 )
15 or younger
9.3
( 2.7 - 16.0 )
.
.
.
.
16 or 17
28.1
( 19.4 - 36.9 )
16.2
( 9.6 - 22.8 )
38.0
( 25.8 - 50.2 )
18 or older
.
.
.
.
.
.
9th
.
.
.
.
.
.
10th
11.2
( 4.6 - 17.8 )
.
.
.
.
11th
22.4
( 17.9 - 27.0 )
.
.
.
.
12th
31.9
( 21.9 - 41.8 )
18.3
( 13.9 - 22.7 )
45.3
( 32.2 - 58.4 )
American Indian/Alaska Native*
.
.
.
.
.
.
Asian*
.
.
.
.
.
.
Black/African American*
.
.
.
.
.
.
Native Hawaiian/Other Pacific Islander*
.
.
.
.
.
.
26.5
( 21.6 - 31.4 )
17.2
( 7.9 - 26.4 )
34.8
( 26.0 - 43.5 )
White Hispanic
.
.
.
.
.
.
Other
.
.
.
.
.
.
White*
*Non-Hispanic. . = Less than 50 students in the subgroup. Version: HS21OCT2014
[email protected]
2013 HEALTHY KIDS COLORADO SURVEY RESULTS Region 4 High School Summary Tables - Weighted Data Table 113. Among students who had sexual intercourse during the past three months, the percentage who used no method of birth control to prevent pregnancy before last sexual intercourse Total
Age
Grade
Race/Ethnicity
Male
Female
Percentage
95% confidence interval
Percentage
95% confidence interval
Percentage
95% confidence interval
Total
9.4
( 6.5 - 12.2 )
13.2
( 6.1 - 20.3 )
5.5
( 1.8 - 9.2 )
15 or younger
16.7
( 8.3 - 25.0 )
.
.
.
.
16 or 17
4.7
( 0.5 - 9.0 )
6.5
( 2.2 - 10.9 )
3.3
( 0.0 - 7.3 )
18 or older
.
.
.
.
.
.
9th
.
.
.
.
.
.
10th
9.4
( 1.2 - 17.5 )
.
.
.
.
11th
3.8
( 0.0 - 7.8 )
.
.
.
.
12th
9.2
( 3.6 - 14.9 )
15.5
( 3.5 - 27.5 )
3.0
( 0.0 - 6.2 )
American Indian/Alaska Native*
.
.
.
.
.
.
Asian*
.
.
.
.
.
.
Black/African American*
.
.
.
.
.
.
Native Hawaiian/Other Pacific Islander*
.
.
.
.
.
.
7.8
( 4.8 - 10.9 )
11.6
( 4.8 - 18.4 )
4.5
( 0.5 - 8.5 )
White Hispanic
.
.
.
.
.
.
Other
.
.
.
.
.
.
White*
*Non-Hispanic. . = Less than 50 students in the subgroup. Version: HS21OCT2014
[email protected]
2013 HEALTHY KIDS COLORADO SURVEY RESULTS Region 4 High School Summary Tables - Weighted Data Table 114. Percentage of students who described themselves as slightly or very overweight Total
Age
Grade
Race/Ethnicity
Male
Female
Percentage
95% confidence interval
Percentage
95% confidence interval
Percentage
95% confidence interval
Total
24.5
( 20.5 - 28.5 )
19.2
( 15.7 - 22.7 )
29.8
( 25.8 - 33.8 )
15 or younger
23.8
( 18.6 - 29.1 )
17.7
( 13.1 - 22.4 )
29.9
( 22.8 - 37.1 )
16 or 17
24.7
( 20.4 - 29.1 )
19.6
( 15.4 - 23.8 )
29.8
( 25.9 - 33.8 )
18 or older
26.1
( 20.7 - 31.4 )
24.1
( 16.4 - 31.9 )
29.0
( 16.7 - 41.3 )
9th
22.1
( 17.4 - 26.9 )
18.3
( 13.3 - 23.2 )
26.1
( 20.3 - 31.9 )
10th
25.0
( 20.1 - 29.9 )
16.0
( 12.3 - 19.7 )
34.6
( 30.3 - 38.9 )
11th
23.2
( 18.8 - 27.6 )
21.0
( 16.2 - 25.7 )
25.6
( 21.5 - 29.7 )
12th
27.0
( 22.5 - 31.5 )
22.0
( 15.6 - 28.4 )
32.0
( 26.3 - 37.7 )
.
.
.
.
.
.
Asian*
30.2
( 23.7 - 36.8 )
.
.
.
.
Black/African American*
32.0
( 16.9 - 47.1 )
.
.
.
.
.
.
.
.
.
.
White*
20.2
( 16.6 - 23.9 )
16.3
( 12.2 - 20.4 )
24.4
( 20.8 - 27.9 )
White Hispanic
32.8
( 27.5 - 38.1 )
30.8
( 26.3 - 35.3 )
34.8
( 27.0 - 42.6 )
Other
25.9
( 16.1 - 35.6 )
17.0
( 5.4 - 28.6 )
34.2
( 24.9 - 43.6 )
American Indian/Alaska Native*
Native Hawaiian/Other Pacific Islander*
*Non-Hispanic. . = Less than 50 students in the subgroup. Version: HS21OCT2014
[email protected]
2013 HEALTHY KIDS COLORADO SURVEY RESULTS Region 4 High School Summary Tables - Weighted Data Table 115. Percentage of students who were trying to lose weight Total
Age
Grade
Race/Ethnicity
Male
Female
Percentage
95% confidence interval
Percentage
95% confidence interval
Percentage
95% confidence interval
Total
33.9
( 29.0 - 38.8 )
19.4
( 14.7 - 24.1 )
49.0
( 45.4 - 52.6 )
15 or younger
32.2
( 26.3 - 38.0 )
19.3
( 12.4 - 26.1 )
45.0
( 40.9 - 49.0 )
16 or 17
35.7
( 31.0 - 40.4 )
19.2
( 14.1 - 24.3 )
52.8
( 48.4 - 57.1 )
18 or older
33.0
( 26.2 - 39.8 )
21.1
( 8.9 - 33.4 )
50.4
( 38.5 - 62.2 )
9th
28.9
( 23.6 - 34.1 )
19.1
( 13.0 - 25.3 )
38.7
( 33.4 - 44.0 )
10th
34.9
( 25.6 - 44.1 )
17.8
( 9.5 - 26.0 )
53.7
( 46.9 - 60.4 )
11th
33.3
( 29.4 - 37.2 )
18.4
( 13.0 - 23.8 )
48.9
( 46.7 - 51.1 )
12th
39.0
( 33.4 - 44.6 )
23.2
( 14.4 - 31.9 )
54.6
( 47.2 - 62.0 )
.
.
.
.
.
.
Asian*
36.4
( 28.2 - 44.7 )
.
.
.
.
Black/African American*
36.8
( 25.7 - 47.9 )
.
.
.
.
.
.
.
.
.
.
White*
30.8
( 25.4 - 36.1 )
15.0
( 10.7 - 19.4 )
47.6
( 42.3 - 52.9 )
White Hispanic
42.3
( 33.1 - 51.6 )
32.5
( 24.6 - 40.4 )
51.6
( 39.9 - 63.3 )
Other
32.2
( 27.0 - 37.3 )
21.8
( 14.4 - 29.2 )
42.6
( 35.1 - 50.2 )
American Indian/Alaska Native*
Native Hawaiian/Other Pacific Islander*
*Non-Hispanic. . = Less than 50 students in the subgroup. Version: HS21OCT2014
[email protected]
2013 HEALTHY KIDS COLORADO SURVEY RESULTS Region 4 High School Summary Tables - Weighted Data Table 116. Percentage of students who had a dental exam within the past 24 months Total
Age
Grade
Race/Ethnicity
Male
Female
Percentage
95% confidence interval
Percentage
95% confidence interval
Percentage
95% confidence interval
Total
92.7
( 91.9 - 93.5 )
93.2
( 91.9 - 94.5 )
92.3
( 90.1 - 94.5 )
15 or younger
93.2
( 90.6 - 95.7 )
95.8
( 93.7 - 97.8 )
91.0
( 87.3 - 94.8 )
16 or 17
93.4
( 91.0 - 95.7 )
92.2
( 88.0 - 96.4 )
94.5
( 91.7 - 97.3 )
18 or older
86.3
( 77.1 - 95.4 )
.
.
.
.
9th
94.8
( 91.9 - 97.7 )
95.1
( 91.6 - 98.6 )
94.5
( 90.4 - 98.6 )
10th
91.8
( 87.9 - 95.6 )
94.8
( 93.9 - 95.7 )
88.4
( 81.1 - 95.6 )
11th
95.2
( 93.1 - 97.2 )
94.6
( 90.8 - 98.5 )
95.7
( 92.5 - 98.9 )
12th
89.3
( 88.4 - 90.1 )
88.0
( 83.0 - 93.1 )
90.5
( 86.3 - 94.7 )
American Indian/Alaska Native*
.
.
.
.
.
.
Asian*
.
.
.
.
.
.
Black/African American*
.
.
.
.
.
.
Native Hawaiian/Other Pacific Islander*
.
.
.
.
.
.
White*
94.5
( 92.8 - 96.2 )
93.5
( 90.4 - 96.6 )
95.6
( 94.0 - 97.2 )
White Hispanic
92.3
( 85.1 - 99.5 )
.
.
.
.
Other
90.6
( 85.5 - 95.8 )
.
.
.
.
*Non-Hispanic. . = Less than 50 students in the subgroup. Version: HS21OCT2014
[email protected]
2013 HEALTHY KIDS COLORADO SURVEY RESULTS Region 4 High School Summary Tables - Weighted Data Table 117. Percentage of students who had a dental exam within the past 12 months Total
Age
Grade
Race/Ethnicity
Male
Female
Percentage
95% confidence interval
Percentage
95% confidence interval
Percentage
95% confidence interval
Total
87.4
( 86.5 - 88.3 )
87.2
( 84.4 - 89.9 )
87.6
( 84.9 - 90.3 )
15 or younger
88.8
( 86.1 - 91.4 )
92.1
( 89.9 - 94.2 )
85.8
( 80.9 - 90.8 )
16 or 17
87.3
( 83.7 - 90.8 )
84.4
( 78.6 - 90.1 )
90.2
( 86.5 - 93.9 )
18 or older
80.0
( 71.2 - 88.7 )
.
.
.
.
9th
88.4
( 82.5 - 94.3 )
89.9
( 86.4 - 93.4 )
86.9
( 76.8 - 96.9 )
10th
89.7
( 86.4 - 92.9 )
91.0
( 87.5 - 94.4 )
88.1
( 81.1 - 95.1 )
11th
89.1
( 86.4 - 91.9 )
88.8
( 84.5 - 93.0 )
89.4
( 83.5 - 95.3 )
12th
82.1
( 79.7 - 84.6 )
78.2
( 70.6 - 85.8 )
85.9
( 79.4 - 92.4 )
American Indian/Alaska Native*
.
.
.
.
.
.
Asian*
.
.
.
.
.
.
Black/African American*
.
.
.
.
.
.
Native Hawaiian/Other Pacific Islander*
.
.
.
.
.
.
White*
90.3
( 88.1 - 92.4 )
89.0
( 85.3 - 92.7 )
91.6
( 88.7 - 94.4 )
White Hispanic
87.7
( 78.8 - 96.6 )
.
.
.
.
Other
78.8
( 67.3 - 90.3 )
.
.
.
.
*Non-Hispanic. . = Less than 50 students in the subgroup. Version: HS21OCT2014
[email protected]
2013 HEALTHY KIDS COLORADO SURVEY RESULTS Region 4 High School Summary Tables - Weighted Data Table 118. Percentage of students who saw a doctor or nurse for a physical exam or check-up within the past 24 months Total
Age
Grade
Race/Ethnicity
Male
Female
Percentage
95% confidence interval
Percentage
95% confidence interval
Percentage
95% confidence interval
Total
85.9
( 82.5 - 89.2 )
84.4
( 79.4 - 89.5 )
87.6
( 84.1 - 91.1 )
15 or younger
87.0
( 79.5 - 94.5 )
84.6
( 76.8 - 92.5 )
89.7
( 81.2 - 98.3 )
16 or 17
86.4
( 84.1 - 88.7 )
86.4
( 80.1 - 92.7 )
86.6
( 83.0 - 90.2 )
18 or older
76.1
( 65.2 - 87.0 )
.
.
.
.
9th
86.4
( 79.6 - 93.3 )
80.8
( 70.8 - 90.8 )
92.1
( 87.0 - 97.2 )
10th
90.2
( 83.8 - 96.6 )
91.2
( 84.9 - 97.5 )
90.0
( 82.4 - 97.5 )
11th
89.4
( 85.4 - 93.5 )
89.5
( 80.8 - 98.2 )
90.0
( 87.2 - 92.8 )
12th
77.0
( 72.5 - 81.4 )
75.0
( 65.7 - 84.4 )
78.8
( 75.1 - 82.5 )
American Indian/Alaska Native*
.
.
.
.
.
.
Asian*
.
.
.
.
.
.
Black/African American*
.
.
.
.
.
.
Native Hawaiian/Other Pacific Islander*
.
.
.
.
.
.
White*
87.8
( 83.8 - 91.8 )
86.7
( 82.6 - 90.9 )
89.1
( 84.0 - 94.2 )
White Hispanic
86.8
( 78.0 - 95.6 )
.
.
.
.
Other
73.7
( 64.3 - 83.2 )
.
.
.
.
*Non-Hispanic. . = Less than 50 students in the subgroup. Version: HS21OCT2014
[email protected]
2013 HEALTHY KIDS COLORADO SURVEY RESULTS Region 4 High School Summary Tables - Weighted Data Table 119. Percentage of students who saw a doctor or nurse for a physical exam or check-up within the past 12 months Total
Age
Grade
Race/Ethnicity
Male
Female
Percentage
95% confidence interval
Percentage
95% confidence interval
Percentage
95% confidence interval
Total
76.0
( 72.4 - 79.6 )
76.4
( 72.3 - 80.6 )
75.7
( 70.9 - 80.5 )
15 or younger
78.3
( 72.9 - 83.8 )
75.3
( 70.1 - 80.5 )
81.5
( 74.9 - 88.2 )
16 or 17
76.1
( 71.5 - 80.8 )
79.3
( 74.5 - 84.1 )
73.0
( 65.9 - 80.2 )
18 or older
61.9
( 49.5 - 74.3 )
.
.
.
.
9th
79.3
( 72.6 - 86.0 )
73.6
( 63.9 - 83.2 )
85.0
( 79.7 - 90.4 )
10th
82.3
( 77.6 - 87.0 )
83.4
( 78.3 - 88.5 )
81.9
( 75.5 - 88.4 )
11th
76.5
( 72.1 - 80.9 )
77.3
( 71.3 - 83.3 )
76.3
( 68.6 - 83.9 )
12th
64.8
( 58.5 - 71.1 )
70.1
( 62.0 - 78.1 )
59.7
( 55.1 - 64.4 )
American Indian/Alaska Native*
.
.
.
.
.
.
Asian*
.
.
.
.
.
.
Black/African American*
.
.
.
.
.
.
Native Hawaiian/Other Pacific Islander*
.
.
.
.
.
.
White*
76.9
( 72.9 - 80.9 )
78.1
( 73.4 - 82.8 )
75.7
( 71.9 - 79.5 )
White Hispanic
77.9
( 70.5 - 85.2 )
.
.
.
.
Other
67.7
( 56.5 - 78.8 )
.
.
.
.
*Non-Hispanic. . = Less than 50 students in the subgroup. Version: HS21OCT2014
[email protected]
2013 HEALTHY KIDS COLORADO SURVEY RESULTS Region 4 High School Summary Tables - Weighted Data Table 120. Percentage of students whose doctor or nurse discussed how to maintain a healthy weight at their last check-up Total
Age
Grade
Race/Ethnicity
Male
Female
Percentage
95% confidence interval
Percentage
95% confidence interval
Percentage
95% confidence interval
Total
34.2
( 29.8 - 38.6 )
31.0
( 25.2 - 36.7 )
37.3
( 31.8 - 42.7 )
15 or younger
37.3
( 32.9 - 41.8 )
31.4
( 23.3 - 39.5 )
42.9
( 38.1 - 47.8 )
16 or 17
33.3
( 28.1 - 38.4 )
33.2
( 28.0 - 38.3 )
33.2
( 24.3 - 42.1 )
18 or older
21.9
( 15.4 - 28.4 )
.
.
.
.
9th
35.8
( 25.5 - 46.1 )
35.0
( 21.2 - 48.8 )
36.5
( 27.5 - 45.5 )
10th
42.4
( 37.2 - 47.6 )
34.9
( 28.8 - 41.1 )
50.7
( 41.1 - 60.2 )
11th
27.0
( 18.8 - 35.3 )
24.9
( 14.1 - 35.6 )
29.4
( 13.3 - 45.4 )
12th
30.7
( 25.0 - 36.3 )
28.3
( 20.1 - 36.5 )
32.8
( 26.6 - 38.9 )
American Indian/Alaska Native*
.
.
.
.
.
.
Asian*
.
.
.
.
.
.
Black/African American*
.
.
.
.
.
.
Native Hawaiian/Other Pacific Islander*
.
.
.
.
.
.
White*
31.8
( 28.0 - 35.7 )
29.9
( 22.6 - 37.3 )
33.8
( 32.1 - 35.4 )
White Hispanic
40.2
( 29.7 - 50.8 )
.
.
.
.
Other
33.9
( 18.5 - 49.4 )
.
.
.
.
*Non-Hispanic. . = Less than 50 students in the subgroup. Version: HS21OCT2014
[email protected]
2013 HEALTHY KIDS COLORADO SURVEY RESULTS Region 4 High School Summary Tables - Weighted Data Table 121. Percentage of students whose doctor or nurse discussed ways to deal with feelings of sadness or hopelessness at their last check-up Total
Age
Grade
Race/Ethnicity
Male
Female
Percentage
95% confidence interval
Percentage
95% confidence interval
Percentage
95% confidence interval
Total
16.4
( 11.9 - 20.8 )
11.8
( 9.4 - 14.2 )
20.6
( 14.2 - 27.1 )
15 or younger
15.1
( 8.6 - 21.5 )
8.3
( 4.3 - 12.2 )
21.3
( 12.0 - 30.6 )
16 or 17
17.3
( 13.5 - 21.0 )
13.6
( 11.5 - 15.7 )
21.0
( 14.7 - 27.4 )
18 or older
15.9
( 10.4 - 21.4 )
.
.
.
.
9th
12.6
( 7.9 - 17.4 )
5.7
( 1.9 - 9.5 )
19.0
( 11.7 - 26.3 )
10th
21.1
( 14.8 - 27.5 )
17.8
( 13.9 - 21.7 )
25.2
( 12.4 - 38.1 )
11th
14.2
( 9.8 - 18.6 )
7.6
( 4.3 - 11.0 )
20.7
( 12.0 - 29.4 )
12th
16.6
( 11.0 - 22.2 )
15.2
( 9.5 - 21.0 )
17.8
( 10.3 - 25.3 )
American Indian/Alaska Native*
.
.
.
.
.
.
Asian*
.
.
.
.
.
.
Black/African American*
.
.
.
.
.
.
Native Hawaiian/Other Pacific Islander*
.
.
.
.
.
.
White*
13.9
( 12.0 - 15.9 )
10.0
( 8.2 - 11.8 )
18.1
( 14.4 - 21.8 )
White Hispanic
18.9
( 6.0 - 31.8 )
.
.
.
.
Other
24.1
( 9.2 - 38.9 )
.
.
.
.
*Non-Hispanic. . = Less than 50 students in the subgroup. Version: HS21OCT2014
[email protected]
2013 HEALTHY KIDS COLORADO SURVEY RESULTS Region 4 High School Summary Tables - Weighted Data Table 122. Percentage of students who ate fruit 1+ times per day in the past seven days Total
Age
Grade
Race/Ethnicity
Male
Female
Percentage
95% confidence interval
Percentage
95% confidence interval
Percentage
95% confidence interval
Total
48.3
( 44.0 - 52.6 )
47.6
( 42.0 - 53.2 )
48.9
( 45.3 - 52.4 )
15 or younger
48.5
( 41.8 - 55.3 )
48.1
( 38.5 - 57.8 )
48.7
( 43.2 - 54.3 )
16 or 17
50.4
( 47.8 - 53.0 )
51.4
( 48.6 - 54.2 )
49.4
( 45.3 - 53.5 )
18 or older
34.6
( 27.0 - 42.2 )
26.9
( 19.2 - 34.5 )
46.0
( 28.3 - 63.7 )
9th
51.2
( 46.3 - 56.2 )
52.1
( 44.7 - 59.5 )
50.4
( 46.2 - 54.5 )
10th
46.2
( 36.7 - 55.6 )
45.7
( 32.1 - 59.3 )
46.3
( 36.8 - 55.7 )
11th
50.1
( 45.8 - 54.5 )
46.9
( 40.9 - 52.8 )
53.6
( 45.9 - 61.4 )
12th
46.0
( 41.9 - 50.0 )
46.3
( 38.2 - 54.4 )
45.6
( 38.3 - 52.9 )
.
.
.
.
.
.
Asian*
59.6
( 46.3 - 72.9 )
.
.
.
.
Black/African American*
37.1
( 19.5 - 54.8 )
.
.
.
.
.
.
.
.
.
.
White*
50.0
( 46.0 - 53.9 )
46.8
( 42.1 - 51.5 )
53.3
( 48.2 - 58.5 )
White Hispanic
45.6
( 38.3 - 52.8 )
50.3
( 40.0 - 60.5 )
41.2
( 32.9 - 49.6 )
Other
48.2
( 44.8 - 51.6 )
53.6
( 48.7 - 58.5 )
43.2
( 38.6 - 47.8 )
American Indian/Alaska Native*
Native Hawaiian/Other Pacific Islander*
*Non-Hispanic. . = Less than 50 students in the subgroup. Version: HS21OCT2014
[email protected]
2013 HEALTHY KIDS COLORADO SURVEY RESULTS Region 4 High School Summary Tables - Weighted Data Table 123. Percentage of students who ate fruit 2+ times per day in the past seven days Total
Age
Grade
Race/Ethnicity
Male
Female
Percentage
95% confidence interval
Percentage
95% confidence interval
Percentage
95% confidence interval
Total
34.4
( 31.1 - 37.7 )
33.8
( 28.8 - 38.7 )
34.9
( 31.9 - 37.8 )
15 or younger
34.7
( 30.1 - 39.3 )
34.2
( 28.7 - 39.6 )
35.2
( 30.5 - 39.9 )
16 or 17
36.3
( 33.0 - 39.5 )
36.7
( 31.5 - 42.0 )
35.8
( 32.5 - 39.0 )
18 or older
21.1
( 15.5 - 26.7 )
17.7
( 11.6 - 23.8 )
26.1
( 17.5 - 34.8 )
9th
39.1
( 36.3 - 42.0 )
39.7
( 35.4 - 44.0 )
38.6
( 35.5 - 41.7 )
10th
31.0
( 23.5 - 38.4 )
29.8
( 20.2 - 39.4 )
31.6
( 21.4 - 41.9 )
11th
36.5
( 31.4 - 41.7 )
34.6
( 27.4 - 41.8 )
38.6
( 31.2 - 46.1 )
12th
31.3
( 26.7 - 35.9 )
31.9
( 26.0 - 37.8 )
30.7
( 22.5 - 39.0 )
.
.
.
.
.
.
Asian*
49.2
( 30.9 - 67.5 )
.
.
.
.
Black/African American*
29.1
( 13.9 - 44.3 )
.
.
.
.
.
.
.
.
.
.
White*
34.7
( 31.6 - 37.8 )
33.2
( 28.4 - 38.0 )
36.3
( 31.6 - 41.1 )
White Hispanic
34.3
( 27.2 - 41.4 )
33.2
( 26.2 - 40.2 )
35.3
( 27.8 - 42.8 )
Other
33.4
( 28.0 - 38.8 )
36.2
( 28.7 - 43.7 )
30.8
( 24.5 - 37.1 )
American Indian/Alaska Native*
Native Hawaiian/Other Pacific Islander*
*Non-Hispanic. . = Less than 50 students in the subgroup. Version: HS21OCT2014
[email protected]
2013 HEALTHY KIDS COLORADO SURVEY RESULTS Region 4 High School Summary Tables - Weighted Data Table 124. Percentage of students who ate vegetables 1+ times per day in the past seven days Total
Age
Grade
Race/Ethnicity
Male
Female
Percentage
95% confidence interval
Percentage
95% confidence interval
Percentage
95% confidence interval
Total
48.8
( 46.6 - 51.1 )
46.4
( 41.9 - 51.0 )
51.2
( 49.0 - 53.4 )
15 or younger
48.2
( 43.6 - 52.9 )
43.9
( 34.5 - 53.2 )
52.4
( 45.3 - 59.4 )
16 or 17
51.8
( 48.3 - 55.2 )
51.6
( 48.2 - 55.0 )
51.9
( 45.8 - 58.0 )
18 or older
35.3
( 30.8 - 39.8 )
33.4
( 27.2 - 39.5 )
38.1
( 23.5 - 52.7 )
9th
50.3
( 45.7 - 54.8 )
48.2
( 36.7 - 59.8 )
52.3
( 45.1 - 59.5 )
10th
45.2
( 40.1 - 50.4 )
39.5
( 31.6 - 47.5 )
51.0
( 41.4 - 60.5 )
11th
53.3
( 48.0 - 58.5 )
51.7
( 46.2 - 57.2 )
55.0
( 46.5 - 63.5 )
12th
47.1
( 44.6 - 49.6 )
47.2
( 41.9 - 52.5 )
47.0
( 40.9 - 53.2 )
.
.
.
.
.
.
Asian*
63.6
( 51.8 - 75.4 )
.
.
.
.
Black/African American*
37.6
( 30.7 - 44.5 )
.
.
.
.
.
.
.
.
.
.
White*
51.9
( 49.6 - 54.1 )
48.5
( 45.0 - 51.9 )
55.6
( 52.1 - 59.2 )
White Hispanic
40.2
( 35.3 - 45.1 )
41.4
( 32.5 - 50.3 )
39.1
( 29.8 - 48.4 )
Other
48.1
( 42.5 - 53.7 )
44.4
( 36.5 - 52.3 )
52.2
( 46.7 - 57.7 )
American Indian/Alaska Native*
Native Hawaiian/Other Pacific Islander*
*Non-Hispanic. . = Less than 50 students in the subgroup. Version: HS21OCT2014
[email protected]
2013 HEALTHY KIDS COLORADO SURVEY RESULTS Region 4 High School Summary Tables - Weighted Data Table 125. Percentage of students who ate vegetables 2+ times per day in the past seven days Total
Age
Grade
Race/Ethnicity
Male
Female
Percentage
95% confidence interval
Percentage
95% confidence interval
Percentage
95% confidence interval
Total
31.2
( 28.9 - 33.4 )
29.4
( 25.9 - 32.9 )
33.0
( 31.4 - 34.6 )
15 or younger
31.3
( 27.9 - 34.8 )
28.7
( 22.3 - 35.0 )
34.2
( 31.4 - 36.9 )
16 or 17
32.1
( 29.1 - 35.2 )
31.6
( 27.4 - 35.9 )
32.6
( 29.1 - 36.2 )
18 or older
24.5
( 17.3 - 31.8 )
22.3
( 12.7 - 32.0 )
27.8
( 14.6 - 40.9 )
9th
33.4
( 29.1 - 37.7 )
31.8
( 21.6 - 42.1 )
34.9
( 31.7 - 38.1 )
10th
25.7
( 21.2 - 30.2 )
21.0
( 13.4 - 28.7 )
30.6
( 24.4 - 36.7 )
11th
34.3
( 29.2 - 39.4 )
33.5
( 26.4 - 40.6 )
35.3
( 30.6 - 40.0 )
12th
31.6
( 29.4 - 33.8 )
31.9
( 26.5 - 37.3 )
31.4
( 27.1 - 35.6 )
.
.
.
.
.
.
Asian*
45.9
( 31.5 - 60.2 )
.
.
.
.
Black/African American*
27.6
( 18.7 - 36.5 )
.
.
.
.
.
.
.
.
.
.
White*
31.6
( 27.9 - 35.3 )
30.0
( 25.2 - 34.8 )
33.2
( 29.7 - 36.7 )
White Hispanic
29.7
( 22.6 - 36.7 )
26.3
( 18.6 - 34.0 )
32.8
( 22.4 - 43.1 )
Other
30.3
( 24.9 - 35.7 )
28.2
( 20.2 - 36.3 )
32.7
( 25.2 - 40.1 )
American Indian/Alaska Native*
Native Hawaiian/Other Pacific Islander*
*Non-Hispanic. . = Less than 50 students in the subgroup. Version: HS21OCT2014
[email protected]
2013 HEALTHY KIDS COLORADO SURVEY RESULTS Region 4 High School Summary Tables - Weighted Data Table 126. Percentage of students who drank a can, bottle, or glass of soda or pop one or more times per day during the past seven days Total
Age
Grade
Race/Ethnicity
Male
Female
Percentage
95% confidence interval
Percentage
95% confidence interval
Percentage
95% confidence interval
Total
13.0
( 9.8 - 16.2 )
17.5
( 12.9 - 22.1 )
8.4
( 5.7 - 11.2 )
15 or younger
12.6
( 6.7 - 18.4 )
17.1
( 9.6 - 24.6 )
8.1
( 3.1 - 13.2 )
16 or 17
12.2
( 8.8 - 15.7 )
16.5
( 10.4 - 22.7 )
7.9
( 6.1 - 9.8 )
18 or older
19.6
( 11.9 - 27.3 )
23.2
( 12.0 - 34.4 )
14.3
( 5.6 - 22.9 )
9th
11.3
( 6.5 - 16.1 )
15.6
( 9.7 - 21.5 )
7.1
( 3.4 - 10.7 )
10th
13.0
( 6.8 - 19.3 )
18.1
( 8.6 - 27.6 )
7.7
( 1.9 - 13.4 )
11th
13.1
( 10.3 - 15.9 )
17.6
( 12.8 - 22.4 )
8.5
( 5.4 - 11.6 )
12th
14.6
( 11.1 - 18.1 )
18.8
( 13.4 - 24.2 )
10.4
( 6.8 - 14.1 )
.
.
.
.
.
.
Asian*
6.5
( 1.5 - 11.4 )
.
.
.
.
Black/African American*
16.7
( 4.8 - 28.6 )
.
.
.
.
.
.
.
.
.
.
White*
12.5
( 9.5 - 15.4 )
17.5
( 13.0 - 21.9 )
7.2
( 4.4 - 10.0 )
White Hispanic
12.9
( 5.8 - 20.0 )
15.5
( 5.7 - 25.4 )
10.5
( 0.3 - 20.7 )
Other
19.7
( 13.3 - 26.2 )
23.6
( 18.3 - 28.9 )
15.4
( 6.1 - 24.6 )
American Indian/Alaska Native*
Native Hawaiian/Other Pacific Islander*
*Non-Hispanic. . = Less than 50 students in the subgroup. Version: HS21OCT2014
[email protected]
2013 HEALTHY KIDS COLORADO SURVEY RESULTS Region 4 High School Summary Tables - Weighted Data Table 127. Percentage of students who ate breakfast on all of the past seven days Total
Age
Grade
Race/Ethnicity
Male
Female
Percentage
95% confidence interval
Percentage
95% confidence interval
Percentage
95% confidence interval
Total
48.0
( 41.7 - 54.4 )
52.9
( 47.7 - 58.2 )
43.1
( 35.7 - 50.5 )
15 or younger
50.6
( 43.9 - 57.3 )
56.8
( 46.5 - 67.0 )
44.6
( 39.6 - 49.6 )
16 or 17
48.5
( 40.5 - 56.4 )
54.1
( 48.2 - 60.0 )
42.9
( 33.2 - 52.6 )
18 or older
31.8
( 19.3 - 44.3 )
30.0
( 11.3 - 48.6 )
34.6
( 25.3 - 43.8 )
9th
49.8
( 41.9 - 57.6 )
55.3
( 44.2 - 66.4 )
44.2
( 36.3 - 52.2 )
10th
49.8
( 39.8 - 59.8 )
56.4
( 45.8 - 67.0 )
42.5
( 33.0 - 51.9 )
11th
52.8
( 45.3 - 60.2 )
56.4
( 51.8 - 60.9 )
49.2
( 37.5 - 60.9 )
12th
39.4
( 31.9 - 46.8 )
41.8
( 32.2 - 51.4 )
37.0
( 28.2 - 45.7 )
.
.
.
.
.
.
Asian*
58.6
( 43.2 - 74.1 )
.
.
.
.
Black/African American*
36.8
( 25.5 - 48.2 )
.
.
.
.
.
.
.
.
.
.
White*
50.7
( 44.1 - 57.2 )
55.4
( 50.0 - 60.9 )
45.7
( 38.7 - 52.7 )
White Hispanic
42.5
( 33.4 - 51.6 )
47.7
( 38.4 - 57.1 )
37.6
( 25.7 - 49.5 )
Other
45.3
( 38.6 - 52.1 )
51.3
( 39.1 - 63.5 )
39.7
( 32.2 - 47.2 )
American Indian/Alaska Native*
Native Hawaiian/Other Pacific Islander*
*Non-Hispanic. . = Less than 50 students in the subgroup. Version: HS21OCT2014
[email protected]
2013 HEALTHY KIDS COLORADO SURVEY RESULTS Region 4 High School Summary Tables - Weighted Data Table 128. Percentage of students who usually got breakfast at school Total
Age
Grade
Race/Ethnicity
Male
Female
Percentage
95% confidence interval
Percentage
95% confidence interval
Percentage
95% confidence interval
Total
3.2
( 0.7 - 5.6 )
3.8
( 0.2 - 7.3 )
2.6
( 0.5 - 4.6 )
15 or younger
3.6
( 0.4 - 6.8 )
4.1
( 0.6 - 7.5 )
3.2
( 0.0 - 6.9 )
16 or 17
2.5
( 0.3 - 4.7 )
3.8
( 0.0 - 8.2 )
1.2
( 0.0 - 2.7 )
18 or older
4.8
( 0.0 - 10.5 )
.
.
.
.
9th
4.4
( 0.4 - 8.4 )
4.5
( 0.0 - 9.0 )
4.3
( 0.0 - 10.7 )
10th
3.0
( 0.8 - 5.1 )
4.2
( 0.0 - 9.0 )
1.7
( 0.0 - 4.8 )
11th
2.7
( 0.0 - 5.4 )
4.7
( 0.0 - 9.8 )
0.6
( 0.0 - 1.8 )
12th
2.6
( 0.4 - 4.7 )
1.7
( 0.0 - 3.7 )
3.4
( 0.0 - 7.3 )
American Indian/Alaska Native*
.
.
.
.
.
.
Asian*
.
.
.
.
.
.
Black/African American*
.
.
.
.
.
.
Native Hawaiian/Other Pacific Islander*
.
.
.
.
.
.
White*
1.7
( 0.5 - 2.9 )
2.3
( 0.1 - 4.5 )
1.0
( 0.1 - 2.0 )
White Hispanic
3.9
( 0.0 - 8.8 )
.
.
.
.
Other
8.0
( 0.1 - 16.0 )
.
.
.
.
*Non-Hispanic. . = Less than 50 students in the subgroup. Version: HS21OCT2014
[email protected]
2013 HEALTHY KIDS COLORADO SURVEY RESULTS Region 4 High School Summary Tables - Weighted Data Table 129. Percentage of students who ate lunch on all of the past seven days Total
Age
Grade
Race/Ethnicity
Male
Female
Percentage
95% confidence interval
Percentage
95% confidence interval
Percentage
95% confidence interval
Total
66.3
( 58.6 - 74.0 )
73.8
( 65.1 - 82.5 )
58.8
( 52.2 - 65.3 )
15 or younger
67.2
( 55.9 - 78.5 )
77.5
( 64.3 - 90.8 )
57.6
( 47.8 - 67.5 )
16 or 17
68.0
( 60.9 - 75.0 )
75.3
( 69.0 - 81.7 )
60.2
( 52.6 - 67.9 )
18 or older
52.9
( 38.9 - 67.0 )
.
.
.
.
9th
71.3
( 64.3 - 78.3 )
82.2
( 70.7 - 93.6 )
60.8
( 53.9 - 67.8 )
10th
66.2
( 47.1 - 85.2 )
74.4
( 54.2 - 94.6 )
56.4
( 38.8 - 73.9 )
11th
68.2
( 62.0 - 74.4 )
73.7
( 68.8 - 78.5 )
62.6
( 52.7 - 72.6 )
12th
60.2
( 48.8 - 71.5 )
65.6
( 58.9 - 72.3 )
55.0
( 38.3 - 71.6 )
American Indian/Alaska Native*
.
.
.
.
.
.
Asian*
.
.
.
.
.
.
Black/African American*
.
.
.
.
.
.
Native Hawaiian/Other Pacific Islander*
.
.
.
.
.
.
White*
70.1
( 62.1 - 78.2 )
76.2
( 71.0 - 81.5 )
63.4
( 52.8 - 74.1 )
White Hispanic
60.3
( 45.0 - 75.6 )
.
.
.
.
Other
58.2
( 45.3 - 71.1 )
.
.
.
.
*Non-Hispanic. . = Less than 50 students in the subgroup. Version: HS21OCT2014
[email protected]
2013 HEALTHY KIDS COLORADO SURVEY RESULTS Region 4 High School Summary Tables - Weighted Data Table 130. Percentage of students who usually got lunch at school Total
Age
Grade
Race/Ethnicity
Male
Female
Percentage
95% confidence interval
Percentage
95% confidence interval
Percentage
95% confidence interval
Total
22.8
( 15.0 - 30.6 )
26.2
( 17.1 - 35.3 )
19.1
( 11.7 - 26.4 )
15 or younger
33.3
( 22.8 - 43.8 )
38.1
( 25.6 - 50.5 )
28.3
( 18.9 - 37.6 )
16 or 17
14.7
( 9.6 - 19.8 )
16.8
( 11.0 - 22.7 )
12.2
( 6.1 - 18.2 )
18 or older
14.4
( 7.4 - 21.4 )
.
.
.
.
9th
31.0
( 19.5 - 42.4 )
37.8
( 24.2 - 51.4 )
24.3
( 13.2 - 35.4 )
10th
35.8
( 26.5 - 45.2 )
35.5
( 19.4 - 51.5 )
35.0
( 27.8 - 42.2 )
11th
14.0
( 8.4 - 19.6 )
20.8
( 13.2 - 28.5 )
7.1
( 0.7 - 13.6 )
12th
9.3
( 5.4 - 13.2 )
9.0
( 5.1 - 12.8 )
9.7
( 3.8 - 15.5 )
American Indian/Alaska Native*
.
.
.
.
.
.
Asian*
.
.
.
.
.
.
Black/African American*
.
.
.
.
.
.
Native Hawaiian/Other Pacific Islander*
.
.
.
.
.
.
White*
19.6
( 12.8 - 26.4 )
23.4
( 13.8 - 33.1 )
15.4
( 10.5 - 20.2 )
White Hispanic
27.3
( 19.6 - 35.1 )
.
.
.
.
Other
31.2
( 10.4 - 51.9 )
.
.
.
.
*Non-Hispanic. . = Less than 50 students in the subgroup. Version: HS21OCT2014
[email protected]
2013 HEALTHY KIDS COLORADO SURVEY RESULTS Region 4 High School Summary Tables - Weighted Data Table 131. Percentage of students who drank a can, bottle, or glass of diet soda or pop one or more times per day during the past seven days Total
Age
Grade
Race/Ethnicity
Male
Female
Percentage
95% confidence interval
Percentage
95% confidence interval
Percentage
95% confidence interval
Total
4.3
( 2.5 - 6.1 )
6.3
( 3.0 - 9.5 )
2.3
( 1.2 - 3.4 )
15 or younger
3.5
( 0.6 - 6.4 )
5.6
( 1.0 - 10.2 )
1.6
( 0.0 - 3.3 )
16 or 17
4.3
( 1.7 - 6.9 )
5.7
( 1.7 - 9.7 )
2.9
( 0.6 - 5.2 )
18 or older
8.5
( 2.6 - 14.5 )
.
.
.
.
9th
3.8
( 0.0 - 7.9 )
7.2
( 0.0 - 15.7 )
0.5
( 0.0 - 1.4 )
10th
4.2
( 0.1 - 8.2 )
6.5
( 0.2 - 12.7 )
1.7
( 0.0 - 3.7 )
11th
5.5
( 2.1 - 8.8 )
7.8
( 0.4 - 15.2 )
3.2
( 0.0 - 7.8 )
12th
3.7
( 1.7 - 5.7 )
3.2
( 0.4 - 6.1 )
4.1
( 0.0 - 8.6 )
American Indian/Alaska Native*
.
.
.
.
.
.
Asian*
.
.
.
.
.
.
Black/African American*
.
.
.
.
.
.
Native Hawaiian/Other Pacific Islander*
.
.
.
.
.
.
White*
3.2
( 2.0 - 4.4 )
4.3
( 2.4 - 6.2 )
2.0
( 0.9 - 3.2 )
White Hispanic
4.6
( 0.5 - 8.7 )
.
.
.
.
Other
8.5
( 3.7 - 13.2 )
.
.
.
.
*Non-Hispanic. . = Less than 50 students in the subgroup. Version: HS21OCT2014
[email protected]
2013 HEALTHY KIDS COLORADO SURVEY RESULTS Region 4 High School Summary Tables - Weighted Data Table 132. Percentage of students who drank a can, bottle, or glass of a sports drink one or more times per day during the past seven days Total
Age
Grade
Race/Ethnicity
Male
Female
Percentage
95% confidence interval
Percentage
95% confidence interval
Percentage
95% confidence interval
Total
10.7
( 6.3 - 15.1 )
16.7
( 9.3 - 24.1 )
4.7
( 2.4 - 7.0 )
15 or younger
10.0
( 5.8 - 14.1 )
18.1
( 11.1 - 25.1 )
2.5
( 0.3 - 4.7 )
16 or 17
10.1
( 5.6 - 14.6 )
14.4
( 6.9 - 21.9 )
5.7
( 2.4 - 9.1 )
18 or older
18.0
( 7.9 - 28.2 )
.
.
.
.
9th
13.5
( 7.4 - 19.5 )
23.5
( 13.7 - 33.3 )
3.6
( 1.2 - 6.0 )
10th
7.1
( 1.9 - 12.2 )
12.4
( 2.9 - 22.0 )
1.4
( 0.0 - 2.8 )
11th
11.1
( 6.5 - 15.7 )
18.8
( 10.8 - 26.9 )
3.5
( 0.0 - 7.1 )
12th
11.4
( 5.2 - 17.7 )
12.5
( 3.5 - 21.6 )
10.4
( 3.3 - 17.4 )
American Indian/Alaska Native*
.
.
.
.
.
.
Asian*
.
.
.
.
.
.
Black/African American*
.
.
.
.
.
.
Native Hawaiian/Other Pacific Islander*
.
.
.
.
.
.
White*
9.6
( 6.8 - 12.4 )
15.2
( 9.3 - 21.1 )
3.7
( 1.0 - 6.3 )
White Hispanic
12.4
( 0.3 - 24.5 )
.
.
.
.
Other
13.1
( 4.9 - 21.4 )
.
.
.
.
*Non-Hispanic. . = Less than 50 students in the subgroup. Version: HS21OCT2014
[email protected]
2013 HEALTHY KIDS COLORADO SURVEY RESULTS Region 4 High School Summary Tables - Weighted Data Table 133. Percentage of students who drank a can, bottle, or glass of an energy drink one or more times per day during the past seven days Total
Age
Grade
Race/Ethnicity
Male
Female
Percentage
95% confidence interval
Percentage
95% confidence interval
Percentage
95% confidence interval
Total
2.8
( 1.1 - 4.5 )
4.7
( 1.0 - 8.5 )
0.9
( 0.1 - 1.7 )
15 or younger
1.2
( 0.0 - 2.6 )
1.8
( 0.0 - 4.1 )
0.7
( 0.0 - 1.4 )
16 or 17
2.8
( 0.9 - 4.6 )
4.5
( 0.4 - 8.7 )
1.0
( 0.0 - 2.8 )
18 or older
11.4
( 0.0 - 23.1 )
.
.
.
.
9th
2.8
( 0.0 - 6.5 )
4.0
( 0.0 - 10.4 )
1.6
( 0.0 - 3.4 )
10th
0.7
( 0.0 - 2.0 )
1.4
( 0.0 - 4.0 )
0.0
( 0.0 - 0.0 )
11th
4.4
( 1.0 - 7.9 )
7.0
( 0.0 - 14.4 )
2.0
( 0.0 - 5.5 )
12th
3.3
( 0.6 - 6.0 )
6.6
( 1.0 - 12.2 )
0.0
( 0.0 - 0.0 )
American Indian/Alaska Native*
.
.
.
.
.
.
Asian*
.
.
.
.
.
.
Black/African American*
.
.
.
.
.
.
Native Hawaiian/Other Pacific Islander*
.
.
.
.
.
.
White*
1.3
( 0.1 - 2.5 )
2.4
( 0.2 - 4.5 )
0.2
( 0.0 - 0.6 )
White Hispanic
4.5
( 0.0 - 9.2 )
.
.
.
.
Other
6.2
( 2.1 - 10.2 )
.
.
.
.
*Non-Hispanic. . = Less than 50 students in the subgroup. Version: HS21OCT2014
[email protected]
2013 HEALTHY KIDS COLORADO SURVEY RESULTS Region 4 High School Summary Tables - Weighted Data Table 134. Percentage of students who drank a can, bottle, or glass of some other sugar-sweetened beverage one or more times per day during the past seven days Total
Age
Grade
Race/Ethnicity
Male
Female
Percentage
95% confidence interval
Percentage
95% confidence interval
Percentage
95% confidence interval
Total
15.9
( 10.9 - 20.9 )
16.8
( 11.2 - 22.4 )
15.1
( 10.5 - 19.6 )
15 or younger
15.2
( 10.0 - 20.4 )
18.1
( 12.4 - 23.9 )
12.3
( 5.5 - 19.0 )
16 or 17
14.5
( 9.8 - 19.3 )
12.9
( 8.8 - 17.0 )
16.3
( 8.4 - 24.2 )
18 or older
28.2
( 7.8 - 48.7 )
.
.
.
.
9th
14.0
( 7.4 - 20.6 )
13.5
( 3.5 - 23.4 )
14.5
( 3.8 - 25.2 )
10th
15.2
( 7.1 - 23.3 )
20.2
( 7.4 - 33.0 )
10.1
( 1.9 - 18.4 )
11th
16.7
( 11.5 - 21.9 )
16.2
( 11.3 - 21.0 )
17.3
( 8.2 - 26.4 )
12th
17.9
( 11.9 - 23.9 )
17.2
( 8.8 - 25.7 )
18.5
( 15.0 - 22.1 )
American Indian/Alaska Native*
.
.
.
.
.
.
Asian*
.
.
.
.
.
.
Black/African American*
.
.
.
.
.
.
Native Hawaiian/Other Pacific Islander*
.
.
.
.
.
.
White*
13.8
( 11.0 - 16.5 )
12.7
( 10.4 - 15.1 )
15.0
( 10.3 - 19.7 )
White Hispanic
23.4
( 11.1 - 35.7 )
.
.
.
.
Other
12.0
( 4.9 - 19.0 )
.
.
.
.
*Non-Hispanic. . = Less than 50 students in the subgroup. Version: HS21OCT2014
[email protected]
2013 HEALTHY KIDS COLORADO SURVEY RESULTS Region 4 High School Summary Tables - Weighted Data Table 135. Percentage of students who drank a bottle or glass of plain water one or more times per day during the past seven days Total
Age
Grade
Race/Ethnicity
Male
Female
Percentage
95% confidence interval
Percentage
95% confidence interval
Percentage
95% confidence interval
Total
81.1
( 78.1 - 84.2 )
82.9
( 79.3 - 86.4 )
79.2
( 75.8 - 82.5 )
15 or younger
80.8
( 76.7 - 84.9 )
80.9
( 75.1 - 86.7 )
80.5
( 75.4 - 85.6 )
16 or 17
82.5
( 78.8 - 86.3 )
85.4
( 81.9 - 88.8 )
79.5
( 75.0 - 84.1 )
18 or older
74.4
( 67.1 - 81.7 )
.
.
.
.
9th
83.2
( 79.9 - 86.4 )
80.1
( 75.4 - 84.7 )
86.2
( 81.8 - 90.5 )
10th
79.0
( 72.2 - 85.9 )
81.5
( 76.5 - 86.4 )
76.0
( 66.3 - 85.8 )
11th
81.1
( 72.3 - 89.9 )
82.7
( 73.0 - 92.4 )
79.3
( 70.4 - 88.2 )
12th
81.4
( 76.9 - 85.9 )
87.5
( 82.9 - 92.1 )
75.4
( 69.8 - 81.0 )
American Indian/Alaska Native*
.
.
.
.
.
.
Asian*
.
.
.
.
.
.
Black/African American*
.
.
.
.
.
.
Native Hawaiian/Other Pacific Islander*
.
.
.
.
.
.
White*
83.2
( 80.9 - 85.5 )
82.9
( 80.0 - 85.9 )
83.3
( 81.1 - 85.6 )
White Hispanic
82.3
( 71.6 - 92.9 )
.
.
.
.
Other
78.3
( 71.7 - 84.9 )
.
.
.
.
*Non-Hispanic. . = Less than 50 students in the subgroup. Version: HS21OCT2014
[email protected]
2013 HEALTHY KIDS COLORADO SURVEY RESULTS Region 4 High School Summary Tables - Weighted Data Table 136. Percentage of students who went hungry sometimes, most of the time, or always because of lack of food at home Total
Age
Grade
Race/Ethnicity
Male
Female
Percentage
95% confidence interval
Percentage
95% confidence interval
Percentage
95% confidence interval
Total
10.6
( 7.0 - 14.2 )
10.8
( 4.7 - 16.9 )
10.3
( 6.8 - 13.8 )
15 or younger
11.3
( 6.4 - 16.2 )
10.1
( 3.4 - 16.8 )
11.9
( 4.0 - 19.8 )
16 or 17
9.3
( 6.2 - 12.5 )
11.1
( 4.9 - 17.3 )
7.6
( 3.8 - 11.3 )
18 or older
15.1
( 7.3 - 22.9 )
.
.
.
.
9th
14.4
( 6.5 - 22.2 )
13.8
( 5.3 - 22.3 )
14.9
( 0.9 - 28.9 )
10th
8.5
( 2.9 - 14.1 )
6.1
( 0.0 - 14.2 )
10.1
( 4.0 - 16.2 )
11th
9.1
( 5.2 - 12.9 )
11.9
( 5.6 - 18.1 )
6.4
( 1.2 - 11.6 )
12th
10.6
( 5.6 - 15.7 )
11.7
( 3.2 - 20.3 )
9.5
( 4.7 - 14.4 )
American Indian/Alaska Native*
.
.
.
.
.
.
Asian*
.
.
.
.
.
.
Black/African American*
.
.
.
.
.
.
Native Hawaiian/Other Pacific Islander*
.
.
.
.
.
.
White*
8.0
( 5.3 - 10.8 )
7.2
( 3.0 - 11.3 )
9.0
( 6.3 - 11.7 )
White Hispanic
12.2
( 6.6 - 17.9 )
.
.
.
.
Other
21.6
( 10.6 - 32.7 )
.
.
.
.
*Non-Hispanic. . = Less than 50 students in the subgroup. Version: HS21OCT2014
[email protected]
2013 HEALTHY KIDS COLORADO SURVEY RESULTS Region 4 High School Summary Tables - Weighted Data Table 137. Percentage of students who could walk or ride a bike, scooter, or skateboard to school Total
Age
Grade
Race/Ethnicity
Male
Female
Percentage
95% confidence interval
Percentage
95% confidence interval
Percentage
95% confidence interval
Total
40.9
( 28.9 - 52.9 )
45.2
( 33.3 - 57.2 )
35.9
( 21.5 - 50.3 )
15 or younger
40.5
( 28.0 - 53.0 )
46.9
( 35.7 - 58.1 )
34.1
( 19.0 - 49.3 )
16 or 17
40.4
( 27.4 - 53.4 )
43.1
( 28.7 - 57.6 )
37.6
( 23.5 - 51.6 )
18 or older
43.9
( 28.7 - 59.1 )
.
.
.
.
9th
39.0
( 28.9 - 49.1 )
43.9
( 28.6 - 59.1 )
34.3
( 24.1 - 44.5 )
10th
38.7
( 25.5 - 52.0 )
41.9
( 31.8 - 52.1 )
34.9
( 16.3 - 53.5 )
11th
36.2
( 22.5 - 49.8 )
42.4
( 19.5 - 65.2 )
29.6
( 19.2 - 40.0 )
12th
48.6
( 32.3 - 64.8 )
52.1
( 39.3 - 65.0 )
45.1
( 22.8 - 67.4 )
American Indian/Alaska Native*
.
.
.
.
.
.
Asian*
.
.
.
.
.
.
Black/African American*
.
.
.
.
.
.
Native Hawaiian/Other Pacific Islander*
.
.
.
.
.
.
White*
41.0
( 27.2 - 54.7 )
44.9
( 30.7 - 59.2 )
36.6
( 22.3 - 50.9 )
White Hispanic
40.5
( 27.3 - 53.7 )
.
.
.
.
Other
41.4
( 30.8 - 52.1 )
.
.
.
.
*Non-Hispanic. . = Less than 50 students in the subgroup. Version: HS21OCT2014
[email protected]
2013 HEALTHY KIDS COLORADO SURVEY RESULTS Region 4 High School Summary Tables - Weighted Data Table 138. Percentage of students who walk or ride to school 1 or more days in an average week Total
Age
Grade
Race/Ethnicity
Male
Female
Percentage
95% confidence interval
Percentage
95% confidence interval
Percentage
95% confidence interval
Total
12.7
( 7.8 - 17.6 )
15.8
( 9.1 - 22.5 )
8.9
( 4.2 - 13.6 )
15 or younger
16.9
( 9.1 - 24.7 )
21.6
( 12.9 - 30.3 )
11.8
( 3.7 - 19.9 )
16 or 17
10.3
( 3.9 - 16.7 )
13.7
( 3.8 - 23.5 )
6.6
( 3.1 - 10.1 )
18 or older
3.4
( 0.1 - 6.8 )
.
.
.
.
9th
15.9
( 9.9 - 21.8 )
19.1
( 12.9 - 25.3 )
12.7
( 6.0 - 19.4 )
10th
14.6
( 8.8 - 20.3 )
18.6
( 9.2 - 28.0 )
9.4
( 2.2 - 16.5 )
11th
9.9
( 3.2 - 16.7 )
18.4
( 5.9 - 31.0 )
0.9
( 0.0 - 2.1 )
12th
9.6
( 3.5 - 15.7 )
6.9
( 1.9 - 12.0 )
12.2
( 4.0 - 20.5 )
American Indian/Alaska Native*
.
.
.
.
.
.
Asian*
.
.
.
.
.
.
Black/African American*
.
.
.
.
.
.
Native Hawaiian/Other Pacific Islander*
.
.
.
.
.
.
White*
11.7
( 5.9 - 17.4 )
15.0
( 6.9 - 23.1 )
7.7
( 3.4 - 11.9 )
White Hispanic
14.7
( 8.5 - 20.9 )
.
.
.
.
Other
13.1
( 0.0 - 26.4 )
.
.
.
.
*Non-Hispanic. . = Less than 50 students in the subgroup. Version: HS21OCT2014
[email protected]
2013 HEALTHY KIDS COLORADO SURVEY RESULTS Region 4 High School Summary Tables - Weighted Data Table 139. Percentage of students who were physically active for a total of at least 60 minutes per day on five or more of the past seven days Total
Age
Grade
Race/Ethnicity
Male
Female
Percentage
95% confidence interval
Percentage
95% confidence interval
Percentage
95% confidence interval
Total
53.9
( 48.9 - 58.9 )
63.5
( 58.3 - 68.8 )
43.9
( 39.4 - 48.4 )
15 or younger
57.7
( 51.5 - 64.0 )
66.5
( 59.4 - 73.7 )
49.4
( 42.4 - 56.5 )
16 or 17
52.4
( 47.2 - 57.6 )
63.5
( 58.4 - 68.6 )
41.0
( 36.8 - 45.1 )
18 or older
41.1
( 34.6 - 47.6 )
50.7
( 41.3 - 60.2 )
26.1
( 17.9 - 34.3 )
9th
63.8
( 58.0 - 69.7 )
69.7
( 60.9 - 78.4 )
58.0
( 51.6 - 64.4 )
10th
51.3
( 42.9 - 59.6 )
61.9
( 56.4 - 67.4 )
40.0
( 28.7 - 51.2 )
11th
53.3
( 49.1 - 57.5 )
62.9
( 58.1 - 67.8 )
43.3
( 35.7 - 50.8 )
12th
47.0
( 41.1 - 52.9 )
59.5
( 50.2 - 68.8 )
34.6
( 30.4 - 38.8 )
.
.
.
.
.
.
Asian*
35.3
( 24.1 - 46.4 )
.
.
.
.
Black/African American*
42.9
( 33.3 - 52.4 )
.
.
.
.
.
.
.
.
.
.
White*
56.4
( 52.0 - 60.7 )
63.9
( 59.5 - 68.3 )
48.1
( 44.0 - 52.2 )
White Hispanic
53.6
( 40.8 - 66.3 )
68.2
( 56.1 - 80.4 )
40.1
( 23.9 - 56.2 )
Other
53.0
( 47.0 - 58.9 )
60.6
( 51.1 - 70.2 )
45.0
( 32.1 - 57.8 )
American Indian/Alaska Native*
Native Hawaiian/Other Pacific Islander*
*Non-Hispanic. . = Less than 50 students in the subgroup. Version: HS21OCT2014
[email protected]
2013 HEALTHY KIDS COLORADO SURVEY RESULTS Region 4 High School Summary Tables - Weighted Data Table 140. Percentage of students who were physically active for a total of at least 60 minutes per day on none of the past seven days Total
Age
Grade
Race/Ethnicity
Male
Female
Percentage
95% confidence interval
Percentage
95% confidence interval
Percentage
95% confidence interval
Total
12.4
( 9.8 - 15.0 )
10.1
( 7.4 - 12.9 )
14.8
( 11.4 - 18.3 )
15 or younger
9.8
( 7.9 - 11.7 )
7.4
( 5.4 - 9.4 )
12.2
( 9.3 - 15.1 )
16 or 17
12.3
( 9.3 - 15.3 )
9.9
( 5.3 - 14.6 )
14.8
( 11.6 - 17.9 )
18 or older
26.9
( 19.7 - 34.1 )
22.4
( 12.1 - 32.7 )
34.0
( 23.1 - 44.8 )
9th
8.8
( 5.8 - 11.8 )
5.2
( 3.0 - 7.3 )
12.4
( 7.2 - 17.7 )
10th
10.5
( 7.2 - 13.8 )
10.8
( 6.6 - 15.1 )
10.2
( 6.5 - 13.9 )
11th
11.8
( 9.1 - 14.4 )
9.7
( 4.7 - 14.7 )
13.9
( 10.0 - 17.8 )
12th
18.5
( 11.4 - 25.7 )
14.3
( 6.7 - 21.8 )
22.8
( 14.2 - 31.4 )
.
.
.
.
.
.
Asian*
22.2
( 13.7 - 30.6 )
.
.
.
.
Black/African American*
23.4
( 12.4 - 34.4 )
.
.
.
.
.
.
.
.
.
.
White*
10.0
( 8.0 - 12.1 )
8.5
( 6.7 - 10.3 )
11.7
( 8.9 - 14.5 )
White Hispanic
13.2
( 5.1 - 21.2 )
8.1
( 0.0 - 16.6 )
17.8
( 8.6 - 27.0 )
Other
17.7
( 14.6 - 20.7 )
15.0
( 7.1 - 22.9 )
20.5
( 13.1 - 27.9 )
American Indian/Alaska Native*
Native Hawaiian/Other Pacific Islander*
*Non-Hispanic. . = Less than 50 students in the subgroup. Version: HS21OCT2014
[email protected]
2013 HEALTHY KIDS COLORADO SURVEY RESULTS Region 4 High School Summary Tables - Weighted Data Table 141. Percentage of students who were physically active for a total of at least 60 minutes per day on all seven of the past seven days Total
Age
Grade
Race/Ethnicity
Male
Female
Percentage
95% confidence interval
Percentage
95% confidence interval
Percentage
95% confidence interval
Total
29.4
( 25.1 - 33.7 )
38.9
( 34.7 - 43.1 )
19.5
( 15.6 - 23.4 )
15 or younger
33.5
( 26.9 - 40.0 )
45.5
( 37.8 - 53.2 )
21.8
( 16.0 - 27.7 )
16 or 17
27.5
( 23.5 - 31.5 )
36.6
( 31.3 - 42.0 )
18.2
( 15.7 - 20.7 )
18 or older
17.2
( 10.4 - 23.9 )
20.4
( 9.4 - 31.5 )
12.1
( 7.5 - 16.7 )
9th
37.6
( 29.1 - 46.1 )
47.6
( 36.6 - 58.7 )
27.6
( 20.5 - 34.7 )
10th
28.2
( 23.9 - 32.6 )
38.2
( 34.8 - 41.7 )
17.7
( 12.4 - 22.9 )
11th
26.4
( 23.3 - 29.6 )
33.4
( 28.7 - 38.1 )
19.0
( 12.8 - 25.2 )
12th
24.7
( 19.8 - 29.6 )
35.8
( 29.5 - 42.1 )
13.6
( 9.1 - 18.1 )
.
.
.
.
.
.
Asian*
24.8
( 13.7 - 35.9 )
.
.
.
.
Black/African American*
19.3
( 10.7 - 27.9 )
.
.
.
.
.
.
.
.
.
.
White*
30.1
( 25.9 - 34.3 )
38.3
( 34.4 - 42.1 )
21.3
( 17.2 - 25.5 )
White Hispanic
30.4
( 23.3 - 37.6 )
42.9
( 34.9 - 51.0 )
19.0
( 8.8 - 29.1 )
Other
31.0
( 21.3 - 40.7 )
44.1
( 31.4 - 56.8 )
17.4
( 7.0 - 27.8 )
American Indian/Alaska Native*
Native Hawaiian/Other Pacific Islander*
*Non-Hispanic. . = Less than 50 students in the subgroup. Version: HS21OCT2014
[email protected]
2013 HEALTHY KIDS COLORADO SURVEY RESULTS Region 4 High School Summary Tables - Weighted Data Table 142. Percentage of students who watched three or more hours per day of TV on an average school day Total
Age
Grade
Race/Ethnicity
Male
Female
Percentage
95% confidence interval
Percentage
95% confidence interval
Percentage
95% confidence interval
Total
16.5
( 12.8 - 20.3 )
18.7
( 13.3 - 24.2 )
14.4
( 10.9 - 17.9 )
15 or younger
16.3
( 12.3 - 20.2 )
18.3
( 12.5 - 24.0 )
14.3
( 8.4 - 20.2 )
16 or 17
16.2
( 12.8 - 19.6 )
17.9
( 12.5 - 23.4 )
14.4
( 11.9 - 17.0 )
18 or older
20.8
( 10.0 - 31.6 )
24.7
( 14.1 - 35.4 )
14.6
( 2.8 - 26.5 )
9th
15.1
( 10.4 - 19.8 )
15.8
( 8.0 - 23.5 )
14.5
( 9.6 - 19.4 )
10th
18.4
( 13.2 - 23.6 )
22.2
( 17.0 - 27.4 )
14.5
( 5.1 - 23.9 )
11th
14.1
( 10.6 - 17.6 )
17.1
( 11.1 - 23.2 )
11.0
( 8.2 - 13.8 )
12th
17.9
( 12.1 - 23.7 )
18.5
( 10.0 - 27.0 )
17.3
( 13.1 - 21.4 )
.
.
.
.
.
.
Asian*
20.1
( 8.6 - 31.5 )
.
.
.
.
Black/African American*
25.5
( 18.4 - 32.6 )
.
.
.
.
.
.
.
.
.
.
White*
13.4
( 9.6 - 17.2 )
15.7
( 9.5 - 22.0 )
11.0
( 8.4 - 13.6 )
White Hispanic
22.1
( 16.3 - 28.0 )
25.0
( 14.3 - 35.6 )
19.5
( 8.0 - 31.0 )
Other
19.2
( 9.9 - 28.6 )
19.1
( 9.2 - 29.0 )
18.8
( 8.1 - 29.6 )
American Indian/Alaska Native*
Native Hawaiian/Other Pacific Islander*
*Non-Hispanic. . = Less than 50 students in the subgroup. Version: HS21OCT2014
[email protected]
2013 HEALTHY KIDS COLORADO SURVEY RESULTS Region 4 High School Summary Tables - Weighted Data Table 143. Percentage of students who played video or computer games or used a computer for something that was not school work three or more hours per day on an average school day Total
Age
Grade
Race/Ethnicity
Male
Female
Percentage
95% confidence interval
Percentage
95% confidence interval
Percentage
95% confidence interval
Total
29.1
( 24.2 - 34.0 )
29.2
( 23.7 - 34.8 )
29.0
( 23.2 - 34.9 )
15 or younger
28.9
( 23.7 - 34.1 )
27.9
( 23.3 - 32.6 )
30.0
( 21.0 - 38.9 )
16 or 17
27.1
( 20.8 - 33.4 )
27.5
( 20.1 - 34.9 )
26.7
( 20.6 - 32.8 )
18 or older
41.6
( 33.0 - 50.1 )
42.8
( 31.5 - 54.2 )
39.6
( 24.1 - 55.0 )
9th
24.5
( 19.2 - 29.9 )
24.8
( 19.3 - 30.3 )
24.2
( 18.2 - 30.2 )
10th
30.5
( 23.8 - 37.3 )
25.0
( 16.0 - 34.0 )
36.7
( 24.9 - 48.6 )
11th
25.2
( 19.5 - 30.8 )
29.0
( 23.7 - 34.2 )
21.0
( 14.6 - 27.5 )
12th
35.8
( 29.8 - 41.7 )
37.4
( 29.1 - 45.6 )
34.2
( 29.8 - 38.6 )
.
.
.
.
.
.
Asian*
32.0
( 14.8 - 49.1 )
.
.
.
.
Black/African American*
35.3
( 25.8 - 44.8 )
.
.
.
.
.
.
.
.
.
.
White*
26.1
( 21.8 - 30.3 )
27.7
( 22.6 - 32.8 )
24.3
( 19.4 - 29.2 )
White Hispanic
37.2
( 29.9 - 44.6 )
34.3
( 19.4 - 49.2 )
39.9
( 25.6 - 54.2 )
Other
29.4
( 22.0 - 36.8 )
30.6
( 19.1 - 42.0 )
27.7
( 20.7 - 34.8 )
American Indian/Alaska Native*
Native Hawaiian/Other Pacific Islander*
*Non-Hispanic. . = Less than 50 students in the subgroup. Version: HS21OCT2014
[email protected]
2013 HEALTHY KIDS COLORADO SURVEY RESULTS Region 4 High School Summary Tables - Weighted Data Table 144. Percentage of students who havd screen time for 3 or more hours per day on an average school day Total
Age
Grade
Race/Ethnicity
Male
Female
Percentage
95% confidence interval
Percentage
95% confidence interval
Percentage
95% confidence interval
Total
45.8
( 39.8 - 51.8 )
48.5
( 41.8 - 55.1 )
43.2
( 36.5 - 49.8 )
15 or younger
44.7
( 37.8 - 51.7 )
45.9
( 39.1 - 52.7 )
43.5
( 34.4 - 52.6 )
16 or 17
44.6
( 38.4 - 50.8 )
47.5
( 40.1 - 54.8 )
41.7
( 35.6 - 47.8 )
18 or older
59.2
( 49.7 - 68.6 )
64.2
( 53.5 - 74.8 )
51.5
( 39.8 - 63.3 )
9th
40.5
( 32.8 - 48.2 )
42.0
( 32.5 - 51.5 )
39.0
( 31.8 - 46.3 )
10th
48.2
( 39.5 - 56.9 )
48.0
( 40.3 - 55.7 )
48.7
( 35.9 - 61.6 )
11th
41.7
( 35.0 - 48.5 )
48.8
( 41.1 - 56.4 )
34.4
( 27.4 - 41.3 )
12th
52.7
( 46.7 - 58.8 )
54.8
( 47.3 - 62.3 )
50.7
( 45.4 - 56.0 )
.
.
.
.
.
.
Asian*
47.2
( 33.8 - 60.6 )
.
.
.
.
Black/African American*
52.8
( 46.0 - 59.6 )
.
.
.
.
.
.
.
.
.
.
White*
42.9
( 36.0 - 49.8 )
46.1
( 37.2 - 55.0 )
39.5
( 33.0 - 46.0 )
White Hispanic
53.0
( 45.9 - 60.1 )
55.8
( 44.3 - 67.3 )
50.5
( 35.5 - 65.4 )
Other
46.8
( 40.9 - 52.7 )
54.2
( 44.1 - 64.2 )
39.4
( 32.2 - 46.7 )
American Indian/Alaska Native*
Native Hawaiian/Other Pacific Islander*
*Non-Hispanic. . = Less than 50 students in the subgroup. Version: HS21OCT2014
[email protected]
2013 HEALTHY KIDS COLORADO SURVEY RESULTS Region 4 High School Summary Tables - Weighted Data Table 145. Percentage of students who attended physical education (PE) classes on one or more days in an average week when they were in school Total
Age
Grade
Race/Ethnicity
Male
Female
Percentage
95% confidence interval
Percentage
95% confidence interval
Percentage
95% confidence interval
Total
47.3
( 39.8 - 54.8 )
50.6
( 39.4 - 61.7 )
43.9
( 34.9 - 52.9 )
15 or younger
54.4
( 46.6 - 62.2 )
56.2
( 46.4 - 66.0 )
52.9
( 45.4 - 60.3 )
16 or 17
42.8
( 31.3 - 54.3 )
47.8
( 31.8 - 63.8 )
37.5
( 21.6 - 53.4 )
18 or older
35.7
( 19.7 - 51.7 )
.
.
.
.
9th
59.5
( 52.8 - 66.2 )
57.9
( 47.6 - 68.2 )
61.1
( 53.7 - 68.4 )
10th
45.3
( 22.9 - 67.7 )
46.4
( 19.7 - 73.1 )
44.2
( 26.4 - 62.1 )
11th
41.2
( 30.6 - 51.8 )
49.2
( 39.3 - 59.1 )
33.1
( 18.8 - 47.4 )
12th
42.0
( 30.9 - 53.0 )
48.4
( 37.9 - 59.0 )
35.7
( 15.8 - 55.7 )
American Indian/Alaska Native*
.
.
.
.
.
.
Asian*
.
.
.
.
.
.
Black/African American*
.
.
.
.
.
.
Native Hawaiian/Other Pacific Islander*
.
.
.
.
.
.
White*
48.0
( 39.8 - 56.1 )
50.6
( 41.5 - 59.6 )
45.3
( 33.8 - 56.8 )
White Hispanic
50.3
( 29.0 - 71.7 )
.
.
.
.
Other
44.7
( 35.3 - 54.0 )
.
.
.
.
*Non-Hispanic. . = Less than 50 students in the subgroup. Version: HS21OCT2014
[email protected]
2013 HEALTHY KIDS COLORADO SURVEY RESULTS Region 4 High School Summary Tables - Weighted Data Table 146. Percentage of students who played on one or more sports teams during the past 12 months Total
Age
Grade
Race/Ethnicity
Male
Female
Percentage
95% confidence interval
Percentage
95% confidence interval
Percentage
95% confidence interval
Total
67.3
( 64.0 - 70.7 )
70.4
( 66.8 - 74.0 )
64.1
( 60.4 - 67.9 )
15 or younger
71.4
( 66.3 - 76.4 )
76.8
( 72.0 - 81.5 )
66.3
( 60.5 - 72.1 )
16 or 17
65.2
( 61.3 - 69.2 )
67.7
( 61.6 - 73.9 )
62.8
( 57.9 - 67.6 )
18 or older
56.9
( 51.0 - 62.8 )
55.7
( 46.8 - 64.6 )
58.9
( 44.9 - 72.8 )
9th
76.3
( 72.8 - 79.8 )
79.9
( 74.3 - 85.5 )
72.7
( 67.9 - 77.5 )
10th
65.4
( 56.7 - 74.0 )
69.4
( 65.3 - 73.6 )
60.6
( 47.3 - 73.9 )
11th
66.5
( 64.5 - 68.5 )
69.9
( 65.4 - 74.3 )
63.2
( 59.7 - 66.8 )
12th
61.1
( 58.6 - 63.6 )
62.3
( 54.6 - 69.9 )
59.9
( 53.4 - 66.3 )
.
.
.
.
.
.
Asian*
68.0
( 52.6 - 83.4 )
.
.
.
.
Black/African American*
61.8
( 49.9 - 73.8 )
.
.
.
.
.
.
.
.
.
.
White*
68.1
( 64.7 - 71.6 )
68.6
( 64.4 - 72.8 )
67.7
( 64.0 - 71.3 )
White Hispanic
66.8
( 60.1 - 73.4 )
73.9
( 67.0 - 80.7 )
60.0
( 49.9 - 70.2 )
Other
63.6
( 54.3 - 72.9 )
65.0
( 56.4 - 73.5 )
62.6
( 48.1 - 77.1 )
American Indian/Alaska Native*
Native Hawaiian/Other Pacific Islander*
*Non-Hispanic. . = Less than 50 students in the subgroup. Version: HS21OCT2014
[email protected]
2013 HEALTHY KIDS COLORADO SURVEY RESULTS Region 4 High School Summary Tables - Weighted Data Table 147. Percentage of students who had ever been taught in school about AIDS or HIV infection Total
Age
Grade
Race/Ethnicity
Male
Female
Percentage
95% confidence interval
Percentage
95% confidence interval
Percentage
95% confidence interval
Total
79.2
( 61.5 - 97.0 )
77.7
( 56.2 - 99.3 )
80.7
( 66.7 - 94.7 )
15 or younger
76.7
( 56.6 - 96.8 )
76.0
( 53.7 - 98.3 )
77.2
( 59.2 - 95.2 )
16 or 17
81.4
( 65.4 - 97.4 )
78.9
( 57.2 - 100.0 )
84.0
( 73.6 - 94.4 )
18 or older
80.9
( 63.7 - 98.1 )
80.6
( 61.8 - 99.4 )
81.4
( 66.1 - 96.7 )
9th
70.0
( 44.9 - 95.1 )
70.1
( 42.2 - 98.0 )
69.9
( 47.0 - 92.8 )
10th
83.5
( 63.9 - 100.0 )
79.5
( 54.3 - 100.0 )
87.7
( 75.0 - 100.0 )
11th
82.5
( 70.7 - 94.3 )
82.4
( 68.7 - 96.2 )
82.9
( 72.4 - 93.4 )
12th
81.1
( 65.8 - 96.5 )
78.7
( 58.2 - 99.2 )
83.6
( 73.5 - 93.8 )
.
.
.
.
.
.
Asian*
73.4
( 54.1 - 92.8 )
.
.
.
.
Black/African American*
80.5
( 67.8 - 93.2 )
.
.
.
.
.
.
.
.
.
.
White*
79.4
( 61.5 - 97.3 )
76.6
( 54.5 - 98.7 )
82.4
( 69.3 - 95.5 )
White Hispanic
81.7
( 62.0 - 100.0 )
82.8
( 61.8 - 100.0 )
80.7
( 61.5 - 99.9 )
Other
73.7
( 55.2 - 92.1 )
73.9
( 54.9 - 93.0 )
73.2
( 53.9 - 92.4 )
American Indian/Alaska Native*
Native Hawaiian/Other Pacific Islander*
*Non-Hispanic. . = Less than 50 students in the subgroup. Version: HS21OCT2014
[email protected]
2013 HEALTHY KIDS COLORADO SURVEY RESULTS Region 4 High School Summary Tables - Weighted Data Table 148. Percentage of students who used indoor tanning device in the past 12 months Total
Age
Grade
Race/Ethnicity
Male
Female
Percentage
95% confidence interval
Percentage
95% confidence interval
Percentage
95% confidence interval
Total
4.1
( 1.9 - 6.3 )
2.4
( 0.6 - 4.1 )
5.7
( 2.4 - 9.0 )
15 or younger
1.8
( 0.3 - 3.2 )
0.8
( 0.0 - 1.8 )
2.6
( 0.6 - 4.6 )
16 or 17
5.2
( 2.1 - 8.3 )
2.4
( 0.0 - 4.7 )
7.8
( 2.8 - 12.8 )
18 or older
10.1
( 2.6 - 17.6 )
.
.
.
.
9th
1.2
( 0.0 - 2.5 )
1.0
( 0.0 - 2.6 )
1.4
( 0.0 - 3.0 )
10th
1.7
( 0.3 - 3.1 )
1.4
( 0.0 - 3.8 )
2.0
( 0.0 - 4.3 )
11th
5.4
( 1.3 - 9.5 )
2.6
( 0.0 - 5.2 )
7.4
( 2.0 - 12.8 )
12th
7.9
( 0.8 - 15.1 )
4.3
( 0.0 - 9.7 )
11.6
( 0.2 - 22.9 )
American Indian/Alaska Native*
.
.
.
.
.
.
Asian*
.
.
.
.
.
.
Black/African American*
.
.
.
.
.
.
Native Hawaiian/Other Pacific Islander*
.
.
.
.
.
.
White*
3.6
( 1.6 - 5.5 )
1.0
( 0.2 - 1.9 )
6.0
( 2.6 - 9.5 )
White Hispanic
3.4
( 0.0 - 7.5 )
.
.
.
.
Other
12.3
( 3.4 - 21.2 )
.
.
.
.
*Non-Hispanic. . = Less than 50 students in the subgroup. Version: HS21OCT2014
[email protected]
2013 HEALTHY KIDS COLORADO SURVEY RESULTS Region 4 High School Summary Tables - Weighted Data Table 149. Percentage of students who had ever been told by a doctor or nurse that they had asthma Total
Age
Grade
Race/Ethnicity
Male
Female
Percentage
95% confidence interval
Percentage
95% confidence interval
Percentage
95% confidence interval
Total
20.0
( 16.2 - 23.8 )
20.4
( 16.3 - 24.5 )
19.6
( 16.1 - 23.1 )
15 or younger
20.3
( 17.8 - 22.7 )
21.2
( 16.7 - 25.7 )
19.7
( 16.2 - 23.1 )
16 or 17
20.2
( 12.4 - 28.1 )
21.5
( 12.3 - 30.7 )
18.8
( 10.1 - 27.5 )
18 or older
17.3
( 9.3 - 25.3 )
.
.
.
.
9th
17.6
( 12.7 - 22.5 )
16.8
( 7.1 - 26.5 )
18.3
( 13.1 - 23.6 )
10th
20.1
( 16.5 - 23.6 )
19.1
( 10.4 - 27.8 )
21.5
( 16.9 - 26.1 )
11th
23.3
( 11.0 - 35.6 )
28.3
( 10.9 - 45.6 )
17.9
( 5.4 - 30.4 )
12th
19.4
( 12.6 - 26.2 )
17.7
( 8.8 - 26.7 )
21.0
( 14.5 - 27.5 )
American Indian/Alaska Native*
.
.
.
.
.
.
Asian*
.
.
.
.
.
.
Black/African American*
.
.
.
.
.
.
Native Hawaiian/Other Pacific Islander*
.
.
.
.
.
.
White*
17.6
( 14.3 - 21.0 )
16.6
( 12.1 - 21.1 )
18.6
( 13.8 - 23.4 )
White Hispanic
23.5
( 11.5 - 35.6 )
.
.
.
.
Other
23.6
( 18.3 - 28.9 )
.
.
.
.
*Non-Hispanic. . = Less than 50 students in the subgroup. Version: HS21OCT2014
[email protected]
2013 HEALTHY KIDS COLORADO SURVEY RESULTS Region 4 High School Summary Tables - Weighted Data Table 150. Percentage of students who sleep 8 or more hours per night on average school nights Total
Age
Grade
Race/Ethnicity
Male
Female
Percentage
95% confidence interval
Percentage
95% confidence interval
Percentage
95% confidence interval
Total
35.9
( 32.1 - 39.8 )
40.9
( 37.3 - 44.4 )
30.8
( 25.9 - 35.8 )
15 or younger
46.5
( 39.2 - 53.8 )
55.7
( 47.2 - 64.3 )
38.1
( 29.4 - 46.8 )
16 or 17
28.4
( 25.0 - 31.7 )
32.9
( 29.4 - 36.3 )
23.8
( 19.2 - 28.4 )
18 or older
23.6
( 16.2 - 31.0 )
.
.
.
.
9th
49.3
( 39.3 - 59.3 )
55.4
( 45.5 - 65.3 )
43.4
( 32.2 - 54.5 )
10th
43.6
( 33.0 - 54.3 )
53.3
( 44.9 - 61.8 )
33.8
( 22.9 - 44.6 )
11th
27.9
( 22.2 - 33.5 )
33.7
( 28.5 - 38.9 )
21.9
( 15.4 - 28.4 )
12th
21.6
( 14.3 - 28.9 )
19.9
( 11.7 - 28.0 )
23.3
( 13.4 - 33.2 )
American Indian/Alaska Native*
.
.
.
.
.
.
Asian*
.
.
.
.
.
.
Black/African American*
.
.
.
.
.
.
Native Hawaiian/Other Pacific Islander*
.
.
.
.
.
.
White*
37.6
( 31.0 - 44.2 )
40.6
( 34.7 - 46.6 )
34.7
( 26.3 - 43.1 )
White Hispanic
40.3
( 35.2 - 45.4 )
.
.
.
.
Other
31.9
( 22.2 - 41.7 )
.
.
.
.
*Non-Hispanic. . = Less than 50 students in the subgroup. Version: HS21OCT2014
[email protected]
2013 HEALTHY KIDS COLORADO SURVEY RESULTS Region 4 High School Summary Tables - Weighted Data Table 151. Percentage of students who participated in organized community services as a non-paid volunteer 1 or more times during the past 30 days Total
Age
Grade
Race/Ethnicity
Male
Female
Percentage
95% confidence interval
Percentage
95% confidence interval
Percentage
95% confidence interval
Total
53.2
( 46.9 - 59.6 )
45.5
( 40.8 - 50.3 )
61.2
( 52.0 - 70.4 )
15 or younger
49.8
( 40.9 - 58.8 )
36.6
( 29.3 - 44.0 )
62.3
( 51.6 - 73.0 )
16 or 17
57.0
( 48.8 - 65.1 )
52.6
( 48.2 - 57.0 )
61.6
( 49.0 - 74.1 )
18 or older
48.8
( 26.7 - 70.8 )
.
.
.
.
9th
53.1
( 41.6 - 64.5 )
39.8
( 25.9 - 53.6 )
65.6
( 52.4 - 78.9 )
10th
47.5
( 35.2 - 59.7 )
42.4
( 32.1 - 52.6 )
54.0
( 30.8 - 77.1 )
11th
56.6
( 49.7 - 63.4 )
53.6
( 43.3 - 63.8 )
59.2
( 48.1 - 70.4 )
12th
56.4
( 41.3 - 71.5 )
47.4
( 26.7 - 68.1 )
65.3
( 45.9 - 84.7 )
American Indian/Alaska Native*
.
.
.
.
.
.
Asian*
.
.
.
.
.
.
Black/African American*
.
.
.
.
.
.
Native Hawaiian/Other Pacific Islander*
.
.
.
.
.
.
White*
54.0
( 50.5 - 57.5 )
46.2
( 43.6 - 48.8 )
62.4
( 56.6 - 68.3 )
White Hispanic
50.4
( 36.6 - 64.3 )
.
.
.
.
Other
55.5
( 38.8 - 72.3 )
.
.
.
.
*Non-Hispanic. . = Less than 50 students in the subgroup. Version: HS21OCT2014
[email protected]
2013 HEALTHY KIDS COLORADO SURVEY RESULTS Region 4 High School Summary Tables - Weighted Data Table 152. Percentage of students who strongly agree or agree that teachers care about them and encourage them Total
Age
Grade
Race/Ethnicity
Male
Female
Percentage
95% confidence interval
Percentage
95% confidence interval
Percentage
95% confidence interval
Total
63.9
( 56.6 - 71.2 )
64.4
( 55.7 - 73.1 )
63.8
( 57.4 - 70.2 )
15 or younger
61.0
( 50.4 - 71.5 )
61.9
( 49.2 - 74.5 )
60.7
( 49.7 - 71.7 )
16 or 17
66.7
( 59.3 - 74.1 )
67.9
( 56.0 - 79.7 )
65.6
( 59.6 - 71.6 )
18 or older
63.7
( 55.6 - 71.8 )
.
.
.
.
9th
65.7
( 52.7 - 78.6 )
65.9
( 48.5 - 83.4 )
65.4
( 55.0 - 75.9 )
10th
55.5
( 46.0 - 64.9 )
59.2
( 53.2 - 65.1 )
51.7
( 37.7 - 65.7 )
11th
70.1
( 61.3 - 78.8 )
68.2
( 55.9 - 80.5 )
72.4
( 64.0 - 80.9 )
12th
65.6
( 57.9 - 73.3 )
65.1
( 50.8 - 79.5 )
66.1
( 61.8 - 70.4 )
American Indian/Alaska Native*
.
.
.
.
.
.
Asian*
.
.
.
.
.
.
Black/African American*
.
.
.
.
.
.
Native Hawaiian/Other Pacific Islander*
.
.
.
.
.
.
White*
67.7
( 60.4 - 75.0 )
69.5
( 61.1 - 77.8 )
65.9
( 59.3 - 72.5 )
White Hispanic
59.4
( 49.6 - 69.2 )
.
.
.
.
Other
46.2
( 37.0 - 55.5 )
.
.
.
.
*Non-Hispanic. . = Less than 50 students in the subgroup. Version: HS21OCT2014
[email protected]
2013 HEALTHY KIDS COLORADO SURVEY RESULTS Region 4 High School Summary Tables - Weighted Data Table 153. Percentage of students who have someone to go to for help with a serious problem Total
Age
Grade
Race/Ethnicity
Male
Female
Percentage
95% confidence interval
Percentage
95% confidence interval
Percentage
95% confidence interval
Total
83.4
( 81.3 - 85.6 )
84.7
( 81.4 - 87.9 )
82.1
( 79.9 - 84.3 )
15 or younger
82.6
( 81.5 - 83.7 )
84.2
( 80.6 - 87.8 )
81.0
( 77.8 - 84.2 )
16 or 17
84.2
( 79.8 - 88.6 )
84.2
( 76.6 - 91.7 )
84.4
( 81.6 - 87.2 )
18 or older
82.9
( 74.2 - 91.5 )
.
.
.
.
9th
82.3
( 77.3 - 87.4 )
84.9
( 75.4 - 94.3 )
80.0
( 74.6 - 85.3 )
10th
83.8
( 79.2 - 88.3 )
85.5
( 80.6 - 90.4 )
81.6
( 73.1 - 90.1 )
11th
84.9
( 79.8 - 89.9 )
80.6
( 73.3 - 88.0 )
89.7
( 83.8 - 95.7 )
12th
82.7
( 78.3 - 87.0 )
87.3
( 79.1 - 95.6 )
78.1
( 73.3 - 82.8 )
American Indian/Alaska Native*
.
.
.
.
.
.
Asian*
.
.
.
.
.
.
Black/African American*
.
.
.
.
.
.
Native Hawaiian/Other Pacific Islander*
.
.
.
.
.
.
White*
85.6
( 83.7 - 87.5 )
85.5
( 83.0 - 87.9 )
85.9
( 83.3 - 88.4 )
White Hispanic
81.0
( 67.5 - 94.5 )
.
.
.
.
Other
81.6
( 73.1 - 90.2 )
.
.
.
.
*Non-Hispanic. . = Less than 50 students in the subgroup. Version: HS21OCT2014
[email protected]
2013 HEALTHY KIDS COLORADO SURVEY RESULTS Region 4 High School Summary Tables - Weighted Data Table 154. Percentage of students who described their grades as mostly A's or B's over the past 12 months Total
Age
Grade
Race/Ethnicity
Male
Female
Percentage
95% confidence interval
Percentage
95% confidence interval
Percentage
95% confidence interval
Total
83.1
( 78.7 - 87.5 )
78.8
( 72.1 - 85.5 )
87.8
( 85.3 - 90.3 )
15 or younger
80.4
( 76.3 - 84.6 )
77.2
( 71.4 - 83.0 )
84.1
( 78.9 - 89.3 )
16 or 17
84.7
( 77.4 - 92.0 )
79.0
( 66.7 - 91.2 )
90.4
( 86.6 - 94.2 )
18 or older
88.3
( 79.9 - 96.6 )
.
.
.
.
9th
85.2
( 77.2 - 93.3 )
83.5
( 69.8 - 97.3 )
87.0
( 79.6 - 94.4 )
10th
78.9
( 75.4 - 82.4 )
75.6
( 71.4 - 79.8 )
82.5
( 76.6 - 88.5 )
11th
83.9
( 73.9 - 93.8 )
76.7
( 64.7 - 88.7 )
91.5
( 87.1 - 95.9 )
12th
85.6
( 80.9 - 90.3 )
81.1
( 71.3 - 90.9 )
90.1
( 83.3 - 96.8 )
American Indian/Alaska Native*
.
.
.
.
.
.
Asian*
.
.
.
.
.
.
Black/African American*
.
.
.
.
.
.
Native Hawaiian/Other Pacific Islander*
.
.
.
.
.
.
White*
87.1
( 82.7 - 91.5 )
84.7
( 77.2 - 92.3 )
89.6
( 86.4 - 92.8 )
White Hispanic
75.8
( 66.2 - 85.4 )
.
.
.
.
Other
76.6
( 68.0 - 85.2 )
76.5
( 69.2 - 83.9 )
77.9
( 65.4 - 90.4 )
*Non-Hispanic. . = Less than 50 students in the subgroup. Version: HS21OCT2014
[email protected]
2013 HEALTHY KIDS COLORADO SURVEY RESULTS Region 4 High School Summary Tables - Weighted Data Table 155. Percentage of students who participate in extracurricular activities Total
Age
Grade
Race/Ethnicity
Male
Female
Percentage
95% confidence interval
Percentage
95% confidence interval
Percentage
95% confidence interval
Total
76.5
( 72.3 - 80.7 )
74.3
( 69.4 - 79.1 )
78.9
( 73.8 - 84.0 )
15 or younger
76.9
( 71.0 - 82.7 )
75.1
( 68.1 - 82.1 )
79.0
( 73.4 - 84.6 )
16 or 17
76.4
( 71.9 - 81.0 )
74.0
( 69.6 - 78.4 )
78.7
( 71.7 - 85.8 )
18 or older
75.6
( 60.9 - 90.3 )
.
.
.
.
9th
75.5
( 67.4 - 83.7 )
77.1
( 67.3 - 86.8 )
73.9
( 65.1 - 82.8 )
10th
80.2
( 72.7 - 87.7 )
77.0
( 66.0 - 88.0 )
83.8
( 76.3 - 91.3 )
11th
80.9
( 77.0 - 84.8 )
78.8
( 70.2 - 87.4 )
83.1
( 78.3 - 87.9 )
12th
71.3
( 62.0 - 80.6 )
66.0
( 54.3 - 77.6 )
76.6
( 63.2 - 90.0 )
American Indian/Alaska Native*
.
.
.
.
.
.
Asian*
.
.
.
.
.
.
Black/African American*
.
.
.
.
.
.
Native Hawaiian/Other Pacific Islander*
.
.
.
.
.
.
White*
78.7
( 74.4 - 83.1 )
76.7
( 69.6 - 83.9 )
80.8
( 73.4 - 88.2 )
White Hispanic
71.8
( 68.6 - 74.9 )
.
.
.
.
Other
73.5
( 63.8 - 83.1 )
76.7
( 67.5 - 86.0 )
70.8
( 58.8 - 82.8 )
*Non-Hispanic. . = Less than 50 students in the subgroup. Version: HS21OCT2014
[email protected]
2013 HEALTHY KIDS COLORADO SURVEY RESULTS Region 4 High School Summary Tables - Weighted Data Table 156. Percentage of students who skipped 1+ whole days of school during last 4 weeks Total
Age
Grade
Race/Ethnicity
Male
Female
Percentage
95% confidence interval
Percentage
95% confidence interval
Percentage
95% confidence interval
Total
16.0
( 12.8 - 19.3 )
16.1
( 12.4 - 19.8 )
15.9
( 12.8 - 18.9 )
15 or younger
16.0
( 13.4 - 18.6 )
15.2
( 13.6 - 16.9 )
16.6
( 12.3 - 20.9 )
16 or 17
15.6
( 10.7 - 20.4 )
16.3
( 8.4 - 24.3 )
14.8
( 12.5 - 17.2 )
18 or older
19.3
( 11.3 - 27.3 )
.
.
.
.
9th
12.7
( 7.8 - 17.6 )
8.5
( 5.9 - 11.0 )
17.1
( 9.2 - 24.9 )
10th
13.2
( 8.8 - 17.6 )
13.3
( 8.8 - 17.8 )
13.2
( 7.6 - 18.8 )
11th
14.7
( 8.2 - 21.2 )
14.6
( 8.3 - 20.9 )
14.7
( 6.6 - 22.9 )
12th
22.5
( 16.1 - 28.9 )
26.6
( 13.6 - 39.6 )
18.3
( 14.5 - 22.1 )
American Indian/Alaska Native*
.
.
.
.
.
.
Asian*
.
.
.
.
.
.
Black/African American*
.
.
.
.
.
.
Native Hawaiian/Other Pacific Islander*
.
.
.
.
.
.
White*
13.3
( 9.9 - 16.8 )
13.1
( 9.3 - 16.9 )
13.6
( 9.5 - 17.7 )
White Hispanic
24.3
( 14.0 - 34.6 )
.
.
.
.
Other
21.3
( 8.6 - 34.1 )
18.8
( 8.1 - 29.6 )
22.9
( 4.4 - 41.5 )
*Non-Hispanic. . = Less than 50 students in the subgroup. Version: HS21OCT2014
[email protected]
2013 HEALTHY KIDS COLORADO SURVEY RESULTS Region 4 High School Summary Tables - Weighted Data Table 157. Percentage of students who feel school work/assignments are often/almost always important and meaningful Total
Age
Grade
Race/Ethnicity
Male
Female
Percentage
95% confidence interval
Percentage
95% confidence interval
Percentage
95% confidence interval
Total
37.1
( 34.8 - 39.4 )
36.5
( 34.3 - 38.8 )
37.7
( 33.7 - 41.7 )
15 or younger
36.4
( 31.6 - 41.2 )
40.3
( 37.0 - 43.6 )
32.4
( 26.2 - 38.5 )
16 or 17
38.6
( 35.8 - 41.4 )
35.4
( 32.3 - 38.4 )
41.7
( 36.5 - 47.0 )
18 or older
31.2
( 17.4 - 45.0 )
.
.
.
.
9th
39.6
( 33.8 - 45.5 )
43.9
( 38.7 - 49.2 )
35.2
( 27.8 - 42.6 )
10th
34.9
( 27.9 - 41.9 )
35.3
( 26.6 - 44.0 )
34.4
( 27.2 - 41.5 )
11th
39.9
( 32.3 - 47.6 )
38.3
( 27.4 - 49.1 )
41.6
( 31.5 - 51.7 )
12th
34.6
( 26.8 - 42.3 )
28.4
( 17.8 - 39.0 )
40.7
( 28.8 - 52.7 )
American Indian/Alaska Native*
.
.
.
.
.
.
Asian*
.
.
.
.
.
.
Black/African American*
.
.
.
.
.
.
Native Hawaiian/Other Pacific Islander*
.
.
.
.
.
.
White*
37.9
( 32.6 - 43.1 )
33.9
( 27.9 - 39.8 )
42.1
( 35.9 - 48.3 )
White Hispanic
33.4
( 23.1 - 43.6 )
.
.
.
.
Other
32.9
( 21.9 - 43.9 )
39.3
( 25.5 - 53.2 )
26.1
( 10.3 - 41.9 )
*Non-Hispanic. . = Less than 50 students in the subgroup. Version: HS21OCT2014
[email protected]
2013 HEALTHY KIDS COLORADO SURVEY RESULTS Region 4 High School Summary Tables - Weighted Data Table 158. Percentage of students who feel that most courses are very interesting or stimulating/quite interesting Total
Age
Grade
Race/Ethnicity
Male
Female
Percentage
95% confidence interval
Percentage
95% confidence interval
Percentage
95% confidence interval
Total
31.5
( 26.6 - 36.3 )
30.7
( 24.5 - 36.9 )
32.3
( 27.6 - 37.0 )
15 or younger
25.4
( 18.4 - 32.4 )
26.0
( 16.6 - 35.3 )
24.8
( 15.4 - 34.2 )
16 or 17
36.5
( 32.4 - 40.6 )
35.4
( 30.2 - 40.6 )
37.6
( 30.0 - 45.1 )
18 or older
36.3
( 20.9 - 51.6 )
.
.
.
.
9th
29.3
( 20.6 - 38.0 )
29.5
( 15.5 - 43.4 )
29.2
( 16.2 - 42.2 )
10th
23.1
( 16.8 - 29.5 )
22.0
( 10.6 - 33.5 )
24.4
( 20.7 - 28.2 )
11th
32.4
( 26.4 - 38.4 )
34.4
( 25.4 - 43.3 )
30.4
( 20.4 - 40.4 )
12th
41.9
( 31.1 - 52.6 )
38.3
( 30.7 - 45.9 )
45.4
( 30.2 - 60.7 )
American Indian/Alaska Native*
.
.
.
.
.
.
Asian*
.
.
.
.
.
.
Black/African American*
.
.
.
.
.
.
Native Hawaiian/Other Pacific Islander*
.
.
.
.
.
.
White*
36.3
( 29.0 - 43.6 )
36.0
( 28.3 - 43.6 )
36.6
( 28.5 - 44.7 )
White Hispanic
22.2
( 12.4 - 32.0 )
.
.
.
.
Other
22.1
( 12.4 - 31.9 )
20.7
( 9.8 - 31.5 )
24.1
( 13.0 - 35.3 )
*Non-Hispanic. . = Less than 50 students in the subgroup. Version: HS21OCT2014
[email protected]
2013 HEALTHY KIDS COLORADO SURVEY RESULTS Region 4 High School Summary Tables - Weighted Data Table 159. Percentage of students who feel things they are learning in school now are going to be very/quite important later in life Total
Age
Grade
Race/Ethnicity
Male
Female
Percentage
95% confidence interval
Percentage
95% confidence interval
Percentage
95% confidence interval
Total
42.4
( 36.3 - 48.6 )
43.8
( 35.7 - 51.9 )
41.0
( 35.6 - 46.5 )
15 or younger
47.6
( 39.5 - 55.6 )
48.9
( 41.4 - 56.4 )
46.3
( 35.9 - 56.6 )
16 or 17
40.2
( 33.1 - 47.2 )
42.7
( 31.7 - 53.7 )
37.7
( 33.4 - 42.0 )
18 or older
25.9
( 17.1 - 34.7 )
.
.
.
.
9th
58.0
( 48.3 - 67.6 )
58.3
( 46.6 - 70.1 )
57.6
( 45.0 - 70.2 )
10th
37.4
( 33.4 - 41.4 )
41.4
( 34.5 - 48.3 )
32.8
( 28.0 - 37.7 )
11th
41.8
( 34.2 - 49.4 )
43.1
( 32.5 - 53.7 )
40.5
( 34.6 - 46.4 )
12th
33.5
( 22.8 - 44.3 )
32.7
( 14.5 - 50.8 )
34.4
( 26.7 - 42.2 )
American Indian/Alaska Native*
.
.
.
.
.
.
Asian*
.
.
.
.
.
.
Black/African American*
.
.
.
.
.
.
Native Hawaiian/Other Pacific Islander*
.
.
.
.
.
.
White*
43.1
( 35.2 - 50.9 )
45.0
( 36.6 - 53.5 )
41.0
( 33.2 - 48.8 )
White Hispanic
39.2
( 28.5 - 49.9 )
.
.
.
.
Other
35.3
( 24.7 - 45.8 )
28.9
( 16.6 - 41.2 )
43.0
( 22.6 - 63.3 )
*Non-Hispanic. . = Less than 50 students in the subgroup. Version: HS21OCT2014
[email protected]
2013 HEALTHY KIDS COLORADO SURVEY RESULTS Region 4 High School Summary Tables - Weighted Data Table 160. Percentage of students who often/almost always enjoyed being in school over the past year Total
Age
Grade
Race/Ethnicity
Male
Female
Percentage
95% confidence interval
Percentage
95% confidence interval
Percentage
95% confidence interval
Total
43.8
( 39.4 - 48.3 )
46.0
( 38.5 - 53.4 )
41.7
( 35.5 - 47.8 )
15 or younger
44.8
( 41.3 - 48.3 )
46.3
( 40.0 - 52.6 )
43.4
( 35.9 - 50.9 )
16 or 17
44.0
( 38.4 - 49.5 )
46.5
( 38.5 - 54.5 )
41.5
( 33.9 - 49.1 )
18 or older
37.9
( 21.5 - 54.2 )
.
.
.
.
9th
48.6
( 42.6 - 54.5 )
50.3
( 44.1 - 56.5 )
46.7
( 34.7 - 58.7 )
10th
39.9
( 36.1 - 43.8 )
41.5
( 28.0 - 55.1 )
38.1
( 28.7 - 47.5 )
11th
43.4
( 39.6 - 47.3 )
47.0
( 38.2 - 55.9 )
39.7
( 33.0 - 46.5 )
12th
43.8
( 31.8 - 55.7 )
46.9
( 34.2 - 59.6 )
40.7
( 27.9 - 53.4 )
American Indian/Alaska Native*
.
.
.
.
.
.
Asian*
.
.
.
.
.
.
Black/African American*
.
.
.
.
.
.
Native Hawaiian/Other Pacific Islander*
.
.
.
.
.
.
White*
45.9
( 38.0 - 53.7 )
49.3
( 41.5 - 57.0 )
42.2
( 32.3 - 52.2 )
White Hispanic
38.5
( 25.2 - 51.8 )
.
.
.
.
Other
43.4
( 36.2 - 50.5 )
44.1
( 27.2 - 61.0 )
43.3
( 23.6 - 63.0 )
*Non-Hispanic. . = Less than 50 students in the subgroup. Version: HS21OCT2014
[email protected]
2013 HEALTHY KIDS COLORADO SURVEY RESULTS Region 4 High School Summary Tables - Weighted Data Table 161. Percentage of students who often/almost always hated being in school over the past year Total
Age
Grade
Race/Ethnicity
Male
Female
Percentage
95% confidence interval
Percentage
95% confidence interval
Percentage
95% confidence interval
Total
30.9
( 25.3 - 36.5 )
29.6
( 22.9 - 36.3 )
32.3
( 25.7 - 38.9 )
15 or younger
31.5
( 26.1 - 36.9 )
31.2
( 25.6 - 36.8 )
31.9
( 23.6 - 40.1 )
16 or 17
31.4
( 25.5 - 37.3 )
29.5
( 19.6 - 39.4 )
33.2
( 28.2 - 38.2 )
18 or older
24.2
( 14.7 - 33.7 )
.
.
.
.
9th
28.9
( 21.4 - 36.3 )
30.7
( 25.8 - 35.6 )
26.9
( 15.1 - 38.8 )
10th
33.1
( 30.1 - 36.1 )
25.6
( 18.1 - 33.0 )
41.7
( 31.7 - 51.8 )
11th
33.1
( 25.0 - 41.2 )
31.0
( 16.6 - 45.5 )
35.3
( 34.4 - 36.1 )
12th
28.3
( 19.7 - 36.8 )
30.1
( 20.6 - 39.7 )
26.3
( 16.5 - 36.2 )
American Indian/Alaska Native*
.
.
.
.
.
.
Asian*
.
.
.
.
.
.
Black/African American*
.
.
.
.
.
.
Native Hawaiian/Other Pacific Islander*
.
.
.
.
.
.
White*
25.6
( 21.3 - 30.0 )
23.1
( 17.9 - 28.3 )
28.4
( 22.5 - 34.2 )
White Hispanic
41.1
( 33.3 - 48.9 )
.
.
.
.
Other
34.9
( 27.7 - 42.1 )
35.7
( 20.6 - 50.8 )
34.5
( 27.2 - 41.8 )
*Non-Hispanic. . = Less than 50 students in the subgroup. Version: HS21OCT2014
[email protected]
2013 HEALTHY KIDS COLORADO SURVEY RESULTS Region 4 High School Summary Tables - Weighted Data Table 162. Percentage of students who often/almost always tried to do their best work in school over the past year Total
Age
Grade
Race/Ethnicity
Male
Female
Percentage
95% confidence interval
Percentage
95% confidence interval
Percentage
95% confidence interval
Total
76.1
( 71.5 - 80.7 )
72.1
( 68.1 - 76.1 )
80.3
( 73.6 - 87.1 )
15 or younger
77.0
( 73.1 - 80.9 )
76.5
( 74.5 - 78.5 )
77.7
( 69.8 - 85.6 )
16 or 17
77.3
( 69.0 - 85.5 )
70.8
( 63.7 - 77.9 )
83.5
( 73.1 - 93.8 )
18 or older
64.1
( 54.6 - 73.7 )
.
.
.
.
9th
81.2
( 77.1 - 85.2 )
81.6
( 77.9 - 85.3 )
80.7
( 72.2 - 89.2 )
10th
70.1
( 65.7 - 74.4 )
68.0
( 61.8 - 74.2 )
72.5
( 65.0 - 80.0 )
11th
81.5
( 70.6 - 92.3 )
75.1
( 64.6 - 85.6 )
88.0
( 78.2 - 97.8 )
12th
72.3
( 65.1 - 79.4 )
64.7
( 56.5 - 72.9 )
79.8
( 71.2 - 88.4 )
American Indian/Alaska Native*
.
.
.
.
.
.
Asian*
.
.
.
.
.
.
Black/African American*
.
.
.
.
.
.
Native Hawaiian/Other Pacific Islander*
.
.
.
.
.
.
White*
81.9
( 77.9 - 85.8 )
78.6
( 74.2 - 83.1 )
85.3
( 80.7 - 89.9 )
White Hispanic
62.0
( 54.5 - 69.6 )
.
.
.
.
Other
65.4
( 54.5 - 76.3 )
70.3
( 60.9 - 79.6 )
60.9
( 41.7 - 80.1 )
*Non-Hispanic. . = Less than 50 students in the subgroup. Version: HS21OCT2014
[email protected]
2013 HEALTHY KIDS COLORADO SURVEY RESULTS Region 4 High School Summary Tables - Weighted Data Table 163. Percentage of students who think there are lots of chances to help decide things like class activities and rules Total
Age
Grade
Race/Ethnicity
Male
Female
Percentage
95% confidence interval
Percentage
95% confidence interval
Percentage
95% confidence interval
Total
43.3
( 37.2 - 49.5 )
44.6
( 36.4 - 52.9 )
42.0
( 36.6 - 47.5 )
15 or younger
43.0
( 31.9 - 54.1 )
46.3
( 36.3 - 56.2 )
39.6
( 26.5 - 52.7 )
16 or 17
44.0
( 40.2 - 47.9 )
43.9
( 33.9 - 53.8 )
44.2
( 40.2 - 48.2 )
18 or older
41.8
( 23.8 - 59.8 )
.
.
.
.
9th
44.9
( 32.2 - 57.6 )
49.5
( 35.2 - 63.7 )
40.2
( 29.4 - 51.0 )
10th
41.5
( 32.0 - 50.9 )
42.6
( 35.6 - 49.6 )
40.2
( 25.0 - 55.4 )
11th
42.8
( 37.0 - 48.6 )
38.8
( 26.1 - 51.6 )
47.0
( 37.1 - 56.9 )
12th
45.6
( 38.3 - 52.9 )
49.5
( 42.1 - 56.8 )
41.8
( 32.1 - 51.5 )
American Indian/Alaska Native*
.
.
.
.
.
.
Asian*
.
.
.
.
.
.
Black/African American*
.
.
.
.
.
.
Native Hawaiian/Other Pacific Islander*
.
.
.
.
.
.
White*
43.8
( 38.0 - 49.6 )
43.0
( 36.3 - 49.7 )
44.7
( 38.6 - 50.8 )
White Hispanic
41.2
( 30.9 - 51.4 )
.
.
.
.
Other
39.1
( 24.5 - 53.8 )
41.6
( 24.8 - 58.4 )
36.9
( 17.4 - 56.5 )
*Non-Hispanic. . = Less than 50 students in the subgroup. Version: HS21OCT2014
[email protected]
2013 HEALTHY KIDS COLORADO SURVEY RESULTS Region 4 High School Summary Tables - Weighted Data Table 164. Percentage of students who think that teachers ask them to work on special classroom projects Total
Age
Grade
Race/Ethnicity
Male
Female
Percentage
95% confidence interval
Percentage
95% confidence interval
Percentage
95% confidence interval
Total
36.4
( 32.5 - 40.3 )
37.3
( 33.0 - 41.6 )
35.4
( 30.2 - 40.6 )
15 or younger
36.1
( 32.5 - 39.8 )
34.1
( 27.5 - 40.7 )
38.3
( 33.8 - 42.7 )
16 or 17
36.3
( 28.7 - 43.8 )
40.9
( 35.2 - 46.6 )
31.8
( 23.7 - 39.9 )
18 or older
38.1
( 26.9 - 49.3 )
.
.
.
.
9th
40.7
( 36.8 - 44.5 )
37.0
( 29.5 - 44.5 )
44.6
( 38.2 - 51.0 )
10th
31.5
( 27.2 - 35.7 )
28.4
( 22.3 - 34.6 )
35.1
( 28.9 - 41.4 )
11th
35.1
( 24.5 - 45.7 )
44.8
( 35.7 - 53.8 )
25.1
( 15.6 - 34.7 )
12th
38.7
( 27.7 - 49.7 )
39.8
( 28.6 - 51.0 )
37.6
( 21.9 - 53.3 )
American Indian/Alaska Native*
.
.
.
.
.
.
Asian*
.
.
.
.
.
.
Black/African American*
.
.
.
.
.
.
Native Hawaiian/Other Pacific Islander*
.
.
.
.
.
.
White*
37.9
( 32.6 - 43.2 )
36.7
( 28.7 - 44.7 )
39.1
( 34.4 - 43.8 )
White Hispanic
30.7
( 16.1 - 45.2 )
.
.
.
.
Other
39.2
( 28.9 - 49.5 )
34.6
( 22.2 - 46.9 )
43.9
( 29.4 - 58.5 )
*Non-Hispanic. . = Less than 50 students in the subgroup. Version: HS21OCT2014
[email protected]
2013 HEALTHY KIDS COLORADO SURVEY RESULTS Region 4 High School Summary Tables - Weighted Data Table 165. Percentage of students who think there are lots of chances for students in their school to get involved in sports, clubs, or other school activities outside of class Total
Age
Grade
Race/Ethnicity
Male
Female
Percentage
95% confidence interval
Percentage
95% confidence interval
Percentage
95% confidence interval
Total
94.4
( 92.3 - 96.6 )
93.7
( 90.1 - 97.3 )
95.4
( 94.0 - 96.8 )
15 or younger
93.9
( 90.1 - 97.8 )
92.4
( 84.5 - 100.0 )
95.8
( 91.9 - 99.8 )
16 or 17
94.8
( 92.7 - 97.0 )
94.8
( 91.2 - 98.4 )
94.8
( 91.1 - 98.4 )
18 or older
95.3
( 91.0 - 99.7 )
.
.
.
.
9th
93.6
( 88.9 - 98.3 )
92.0
( 82.1 - 100.0 )
95.2
( 90.0 - 100.0 )
10th
95.2
( 92.9 - 97.5 )
93.1
( 89.4 - 96.7 )
97.7
( 95.1 - 100.0 )
11th
93.3
( 90.3 - 96.3 )
95.2
( 91.2 - 99.2 )
91.3
( 85.1 - 97.5 )
12th
97.1
( 94.8 - 99.3 )
96.6
( 93.6 - 99.5 )
97.6
( 95.0 - 100.0 )
American Indian/Alaska Native*
.
.
.
.
.
.
Asian*
.
.
.
.
.
.
Black/African American*
.
.
.
.
.
.
Native Hawaiian/Other Pacific Islander*
.
.
.
.
.
.
White*
97.0
( 95.3 - 98.8 )
95.5
( 92.7 - 98.4 )
98.7
( 97.7 - 99.6 )
White Hispanic
91.2
( 86.2 - 96.3 )
.
.
.
.
Other
88.1
( 79.2 - 97.0 )
84.6
( 74.9 - 94.3 )
93.3
( 85.2 - 100.0 )
*Non-Hispanic. . = Less than 50 students in the subgroup. Version: HS21OCT2014
[email protected]
2013 HEALTHY KIDS COLORADO SURVEY RESULTS Region 4 High School Summary Tables - Weighted Data Table 166. Percentage of students who think there are lots of chances for students to talk with teachers one-on-one Total
Age
Grade
Race/Ethnicity
Male
Female
Percentage
95% confidence interval
Percentage
95% confidence interval
Percentage
95% confidence interval
Total
86.9
( 82.7 - 91.1 )
89.4
( 84.4 - 94.3 )
84.4
( 81.0 - 87.9 )
15 or younger
86.8
( 81.1 - 92.5 )
89.0
( 83.8 - 94.3 )
84.6
( 76.6 - 92.7 )
16 or 17
86.7
( 82.6 - 90.7 )
89.5
( 83.6 - 95.5 )
83.9
( 79.0 - 88.8 )
18 or older
88.8
( 81.1 - 96.6 )
.
.
.
.
9th
89.5
( 83.6 - 95.4 )
89.3
( 80.4 - 98.3 )
89.7
( 82.0 - 97.4 )
10th
85.1
( 79.0 - 91.2 )
88.4
( 80.7 - 96.0 )
81.3
( 74.3 - 88.3 )
11th
80.9
( 76.3 - 85.5 )
87.5
( 82.7 - 92.4 )
74.2
( 69.2 - 79.2 )
12th
93.1
( 90.1 - 96.0 )
94.2
( 88.4 - 100.0 )
92.0
( 89.2 - 94.8 )
American Indian/Alaska Native*
.
.
.
.
.
.
Asian*
.
.
.
.
.
.
Black/African American*
.
.
.
.
.
.
Native Hawaiian/Other Pacific Islander*
.
.
.
.
.
.
White*
89.5
( 85.6 - 93.4 )
92.0
( 87.7 - 96.3 )
86.9
( 83.6 - 90.2 )
White Hispanic
85.9
( 79.7 - 92.1 )
.
.
.
.
Other
77.9
( 63.2 - 92.6 )
69.4
( 50.4 - 88.4 )
88.4
( 75.7 - 100.0 )
*Non-Hispanic. . = Less than 50 students in the subgroup. Version: HS21OCT2014
[email protected]
2013 HEALTHY KIDS COLORADO SURVEY RESULTS Region 4 High School Summary Tables - Weighted Data Table 167. Percentage of students who think there are lots of chances to be a part of class discussions/ activities Total
Age
Grade
Race/Ethnicity
Male
Female
Percentage
95% confidence interval
Percentage
95% confidence interval
Percentage
95% confidence interval
Total
89.7
( 86.4 - 93.1 )
89.4
( 84.3 - 94.6 )
90.1
( 87.8 - 92.4 )
15 or younger
91.7
( 87.6 - 95.8 )
91.0
( 85.0 - 97.0 )
92.6
( 86.8 - 98.4 )
16 or 17
88.4
( 84.8 - 92.1 )
89.0
( 82.6 - 95.3 )
87.9
( 84.4 - 91.5 )
18 or older
86.2
( 77.0 - 95.4 )
.
.
.
.
9th
92.1
( 85.8 - 98.3 )
91.1
( 82.6 - 99.6 )
93.0
( 85.9 - 100.0 )
10th
90.7
( 88.2 - 93.1 )
90.2
( 86.9 - 93.5 )
91.2
( 88.3 - 94.1 )
11th
89.2
( 85.7 - 92.6 )
90.7
( 83.6 - 97.7 )
87.7
( 84.2 - 91.1 )
12th
88.2
( 83.2 - 93.2 )
87.5
( 78.2 - 96.9 )
88.9
( 83.3 - 94.4 )
American Indian/Alaska Native*
.
.
.
.
.
.
Asian*
.
.
.
.
.
.
Black/African American*
.
.
.
.
.
.
Native Hawaiian/Other Pacific Islander*
.
.
.
.
.
.
White*
91.4
( 86.9 - 95.9 )
91.0
( 84.7 - 97.3 )
91.8
( 88.2 - 95.4 )
White Hispanic
92.3
( 86.8 - 97.9 )
.
.
.
.
Other
87.4
( 79.9 - 94.9 )
85.1
( 77.8 - 92.3 )
91.3
( 84.0 - 98.6 )
*Non-Hispanic. . = Less than 50 students in the subgroup. Version: HS21OCT2014
[email protected]
2013 HEALTHY KIDS COLORADO SURVEY RESULTS Region 4 High School Summary Tables - Weighted Data Table 168. Percentage of students who feel safe at school Total
Age
Grade
Race/Ethnicity
Male
Female
Percentage
95% confidence interval
Percentage
95% confidence interval
Percentage
95% confidence interval
Total
92.9
( 89.9 - 96.0 )
91.8
( 85.9 - 97.7 )
94.2
( 92.8 - 95.7 )
15 or younger
91.8
( 88.0 - 95.5 )
90.6
( 83.9 - 97.2 )
93.4
( 88.0 - 98.8 )
16 or 17
94.3
( 90.0 - 98.6 )
93.5
( 87.0 - 99.9 )
95.1
( 92.2 - 98.0 )
18 or older
90.9
( 79.7 - 100.0 )
.
.
.
.
9th
92.2
( 86.3 - 98.0 )
91.4
( 81.5 - 100.0 )
93.0
( 87.0 - 99.0 )
10th
94.9
( 92.9 - 97.0 )
94.3
( 90.7 - 97.9 )
95.7
( 91.6 - 99.9 )
11th
93.8
( 90.7 - 97.0 )
93.2
( 88.6 - 97.8 )
94.5
( 91.9 - 97.1 )
12th
92.2
( 88.2 - 96.3 )
90.2
( 83.1 - 97.3 )
94.2
( 90.5 - 97.9 )
American Indian/Alaska Native*
.
.
.
.
.
.
Asian*
.
.
.
.
.
.
Black/African American*
.
.
.
.
.
.
Native Hawaiian/Other Pacific Islander*
.
.
.
.
.
.
White*
95.0
( 93.2 - 96.9 )
95.5
( 92.8 - 98.2 )
94.5
( 92.9 - 96.2 )
White Hispanic
95.9
( 92.1 - 99.7 )
.
.
.
.
Other
90.8
( 84.7 - 96.9 )
87.2
( 78.6 - 95.8 )
96.2
( 93.2 - 99.1 )
*Non-Hispanic. . = Less than 50 students in the subgroup. Version: HS21OCT2014
[email protected]
2013 HEALTHY KIDS COLORADO SURVEY RESULTS Region 4 High School Summary Tables - Weighted Data Table 169. Percentage of students who think it is important to finish high school Total
Age
Grade
Race/Ethnicity
Male
Female
Percentage
95% confidence interval
Percentage
95% confidence interval
Percentage
95% confidence interval
Total
96.6
( 95.5 - 97.8 )
96.8
( 94.4 - 99.2 )
96.5
( 94.8 - 98.2 )
15 or younger
95.5
( 93.8 - 97.2 )
95.8
( 92.0 - 99.6 )
95.4
( 91.0 - 99.8 )
16 or 17
97.9
( 96.3 - 99.5 )
98.3
( 96.6 - 100.0 )
97.5
( 95.1 - 99.9 )
18 or older
95.3
( 87.7 - 100.0 )
.
.
.
.
9th
96.3
( 93.8 - 98.8 )
97.5
( 94.4 - 100.0 )
95.1
( 89.6 - 100.0 )
10th
96.9
( 95.4 - 98.5 )
97.4
( 94.0 - 100.0 )
96.3
( 93.4 - 99.3 )
11th
96.8
( 94.4 - 99.3 )
96.9
( 92.9 - 100.0 )
96.8
( 92.8 - 100.0 )
12th
97.7
( 95.6 - 99.7 )
97.1
( 94.2 - 99.9 )
98.2
( 95.8 - 100.0 )
American Indian/Alaska Native*
.
.
.
.
.
.
Asian*
.
.
.
.
.
.
Black/African American*
.
.
.
.
.
.
Native Hawaiian/Other Pacific Islander*
.
.
.
.
.
.
White*
98.9
( 98.2 - 99.6 )
98.5
( 97.3 - 99.7 )
99.3
( 98.0 - 100.0 )
White Hispanic
96.7
( 93.0 - 100.0 )
.
.
.
.
Other
90.5
( 83.7 - 97.4 )
94.6
( 89.0 - 100.0 )
87.5
( 75.9 - 99.2 )
*Non-Hispanic. . = Less than 50 students in the subgroup. Version: HS21OCT2014
[email protected]
2013 HEALTHY KIDS COLORADO SURVEY RESULTS Region 4 High School Summary Tables - Weighted Data Table 170. Percentage of students who think it is important to go to college Total
Age
Grade
Race/Ethnicity
Male
Female
Percentage
95% confidence interval
Percentage
95% confidence interval
Percentage
95% confidence interval
Total
94.3
( 93.4 - 95.1 )
93.9
( 91.3 - 96.4 )
94.8
( 92.7 - 96.9 )
15 or younger
93.9
( 90.8 - 96.9 )
95.1
( 91.2 - 98.9 )
92.8
( 87.5 - 98.2 )
16 or 17
95.0
( 93.2 - 96.7 )
93.5
( 91.5 - 95.6 )
96.3
( 94.0 - 98.7 )
18 or older
92.2
( 85.9 - 98.5 )
.
.
.
.
9th
95.9
( 92.0 - 99.9 )
96.7
( 93.9 - 99.5 )
95.2
( 87.8 - 100.0 )
10th
95.0
( 93.5 - 96.5 )
96.6
( 92.9 - 100.0 )
93.1
( 91.3 - 94.8 )
11th
93.9
( 89.9 - 98.0 )
92.7
( 85.1 - 100.0 )
95.2
( 93.1 - 97.4 )
12th
93.4
( 90.6 - 96.1 )
90.7
( 86.2 - 95.2 )
95.9
( 92.3 - 99.6 )
American Indian/Alaska Native*
.
.
.
.
.
.
Asian*
.
.
.
.
.
.
Black/African American*
.
.
.
.
.
.
Native Hawaiian/Other Pacific Islander*
.
.
.
.
.
.
White*
95.9
( 94.9 - 96.9 )
96.9
( 95.5 - 98.2 )
94.9
( 92.8 - 97.0 )
White Hispanic
93.4
( 90.9 - 96.0 )
.
.
.
.
Other
86.1
( 78.2 - 94.0 )
86.6
( 79.5 - 93.6 )
86.9
( 75.0 - 98.7 )
*Non-Hispanic. . = Less than 50 students in the subgroup. Version: HS21OCT2014
[email protected]
2013 HEALTHY KIDS COLORADO SURVEY RESULTS Region 4 High School Summary Tables - Weighted Data Table 171. Percentage of students who think it is important to be successful in a job or career Total
Age
Grade
Race/Ethnicity
Male
Female
Percentage
95% confidence interval
Percentage
95% confidence interval
Percentage
95% confidence interval
Total
96.7
( 95.7 - 97.8 )
96.2
( 93.9 - 98.4 )
97.4
( 95.7 - 99.1 )
15 or younger
96.7
( 94.9 - 98.5 )
97.2
( 95.8 - 98.7 )
96.4
( 91.9 - 100.0 )
16 or 17
97.6
( 95.7 - 99.4 )
96.7
( 93.0 - 100.0 )
98.4
( 96.1 - 100.0 )
18 or older
91.7
( 84.2 - 99.1 )
.
.
.
.
9th
98.0
( 95.4 - 100.0 )
99.6
( 98.9 - 100.0 )
96.4
( 91.0 - 100.0 )
10th
97.3
( 95.6 - 99.1 )
97.1
( 93.5 - 100.0 )
97.6
( 94.4 - 100.0 )
11th
96.6
( 93.6 - 99.6 )
96.4
( 91.2 - 100.0 )
96.8
( 92.8 - 100.0 )
12th
96.2
( 94.2 - 98.2 )
93.1
( 90.0 - 96.1 )
99.2
( 97.8 - 100.0 )
American Indian/Alaska Native*
.
.
.
.
.
.
Asian*
.
.
.
.
.
.
Black/African American*
.
.
.
.
.
.
Native Hawaiian/Other Pacific Islander*
.
.
.
.
.
.
White*
98.9
( 97.6 - 100.0 )
97.8
( 95.6 - 100.0 )
100.0
( 100.0 - 100.0 )
White Hispanic
94.4
( 91.6 - 97.2 )
.
.
.
.
Other
91.4
( 85.1 - 97.6 )
94.7
( 90.0 - 99.4 )
89.1
( 78.5 - 99.6 )
*Non-Hispanic. . = Less than 50 students in the subgroup. Version: HS21OCT2014
[email protected]
2013 HEALTHY KIDS COLORADO SURVEY RESULTS Region 4 High School Summary Tables - Weighted Data Table 172. Percentage of students who feel the rules in their family are clear Total
Age
Grade
Race/Ethnicity
Male
Female
Percentage
95% confidence interval
Percentage
95% confidence interval
Percentage
95% confidence interval
Total
90.1
( 88.0 - 92.3 )
88.7
( 83.3 - 94.1 )
91.8
( 90.4 - 93.2 )
15 or younger
89.7
( 87.2 - 92.1 )
88.0
( 80.6 - 95.4 )
91.7
( 87.0 - 96.3 )
16 or 17
91.1
( 88.4 - 93.8 )
89.6
( 86.0 - 93.3 )
92.5
( 88.4 - 96.6 )
18 or older
87.0
( 79.0 - 95.0 )
.
.
.
.
9th
90.8
( 85.3 - 96.3 )
88.9
( 78.9 - 98.8 )
92.8
( 86.1 - 99.5 )
10th
90.6
( 86.4 - 94.7 )
90.2
( 82.9 - 97.4 )
91.1
( 88.3 - 93.8 )
11th
92.1
( 87.0 - 97.1 )
89.3
( 81.5 - 97.2 )
94.8
( 91.2 - 98.4 )
12th
88.5
( 83.5 - 93.5 )
88.3
( 78.4 - 98.1 )
88.8
( 81.3 - 96.4 )
American Indian/Alaska Native*
.
.
.
.
.
.
Asian*
.
.
.
.
.
.
Black/African American*
.
.
.
.
.
.
Native Hawaiian/Other Pacific Islander*
.
.
.
.
.
.
White*
91.5
( 88.8 - 94.2 )
91.2
( 86.9 - 95.5 )
91.8
( 89.0 - 94.6 )
White Hispanic
92.1
( 87.8 - 96.4 )
.
.
.
.
Other
86.4
( 79.6 - 93.2 )
87.9
( 78.4 - 97.4 )
86.0
( 79.4 - 92.6 )
*Non-Hispanic. . = Less than 50 students in the subgroup. Version: HS21OCT2014
[email protected]
2013 HEALTHY KIDS COLORADO SURVEY RESULTS Region 4 High School Summary Tables - Weighted Data Table 173. Percentage of students whose parents/guardians give lots of chances to do fun things with them Total
Age
Grade
Race/Ethnicity
Male
Female
Percentage
95% confidence interval
Percentage
95% confidence interval
Percentage
95% confidence interval
Total
79.8
( 78.5 - 81.1 )
79.6
( 75.4 - 83.8 )
80.0
( 77.7 - 82.4 )
15 or younger
80.5
( 79.0 - 82.0 )
81.8
( 78.3 - 85.3 )
79.3
( 74.0 - 84.6 )
16 or 17
79.0
( 77.1 - 80.8 )
77.2
( 70.9 - 83.5 )
80.8
( 76.7 - 84.8 )
18 or older
80.2
( 73.5 - 86.9 )
.
.
.
.
9th
80.9
( 74.9 - 86.9 )
79.8
( 68.8 - 90.7 )
82.1
( 75.8 - 88.5 )
10th
81.8
( 78.0 - 85.6 )
83.7
( 78.5 - 89.0 )
79.6
( 69.0 - 90.2 )
11th
78.9
( 74.0 - 83.9 )
76.0
( 68.0 - 84.0 )
81.9
( 70.8 - 93.0 )
12th
78.8
( 71.9 - 85.7 )
79.8
( 68.4 - 91.1 )
77.8
( 72.8 - 82.9 )
American Indian/Alaska Native*
.
.
.
.
.
.
Asian*
.
.
.
.
.
.
Black/African American*
.
.
.
.
.
.
Native Hawaiian/Other Pacific Islander*
.
.
.
.
.
.
White*
80.0
( 76.0 - 84.0 )
80.4
( 72.4 - 88.4 )
79.6
( 78.2 - 81.0 )
White Hispanic
88.4
( 82.2 - 94.6 )
.
.
.
.
Other
76.6
( 64.2 - 88.9 )
76.5
( 64.4 - 88.5 )
77.8
( 55.9 - 99.8 )
*Non-Hispanic. . = Less than 50 students in the subgroup. Version: HS21OCT2014
[email protected]
2013 HEALTHY KIDS COLORADO SURVEY RESULTS Region 4 High School Summary Tables - Weighted Data Table 174. Percentage of students whose parents consult them before making family decisions Total
Age
Grade
Race/Ethnicity
Male
Female
Percentage
95% confidence interval
Percentage
95% confidence interval
Percentage
95% confidence interval
Total
66.4
( 60.6 - 72.1 )
66.8
( 56.7 - 77.0 )
65.9
( 62.1 - 69.7 )
15 or younger
65.1
( 58.0 - 72.1 )
66.6
( 57.1 - 76.2 )
63.5
( 58.2 - 68.8 )
16 or 17
67.2
( 60.9 - 73.6 )
65.7
( 55.0 - 76.5 )
68.6
( 62.1 - 75.2 )
18 or older
68.2
( 62.8 - 73.6 )
.
.
.
.
9th
67.8
( 56.5 - 79.1 )
69.9
( 53.3 - 86.5 )
65.6
( 58.3 - 72.9 )
10th
65.6
( 61.7 - 69.5 )
64.7
( 55.6 - 73.8 )
66.6
( 61.9 - 71.3 )
11th
65.2
( 58.3 - 72.1 )
65.3
( 49.2 - 81.5 )
65.1
( 57.1 - 73.2 )
12th
69.0
( 62.9 - 75.1 )
71.1
( 61.0 - 81.2 )
66.9
( 61.7 - 72.0 )
American Indian/Alaska Native*
.
.
.
.
.
.
Asian*
.
.
.
.
.
.
Black/African American*
.
.
.
.
.
.
Native Hawaiian/Other Pacific Islander*
.
.
.
.
.
.
White*
70.4
( 62.4 - 78.4 )
72.9
( 61.3 - 84.4 )
67.7
( 62.6 - 72.8 )
White Hispanic
67.1
( 51.4 - 82.8 )
.
.
.
.
Other
44.7
( 29.2 - 60.3 )
45.1
( 23.9 - 66.2 )
45.0
( 26.7 - 63.3 )
*Non-Hispanic. . = Less than 50 students in the subgroup. Version: HS21OCT2014
[email protected]
2013 HEALTHY KIDS COLORADO SURVEY RESULTS Region 4 High School Summary Tables - Weighted Data Table 175. Percentage of students who could ask parents/guardians for help with a personal problem Total
Age
Grade
Race/Ethnicity
Male
Female
Percentage
95% confidence interval
Percentage
95% confidence interval
Percentage
95% confidence interval
Total
79.0
( 75.5 - 82.6 )
80.7
( 78.1 - 83.4 )
77.3
( 72.2 - 82.4 )
15 or younger
76.7
( 71.4 - 82.0 )
80.2
( 77.0 - 83.4 )
73.1
( 62.7 - 83.4 )
16 or 17
81.2
( 78.1 - 84.4 )
81.7
( 77.7 - 85.7 )
80.8
( 75.6 - 86.0 )
18 or older
78.7
( 71.5 - 85.9 )
.
.
.
.
9th
79.5
( 68.9 - 90.2 )
80.9
( 70.6 - 91.3 )
78.0
( 65.2 - 90.9 )
10th
77.8
( 71.9 - 83.7 )
80.9
( 72.0 - 89.8 )
74.2
( 67.1 - 81.2 )
11th
77.0
( 72.4 - 81.6 )
79.0
( 74.2 - 83.7 )
75.0
( 69.3 - 80.6 )
12th
82.8
( 78.4 - 87.2 )
84.3
( 78.5 - 90.1 )
81.3
( 77.5 - 85.2 )
American Indian/Alaska Native*
.
.
.
.
.
.
Asian*
.
.
.
.
.
.
Black/African American*
.
.
.
.
.
.
Native Hawaiian/Other Pacific Islander*
.
.
.
.
.
.
White*
83.1
( 78.7 - 87.4 )
84.5
( 80.3 - 88.8 )
81.5
( 75.3 - 87.8 )
White Hispanic
80.6
( 71.7 - 89.5 )
.
.
.
.
Other
66.1
( 54.2 - 77.9 )
63.1
( 51.1 - 75.0 )
70.4
( 46.1 - 94.8 )
*Non-Hispanic. . = Less than 50 students in the subgroup. Version: HS21OCT2014
[email protected]