June 25, 2015
ACTION
Removed from Asia Pacific Sell List City Developments (CTDM.SI) Equity Research
Risk/reward improves for Resi leader; upgrade to Neutral What happened
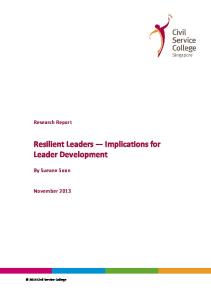
Investment Profile
We upgrade City Developments (CDL) to Neutral from Sell as we believe risk/reward for the stock has improved. Since adding Resi bellwether CDL to our Sell list on 30 Aug 2013, its share price has declined -2% vs. FSSTI index +11% & GS ASEAN Real Estate peers’ +9%. While the operating environment remains difficult for Resi developers, price elasticity has improved and we see pockets of demand returning to the market. More recently, commercial leasing has also surprised positively. We revise CDL’s NAV by +9% and FY16E/17E EPS by +2%/+8% on higher ASPs and rents for select assets. As a result, we raise CDL’s 12-m NAV-based target price to S$10.20 from S$9.36 (unchanged 30% discount).
Low
High
Growth
Growth
Returns *
Returns *
Multiple
Multiple
Volatility
Volatility 20th
Percentile
40th
60th
80th
100th
City Developments (CTDM.SI) Asia Pacific Property Peer Group Average * Returns = Return on Capital
For a complete description of the investment profile measures please refer to the disclosure section of this document.
Key data
Current view CDL’s share price is more susceptible vs. peers to a credit withdrawal cycle in Singapore given its leading Resi presence. While we think it is premature to call a turnaround in Resi with sales likely to remain below trend for the next 12-18 months, we see early signs of activity returning to the market which bode well for the Resi leader. CDL trades at 33% NAV discount (-1 S.D.: -37%), and 0.98x P/B (-1 S.D.), suggesting downside support. We are incrementally constructive based on: 1. Residential sales volumes have likely bottomed (4Q14 and 1Q15 were the slowest two quarters since 2008); CDL’s share price is well correlated to volumes. 2. Prices have held up for select CDL projects such as Coco Palms and Jewel @ Buangkok, 5%-10% above GSe. 3. S$2.8bn South Beach development is progressing well; 88% committed with Office rents of about S$10psf, slightly ahead of GSe. 4. Fresh focus on monetizing commercial assets, with an intention to build out its fund platform, which would support its NAV. 5. Home prices are 6% off the peak and the pace of decline remains modest (about 1% per qtr) and in a seemingly acceptable range, suggesting policy measures are unlikely to ease until 1Q16 at the earliest. We prefer CapitaLand (CATL.SI; Buy; S$3.46; trades at 39% NAV discount) among developers.
Current
Price (S$) 12 month price target (S$) Market cap (S$ mn / US$ mn) Foreign ownership (%)
EPS (S$) New EPS revision (%) EPS growth (%) EPS (dil) (S$) New P/E (X) P/B (X) EV/EBITDA (X) Dividend yield (%) ROE (%)
9.78 10.20 8,893.0 / 6,610.4 --
12/14 0.47 0.0 (17.8) 0.45 20.9 1.1 10.6 1.6 5.3
12/15E 0.64 0.0 34.0 0.61 15.4 1.0 11.1 1.8 6.7
12/16E 0.73 2.2 14.3 0.69 13.5 1.0 9.6 1.8 7.3
12/17E 0.77 8.3 5.6 0.73 12.8 0.9 8.5 1.8 7.3
Price performance chart 11.0 10.8 10.6 10.4 10.2 10.0 9.8 9.6 9.4 9.2 9.0 Jun-14
3,650 3,600 3,550 3,500 3,450 3,400 3,350 3,300 3,250 3,200 3,150 Sep-14 City Developments (L)
Jan-15
Apr-15 FTSE Straits Times Index (R)
Upside risks: Policy easing. Downside risks: Rising interest rates, FX risk. INVESTMENT LIST MEMBERSHIP Neutral
Share price performance (%) Absolute Rel. to FTSE Straits Times Index
3 month (4.0) (2.2)
6 month 12 month (4.5) (5.5) (4.6) (8.0)
Source: Company data, Goldman Sachs Research estimates, FactSet. Price as of 6/24/2015 close.
Coverage View: Neutral Paul Lian +65-6889-2464
[email protected] Goldman Sachs (Singapore) Pte Jason Yeo +65-6889-2485
[email protected] Goldman Sachs (Singapore) Pte Vincent Lim +65-6654-5433
[email protected] Goldman Sachs (Singapore) Pte
The Goldman Sachs Group, Inc.
Goldman Sachs does and seeks to do business with companies covered in its research reports. As a result, investors should be aware that the firm may have a conflict of interest that could affect the objectivity of this report. Investors should consider this report as only a single factor in making their investment decision. For Reg AC certification and other important disclosures, see the Disclosure Appendix, or go to www.gs.com/research/hedge.html. Analysts employed by nonUS affiliates are not registered/qualified as research analysts with FINRA in the U.S. Global Investment Research
June 25, 2015
City Developments (CTDM.SI)
City Developments: Summary Financials Profit model (S$ mn)
12/14
12/15E
12/16E
12/17E
Balance sheet (S$ mn)
12/14
12/15E
12/16E
12/17E
3,763.9 (2,131.6) (509.4) -11.8 1,334.8 (200.0) 1,134.8 -(131.0) 0.0 0.0 1,003.7 (95.1) (139.0)
3,619.2 (1,994.9) (579.1) -34.3 1,292.5 (212.9) 1,079.6 -(164.1) 0.0 0.0 915.5 (155.6) (181.9)
4,055.8 (2,201.8) (648.9) -4.2 1,423.2 (213.9) 1,209.2 -(170.8) 0.0 0.0 1,038.4 (176.5) (201.3)
4,334.4 (2,356.9) (693.5) -0.5 1,499.3 (214.9) 1,284.4 -(170.8) 0.0 0.0 1,113.6 (189.3) (227.0)
Cash & equivalents Accounts receivable Inventory Other current assets Total current assets Net PP&E Net intangibles Total investments Other long-term assets Total assets
3,897.6 1,588.6 4,804.1 39.1 10,329.3 8,027.4 0.0 1,204.9 138.8 19,700.5
3,649.6 1,983.1 4,625.1 39.1 10,296.9 8,213.7 0.0 1,456.2 238.8 20,205.6
4,397.2 2,222.3 3,986.1 39.1 10,644.8 8,330.1 0.0 1,654.1 338.8 20,967.7
5,479.4 2,375.0 3,111.9 39.1 11,005.4 8,453.9 0.0 1,829.2 438.8 21,727.4
769.6 0.0 769.6 (338.4) 431.2
578.0 0.0 578.0 0.0 578.0
660.6 0.0 660.6 0.0 660.6
697.3 0.0 697.3 0.0 697.3
1,463.0 2,232.9 261.4 3,957.3 4,466.2 501.4 4,967.6 8,924.9
1,487.4 2,232.9 261.4 3,981.6 4,466.2 501.4 4,967.6 8,949.2
1,666.7 2,232.9 261.4 4,161.0 4,466.2 501.4 4,967.6 9,128.6
1,781.3 2,232.9 261.4 4,275.6 4,466.2 501.4 4,967.6 9,243.2
0.85 0.47 0.45 0.16 33.7 (5.7)
0.64 0.64 0.61 0.18 28.3 4.3
0.73 0.73 0.69 0.18 24.8 11.9
0.77 0.77 0.73 0.18 23.5 14.5
Preferred shares Total common equity Minority interest Total liabilities & equity BVPS (S$) RNAV (S$ mn) RNAVPS (S$)
0.0 8,410.1 2,365.5 19,700.5 9.25 13,908.4 14.57
0.0 8,824.4 2,431.9 20,205.6 9.70 13,903.2 14.57
0.0 9,321.3 2,517.8 20,967.7 10.25 ---
0.0 9,854.9 2,629.3 21,727.4 10.84 ---
12/14 19.0 18.4 17.2 (17.8) (17.8) 43.4 35.5 30.1
12/15E (3.8) (3.2) (4.9) 34.0 34.0 44.9 35.7 29.8
12/16E 12.1 10.1 12.0 14.3 14.3 45.7 35.1 29.8
12/17E 6.9 5.4 6.2 5.6 5.6 45.6 34.6 29.6
Ratios ROE (%) ROA (%) ROACE (%) Inventory days Receivables days Payable days Net debt/equity (%) Interest cover - EBIT (X)
12/14 5.3 2.4 8.1 782.5 156.3 237.7 26.0 8.7
12/15E 6.7 2.9 6.4 862.6 180.1 269.9 27.1 6.6
12/16E 7.3 3.2 7.1 713.8 189.2 261.4 19.4 7.1
12/17E 7.3 3.3 7.7 549.6 193.6 267.0 9.8 7.5
Cash flow statement (S$ mn) Net income pre-preferred dividends D&A add-back Minorities interests add-back Net (inc)/dec working capital Other operating cash flow Cash flow from operations
12/14 769.6 200.0 139.0 154.7 (971.2) 292.2
12/15E 578.0 212.9 181.9 (191.2) 0.0 781.5
12/16E 660.6 213.9 201.3 579.2 0.0 1,655.0
12/17E 697.3 214.9 227.0 836.0 0.0 1,975.2
Valuation P/E basic (X) P/B (X) EV/EBITDA (X) Dividend yield (%)
12/14 20.9 1.1 10.6 1.6
12/15E 15.4 1.0 11.1 1.8
12/16E 13.5 1.0 9.6 1.8
12/17E 12.8 0.9 8.5 1.8
Capital expenditures Acquisitions Divestitures Others Cash flow from investments
(936.2) 0.0 924.0 (29.6) (41.8)
(300.0) (99.1) 0.0 (351.2) (750.4)
(300.0) (30.3) 0.0 (297.9) (628.2)
(300.0) (38.7) 0.0 (275.2) (613.9)
Underlying valuation Underlying profit (S$ mn) Underlying EPS (S$)
12/14 431.2 0.45
12/15E 578.0 0.61
12/16E 660.6 0.69
12/17E 697.3 0.73
Dividends paid (common & pref) Inc/(dec) in debt Common stock issuance (repurchase) Other financing cash flows Cash flow from financing Total cash flow
(274.8) 711.2 0.0 302.3 738.7 989.0
(279.1) 0.0 0.0 0.0 (279.1) (248.0)
(279.1) 0.0 0.0 0.0 (279.1) 747.6
(279.1) 0.0 0.0 0.0 (279.1) 1,082.2
Underlying ROE (%) Underlying ROA (%) Underlying ROACE (%) Underlying P/E (X) Underlying dividend payout (%) Underlying EPS growth (%)
5.3 2.4 5.4 21.9 35.4 (17.8)
6.7 2.9 6.4 16.1 29.7 34.0
7.3 3.2 7.1 14.1 26.0 14.3
7.3 3.3 7.7 13.4 24.6 5.6
Total revenue Cost of goods sold SG&A R&D Other operating profit/(expense) EBITDA Depreciation & amortization EBIT Interest income Interest expense Income/(loss) from uncons. subs. Others Pretax profits Income tax Minorities Net income pre-preferred dividends Preferred dividends Net income (pre-exceptionals) Post-tax exceptionals Net income EPS (basic, pre-except) (S$) EPS (basic, post-except) (S$) EPS (diluted, post-except) (S$) DPS (S$) Dividend payout ratio (%) Free cash flow yield (%) Growth & margins (%) Sales growth EBITDA growth EBIT growth Net income growth EPS growth Gross margin EBITDA margin EBIT margin
Accounts payable Short-term loans Other current liabilities Total current liabilities Long-term debt Other long-term liabilities Total long-term liabilities Total liabilities
Note: Last actual year may include reported and estimated data. Source: Company data, Goldman Sachs Research estimates.
Analyst Contributors Paul Lian
[email protected] Jason Yeo
[email protected] Vincent Lim
[email protected]
Goldman Sachs Global Investment Research
2
June 25, 2015
City Developments (CTDM.SI)
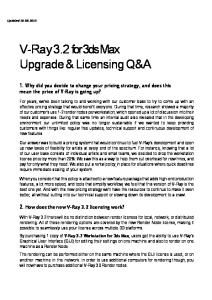
Exhibit 1: City Dev home sales well correlated with home sales volumes, which have likely bottomed out
Exhibit 2: The pace of decline in transaction volumes has eased
City Dev share price vs. Singapore total home sales volume
Singapore total home sales volume and yoy change
City Dev share price (S$)
Total home sales (units) Total home sales (RHS)
City Dev share price (LHS)
20.00 18.00
Total home sales (LHS)
YoY change (%)
YoY change (RHS)
400%
14,000
350%
12,000
300%
12,000
10,000
250%
10,000
8,000
200%
6,000
150%
4,000
100%
2,000
50%
16,000 Correlation: 0.68 R-square: 0.46
Total home sales (units) 16,000
14,000
16.00 14.00 12.00 10.00
8,000
8.00
6,000
6.00 4,000
0
2,000
-2,000
-50%
-4,000
-100%
0%
2.00 Transaction volumes at a trough
1Q2000 3Q2000 1Q2001 3Q2001 1Q2002 3Q2002 1Q2003 3Q2003 1Q2004 3Q2004 1Q2005 3Q2005 1Q2006 3Q2006 1Q2007 3Q2007 1Q2008 3Q2008 1Q2009 3Q2009 1Q2010 3Q2010 1Q2011 3Q2011 1Q2012 3Q2012 1Q2013 3Q2013 1Q2014 3Q2014 1Q2015 2Q2015E
4.00
0
Mar-15
Jan-14
Aug-14
Jun-13
Apr-12
Nov-12
Sep-11
Jul-10
Feb-11
Dec-09
Oct-08
May-09
Mar-08
Jan-07
Aug-07
Apr-05
Jun-06
Nov-05
Sep-04
Jul-03
Feb-04
Dec-02
Oct-01
May-02
Mar-01
Jan-00
Aug-00
0.00
Source: Datastream, URA, Goldman Sachs Global Investment Research.
Source: URA, Goldman Sachs Global Investment Research.
Exhibit 3: Pricing at some of City Dev’s projects, such as Coco Palms, has held up better than we expected
Exhibit 4: 12m NAV-based target price of S$10.20 (30% NAV discount) implies 4% potential upside
Coco Palms transaction unit prices (S$ psf)
12m NAV-based target price breakdown
Unit price (S$ psf)
RNAV Calculation
Coco Palms
Forward (Dec 2015) S$m S$/share %
1,300
Singapore Investments Office Retail Hospitality Industrial & Others Overseas Investments Office Retail Hospitality Mixed & Others Singapore Residential Prime segment Mid & Mass market Overseas Residential Listed Investments
1,200
1,100
1,000 GSe: S$965psf 900
800
700
600 Apr-14
Jun-14
Jul-14
Sep-14
Nov-14
Dec-14
Feb-15
Apr-15
May-15
Gross Asset Value Net Debt RNAV Price Target @ 30% disc to NAV
Jul-15
7,355 4,543 1,949 696 167 590 192 140 39 220 4,934 2,463 2,471 1,508 2,394
7.71 4.76 2.04 0.73 0.17 0.62 0.20 0.15 0.04 0.23 5.17 2.58 2.59 1.58 2.51
16,780 2,877 13,903
17.58 3.01 14.57 10.20
44% 27% 12% 4% 1% 4% 1% 1% 0% 1% 29% 15% 15% 9% 14% 100%
Source: REALIS, Goldman Sachs Global Investment Research.
Source: Company data, Goldman Sachs Global Investment Research.
Exhibit 5: City Dev trades at 33% NAV discount
Exhibit 6: City Dev trades at -1 S.D. P/B
City Dev NAV premium/discount
City Dev forward P/B
City Dev Disc/Prem to NAV (%) 40%
City Dev Price to Book (x) 4.5 4.0
20%
3.5 3.0
0% +1 SD, -10%
+1 SD, 2.41
2.5 -20%
Mean, -24%
2.0
Mean, 1.74
-32.9% -40%
-1 SD, -37%
1.5
0.98x
1.0
-1 SD, 1.06
-60%
0.5
Goldman Sachs Global Investment Research
Jan-15
Jan-14
Jan-13
Jan-12
Jan-11
Jan-10
Jan-09
Jan-08
Jan-07
Jan-06
Jan-05
Jan-04
Jan-03
Jan-02
Jan-01
Jan-00
Jan-99
Jan-98
Jan-97
Jan-96
Jan-95
Jan-94
Jan-93
Jan-92
Jan-91
Jan-96 Jul-96 Jan-97 Jul-97 Jan-98 Jul-98 Jan-99 Jul-99 Jan-00 Jul-00 Jan-01 Jul-01 Jan-02 Jul-02 Jan-03 Jul-03 Jan-04 Jul-04 Jan-05 Jul-05 Jan-06 Jul-06 Jan-07 Jul-07 Jan-08 Jul-08 Jan-09 Jul-09 Jan-10 Jul-10 Jan-11 Jul-11 Jan-12 Jul-12 Jan-13 Jul-13 Jan-14 Jul-14 Jan-15
Source: Datastream, Company data, Goldman Sachs Global Investment Research.
Jan-90
0.0
-80%
Source: Datastream, Company data, Goldman Sachs Global Investment Research.
3
June 25, 2015
City Developments (CTDM.SI)
Disclosure Appendix Reg AC I, Paul Lian, hereby certify that all of the views expressed in this report accurately reflect my personal views about the subject company or companies and its or their securities. I also certify that no part of my compensation was, is or will be, directly or indirectly, related to the specific recommendations or views expressed in this report. Unless otherwise stated, the individuals listed on the cover page of this report are analysts in Goldman Sachs' Global Investment Research division.
Investment Profile The Goldman Sachs Investment Profile provides investment context for a security by comparing key attributes of that security to its peer group and market. The four key attributes depicted are: growth, returns, multiple and volatility. Growth, returns and multiple are indexed based on composites of several methodologies to determine the stocks percentile ranking within the region's coverage universe. The precise calculation of each metric may vary depending on the fiscal year, industry and region but the standard approach is as follows: Growth is a composite of next year's estimate over current year's estimate, e.g. EPS, EBITDA, Revenue. Return is a year one prospective aggregate of various return on capital measures, e.g. CROCI, ROACE, and ROE. Multiple is a composite of one-year forward valuation ratios, e.g. P/E, dividend yield, EV/FCF, EV/EBITDA, EV/DACF, Price/Book. Volatility is measured as trailing twelve-month volatility adjusted for dividends.
Quantum Quantum is Goldman Sachs' proprietary database providing access to detailed financial statement histories, forecasts and ratios. It can be used for in-depth analysis of a single company, or to make comparisons between companies in different sectors and markets.
GS SUSTAIN GS SUSTAIN is a global investment strategy aimed at long-term, long-only performance with a low turnover of ideas. The GS SUSTAIN focus list includes leaders our analysis shows to be well positioned to deliver long term outperformance through sustained competitive advantage and superior returns on capital relative to their global industry peers. Leaders are identified based on quantifiable analysis of three aspects of corporate performance: cash return on cash invested, industry positioning and management quality (the effectiveness of companies' management of the environmental, social and governance issues facing their industry).
Disclosures Coverage group(s) of stocks by primary analyst(s) Paul Lian: ASEAN, Singapore Property/Diversified. ASEAN: Alliance Global Group, Astra Agro Lestari, Astra International, Ayala Corp., Bangkok Chain Hospital, Bangkok Dusit Medical Services, Bloomberry Resorts Corp., Bumitama Agri, Bumrungrad Hospital, First Resources, Genting, Genting Malaysia Bhd, Genting Singapore Plc, Golden Agri-Resources Ltd., IHH Healthcare Bhd, Indofood Agri Resources, IOI Corp., Jardine Cycle & Carriage, Keppel Corp., KPJ Healthcare Bhd, Kuala Lumpur Kepong, Lafarge Malaysia Bhd, Manila Water Co. Inc., Nagacorp Ltd., Noble Group, Olam International, PT Indocement Tunggal Prakarsa Tbk, PT Jasa Marga (Persero) Tbk, PT United Tractors, Raffles Medical, Sembcorp Industries, Sembcorp Marine, Semen Indonesia Persero Tbk, Siam Cement PCL, Siam City Cement Public Co., Siam City Cement Public Co. (Foreign), Siloam International Hospitals, Sime Darby Bhd, UMW Oil & Gas Corp. Bhd, Westports Holdings, Wilmar International, Yangzijiang Shipbuilding. Singapore Property/Diversified: Ascendas Real Estate Inv. Trust, Ayala Land Inc., CapitaLand, CapitaLand Commercial Trust, CapitaLand Mall Trust, City Developments, Far East Hospitality Trust, Global Logistic Properties, Keppel DC REIT, Keppel REIT, Mapletree Commercial Trust, Mapletree Industrial Trust, OUE Hospitality Trust, Overseas Union Enterprise, Suntec REIT, UOL Group, Wing Tai Holdings.
Company-specific regulatory disclosures The following disclosures relate to relationships between The Goldman Sachs Group, Inc. (with its affiliates, "Goldman Sachs") and companies covered by the Global Investment Research Division of Goldman Sachs and referred to in this research. Goldman Sachs expects to receive or intends to seek compensation for investment banking services in the next 3 months: City Developments (S$9.78) Goldman Sachs had an investment banking services client relationship during the past 12 months with: City Developments (S$9.78) Goldman Sachs had a non-securities services client relationship during the past 12 months with: City Developments (S$9.78)
Distribution of ratings/investment banking relationships Goldman Sachs Investment Research global coverage universe Rating Distribution
Buy
Hold
Investment Banking Relationships
Sell
Buy
Hold
Sell
Global 32% 54% 14% 46% 37% 32% As of April 1, 2015, Goldman Sachs Global Investment Research had investment ratings on 3,356 equity securities. Goldman Sachs assigns stocks as Buys and Sells on various regional Investment Lists; stocks not so assigned are deemed Neutral. Such assignments equate to Buy, Hold and Sell for the purposes of the above disclosure required by NASD/NYSE rules. See 'Ratings, Coverage groups and views and related definitions' below.
Goldman Sachs Global Investment Research
4
June 25, 2015
City Developments (CTDM.SI)
Price target and rating history chart(s) Stock Price Currency : Singapore Dollar
City De ve lopm ents (CTDM.SI)
Goldman Sachs rating and stock price target history 14.00 13.00 12.00
8.96 11.3
10.6
3,600
9.09
3,400
9.02
3,200
11.00 3,000
9.00 Stock Price
8.00
11.1
11.8 9.36
2,800 2,600
Aug 29 N S M J J A S O N D J F MA M J J A S O N D J F M A M J J A S O N D J F M 2012 2013 2014 2015
Index Price
10.00
Source: Goldman Sachs Investment Research for ratings and price targets; FactSet closing prices as of 3/31/2015. Rating Covered by Paul Lian Price target Price target at removal
Not covered by current analyst
FTSE Straits Times Index The price targets show n should be considered in the context of all prior published Goldman Sachs research, w hich may or may not have included price targets, as w ell as developments relating to the company, its industry and f inancial markets.
Regulatory disclosures Disclosures required by United States laws and regulations See company-specific regulatory disclosures above for any of the following disclosures required as to companies referred to in this report: manager or co-manager in a pending transaction; 1% or other ownership; compensation for certain services; types of client relationships; managed/comanaged public offerings in prior periods; directorships; for equity securities, market making and/or specialist role. Goldman Sachs usually makes a market in fixed income securities of issuers discussed in this report and usually deals as a principal in these securities. The following are additional required disclosures: Ownership and material conflicts of interest: Goldman Sachs policy prohibits its analysts, professionals reporting to analysts and members of their households from owning securities of any company in the analyst's area of coverage. Analyst compensation: Analysts are paid in part based on the profitability of Goldman Sachs, which includes investment banking revenues. Analyst as officer or director: Goldman Sachs policy prohibits its analysts, persons reporting to analysts or members of their households from serving as an officer, director, advisory board member or employee of any company in the analyst's area of coverage. Non-U.S. Analysts: Non-U.S. analysts may not be associated persons of Goldman, Sachs & Co. and therefore may not be subject to NASD Rule 2711/NYSE Rules 472 restrictions on communications with subject company, public appearances and trading securities held by the analysts. Distribution of ratings: See the distribution of ratings disclosure above. Price chart: See the price chart, with changes of ratings and price targets in prior periods, above, or, if electronic format or if with respect to multiple companies which are the subject of this report, on the Goldman Sachs website at http://www.gs.com/research/hedge.html.
Additional disclosures required under the laws and regulations of jurisdictions other than the United States The following disclosures are those required by the jurisdiction indicated, except to the extent already made above pursuant to United States laws and regulations. Australia: Goldman Sachs Australia Pty Ltd and its affiliates are not authorised deposit-taking institutions (as that term is defined in the Banking Act 1959 (Cth)) in Australia and do not provide banking services, nor carry on a banking business, in Australia. This research, and any access to it, is intended only for "wholesale clients" within the meaning of the Australian Corporations Act, unless otherwise agreed by Goldman Sachs. In producing research reports, members of the Global Investment Research Division of Goldman Sachs Australia may attend site visits and other meetings hosted by the issuers the subject of its research reports. In some instances the costs of such site visits or meetings may be met in part or in whole by the issuers concerned if Goldman Sachs Australia considers it is appropriate and reasonable in the specific circumstances relating to the site visit or meeting. Brazil: Disclosure information in relation to CVM Instruction 483 is available at http://www.gs.com/worldwide/brazil/area/gir/index.html. Where applicable, the Brazil-registered analyst primarily responsible for the content of this research report, as defined in Article 16 of CVM Instruction 483, is the first author named at the beginning of this report, unless indicated otherwise at the end of the text. Canada: Goldman Sachs Canada Inc. is an affiliate of The Goldman Sachs Group Inc. and therefore is included in the company specific disclosures relating to Goldman Sachs (as defined above). Goldman Sachs Canada Inc. has approved of, and agreed to take responsibility for, this research report in Canada if and to the extent that Goldman Sachs Canada Inc. disseminates this research report to its clients. Hong Kong: Further information on the securities of covered companies referred to in this research may be obtained on request from Goldman Sachs (Asia) L.L.C. India: Further information on the subject company or companies referred to in this research may be obtained from Goldman Sachs (India) Securities Private Limited. Goldman Sachs may beneficially own 1% or more of the securities (as such term is defined in clause 2 (h) the Indian Securities Contracts (Regulation) Act, 1956) of the subject company or companies referred to in this research report. Japan: See below. Korea: Further information on the subject company or companies referred to in this research may be obtained from Goldman Sachs (Asia) L.L.C., Seoul Branch. New Zealand: Goldman Sachs New Zealand Limited and its affiliates are neither "registered banks" nor "deposit takers" (as defined in the Reserve Bank of New Zealand Act 1989) in New Zealand. This research, and any access to it, is intended for "wholesale clients" (as defined in the Financial Advisers Act 2008) unless otherwise agreed by Goldman Sachs. Russia: Research reports distributed in the Russian Federation are not advertising as defined in the Russian legislation, but are information and analysis not having product promotion as their main purpose and do not provide appraisal within the meaning of the Russian legislation on appraisal activity. Singapore: Further information on the covered companies referred to in this research may be obtained from Goldman Sachs (Singapore) Pte. (Company Number: 198602165W). Taiwan: This material is for reference only and must not be reprinted without permission. Investors should carefully consider their own investment risk. Investment results are the responsibility of the individual investor. United Kingdom: Persons who would be categorized as retail clients in the United Kingdom, as such term is defined in the rules of the Financial Conduct Authority, should read this research in conjunction with prior Goldman Sachs research on the covered companies referred to herein and should refer to the risk warnings that have been sent to them by Goldman Sachs International. A copy of these risks warnings, and a glossary of certain financial terms used in this report, are available from Goldman Sachs International on request. European Union: Disclosure information in relation to Article 4 (1) (d) and Article 6 (2) of the European Commission Directive 2003/126/EC is available at http://www.gs.com/disclosures/europeanpolicy.html which states the European Policy for Managing Conflicts of Interest in Connection with Investment Research. Japan: Goldman Sachs Japan Co., Ltd. is a Financial Instrument Dealer registered with the Kanto Financial Bureau under registration number Kinsho 69, and a member of Japan Securities Dealers Association, Financial Futures Association of Japan and Type II Financial Instruments Firms Association. Sales and purchase of equities are subject to commission pre-determined with clients plus consumption tax. See company-specific
Goldman Sachs Global Investment Research
5
June 25, 2015
City Developments (CTDM.SI)
disclosures as to any applicable disclosures required by Japanese stock exchanges, the Japanese Securities Dealers Association or the Japanese Securities Finance Company.
Ratings, coverage groups and views and related definitions Buy (B), Neutral (N), Sell (S) -Analysts recommend stocks as Buys or Sells for inclusion on various regional Investment Lists. Being assigned a Buy
or Sell on an Investment List is determined by a stock's return potential relative to its coverage group as described below. Any stock not assigned as a Buy or a Sell on an Investment List is deemed Neutral. Each regional Investment Review Committee manages various regional Investment Lists to a global guideline of 25%-35% of stocks as Buy and 10%-15% of stocks as Sell; however, the distribution of Buys and Sells in any particular coverage group may vary as determined by the regional Investment Review Committee. Regional Conviction Buy and Sell lists represent investment recommendations focused on either the size of the potential return or the likelihood of the realization of the return. Return potential represents the price differential between the current share price and the price target expected during the time horizon associated with the price target. Price targets are required for all covered stocks. The return potential, price target and associated time horizon are stated in each report adding or reiterating an Investment List membership. Coverage groups and views: A list of all stocks in each coverage group is available by primary analyst, stock and coverage group at http://www.gs.com/research/hedge.html. The analyst assigns one of the following coverage views which represents the analyst's investment outlook on the coverage group relative to the group's historical fundamentals and/or valuation. Attractive (A). The investment outlook over the following 12 months is favorable relative to the coverage group's historical fundamentals and/or valuation. Neutral (N). The investment outlook over the following 12 months is neutral relative to the coverage group's historical fundamentals and/or valuation. Cautious (C). The investment outlook over the following 12 months is unfavorable relative to the coverage group's historical fundamentals and/or valuation. Not Rated (NR). The investment rating and target price have been removed pursuant to Goldman Sachs policy when Goldman Sachs is acting in an advisory capacity in a merger or strategic transaction involving this company and in certain other circumstances. Rating Suspended (RS). Goldman
Sachs Research has suspended the investment rating and price target for this stock, because there is not a sufficient fundamental basis for determining, or there are legal, regulatory or policy constraints around publishing, an investment rating or target. The previous investment rating and price target, if any, are no longer in effect for this stock and should not be relied upon. Coverage Suspended (CS). Goldman Sachs has suspended coverage of this company. Not Covered (NC). Goldman Sachs does not cover this company. Not Available or Not Applicable (NA). The information is not available for display or is not applicable. Not Meaningful (NM). The information is not meaningful and is therefore excluded.
Global product; distributing entities The Global Investment Research Division of Goldman Sachs produces and distributes research products for clients of Goldman Sachs on a global basis. Analysts based in Goldman Sachs offices around the world produce equity research on industries and companies, and research on macroeconomics, currencies, commodities and portfolio strategy. This research is disseminated in Australia by Goldman Sachs Australia Pty Ltd (ABN 21 006 797 897); in Brazil by Goldman Sachs do Brasil Corretora de Títulos e Valores Mobiliários S.A.; in Canada by either Goldman Sachs Canada Inc. or Goldman, Sachs & Co.; in Hong Kong by Goldman Sachs (Asia) L.L.C.; in India by Goldman Sachs (India) Securities Private Ltd.; in Japan by Goldman Sachs Japan Co., Ltd.; in the Republic of Korea by Goldman Sachs (Asia) L.L.C., Seoul Branch; in New Zealand by Goldman Sachs New Zealand Limited; in Russia by OOO Goldman Sachs; in Singapore by Goldman Sachs (Singapore) Pte. (Company Number: 198602165W); and in the United States of America by Goldman, Sachs & Co. Goldman Sachs International has approved this research in connection with its distribution in the United Kingdom and European Union. European Union: Goldman Sachs International authorised by the Prudential Regulation Authority and regulated by the Financial Conduct Authority
and the Prudential Regulation Authority, has approved this research in connection with its distribution in the European Union and United Kingdom; Goldman Sachs AG and Goldman Sachs International Zweigniederlassung Frankfurt, regulated by the Bundesanstalt für Finanzdienstleistungsaufsicht, may also distribute research in Germany.
General disclosures This research is for our clients only. Other than disclosures relating to Goldman Sachs, this research is based on current public information that we consider reliable, but we do not represent it is accurate or complete, and it should not be relied on as such. We seek to update our research as appropriate, but various regulations may prevent us from doing so. Other than certain industry reports published on a periodic basis, the large majority of reports are published at irregular intervals as appropriate in the analyst's judgment. Goldman Sachs conducts a global full-service, integrated investment banking, investment management, and brokerage business. We have investment banking and other business relationships with a substantial percentage of the companies covered by our Global Investment Research Division. Goldman, Sachs & Co., the United States broker dealer, is a member of SIPC (http://www.sipc.org). Our salespeople, traders, and other professionals may provide oral or written market commentary or trading strategies to our clients and our proprietary trading desks that reflect opinions that are contrary to the opinions expressed in this research. Our asset management area, our proprietary trading desks and investing businesses may make investment decisions that are inconsistent with the recommendations or views expressed in this research. The analysts named in this report may have from time to time discussed with our clients, including Goldman Sachs salespersons and traders, or may discuss in this report, trading strategies that reference catalysts or events that may have a near-term impact on the market price of the equity securities discussed in this report, which impact may be directionally counter to the analyst's published price target expectations for such stocks. Any such trading strategies are distinct from and do not affect the analyst's fundamental equity rating for such stocks, which rating reflects a stock's return potential relative to its coverage group as described herein. We and our affiliates, officers, directors, and employees, excluding equity and credit analysts, will from time to time have long or short positions in, act as principal in, and buy or sell, the securities or derivatives, if any, referred to in this research. The views attributed to third party presenters at Goldman Sachs arranged conferences, including individuals from other parts of Goldman Sachs, do not necessarily reflect those of Global Investment Research and are not an official view of Goldman Sachs. Any third party referenced herein, including any salespeople, traders and other professionals or members of their household, may have positions in the products mentioned that are inconsistent with the views expressed by analysts named in this report. This research is not an offer to sell or the solicitation of an offer to buy any security in any jurisdiction where such an offer or solicitation would be illegal. It does not constitute a personal recommendation or take into account the particular investment objectives, financial situations, or needs of individual clients. Clients should consider whether any advice or recommendation in this research is suitable for their particular circumstances and, if appropriate, seek professional advice, including tax advice. The price and value of investments referred to in this research and the income from them may fluctuate. Past performance is not a guide to future performance, future returns are not guaranteed, and a loss of original capital may occur. Fluctuations in exchange rates could have adverse effects on the value or price of, or income derived from, certain investments. Goldman Sachs Global Investment Research
6
June 25, 2015
City Developments (CTDM.SI)
Certain transactions, including those involving futures, options, and other derivatives, give rise to substantial risk and are not suitable for all investors. Investors should review current options disclosure documents which are available from Goldman Sachs sales representatives or at http://www.theocc.com/about/publications/character-risks.jsp. Transaction costs may be significant in option strategies calling for multiple purchase and sales of options such as spreads. Supporting documentation will be supplied upon request. All research reports are disseminated and available to all clients simultaneously through electronic publication to our internal client websites. Not all research content is redistributed to our clients or available to third-party aggregators, nor is Goldman Sachs responsible for the redistribution of our research by third party aggregators. For research, models or other data available on a particular security, please contact your sales representative or go to http://360.gs.com. Disclosure information is also available at http://www.gs.com/research/hedge.html or from Research Compliance, 200 West Street, New York, NY 10282. © 2015 Goldman Sachs. No part of this material may be (i) copied, photocopied or duplicated in any form by any means or (ii) redistributed without the prior written consent of The Goldman Sachs Group, Inc.
Goldman Sachs Global Investment Research
7