INTERNATIONAL JOURNAL OF AGRICULTURE & BIOLOGY 1560–8530/2004/06–6–1143–1152 http://www.ijab.org
Salt-induced Injury Symptom, Changes in Nutrient and Pigment Composition, and Yield Characteristics of Mungbean ABDUL WAHID1, MANSOOR HAMEED AND EJAZ RASUL Department of Botany, University of Agriculture, Faisalabad–38040, Pakistan Corresponding author’s email:
[email protected]
1
ABSTRACT Influence of NaCl salinity was studied on four mungbean [Vigna radiata (L.) Wilczek] genotypes to decipher the changes in visual signs of salt damage, growth and seed yield, mineral nutrient and pigment composition at early vegetative (EVS), late vegetative (LVS) and reproductive (RS) stages of growth. Although the genotypes exhibited sensitivity to salinity at all stages, salt tolerance (mM50; NaCl level in mmol L-1 at which growth or yield reduces to 50%) ranged from <39 (NM-98) to >51 (NM-54). Most salt tolerant genotype (NM-54) displayed reduced tip burning, low chlorosis and necrosis of young leaflets (two top trifoliate leaves) increased total plant dry mass, greater number and area of green leaves, and seed yield per plant. Tissue analysis revealed that Na+ and Cl- content of young leaflets was lowest in NM-54, while highest in NM-98 (Na+) and NM-92 (Cl-). However, old leaflets (two bottom green leaves) were indiscriminately affected. Enhanced chlorosis and necrosis of leaves were directly related to increased ionic content of leaves. Although the levels of leaf N, P, K+ and Ca2+ were reduced due to salinity, marked genotypic differences were evident. NM-54 excelled the other genotypes in greater nutrients content of young leaflets at all stages. Chlorophyll (Chl)-a, -b and carotenoid (Car) content decreased due to salinity in young and old leaflets at all stages. NM-54 followed by NM-89 showed lowest reduction in the pigment content of young leaflets. Chl-a:b ratio of young leaflets increased in the sensitive genotypes but remained steady in the tolerants. Enhanced chlorosis and necrosis of leaflets were ascribed to excess-ion induced loss of chlorophyll and mineral nutrient deficiency. Although iontoxicity is a noxious factor, greater nutrient and pigment contents of young leaves is crucial for better growth and improved salt tolerance of genotypes. Reduced chlorosis and necrosis of leaves can be taken as important visual criteria of salt tolerance at all stages. Key Words: Carotenoid; Chl-b; Growth; Ion-toxicity; Nutrients; Visual symptoms; Mungbean
INTRODUCTION Increased soil salinity is one amongst the many devastating environmental adversaries that has multifarious effects on plant growth and development (Shannon, 1977; Flowers, 2004). Manifestation of enhanced salt tolerance by any species is important at any stage, but is more meaningful at critical stages. For example, salinity applied at initial stages impairs the speed of germination, seedling growth and final crop stand in the field (Bayuelo-Jimenez et al., 2002; Murillo-Amamdor et al., 2002a), while at seed/grain filling it determines the economic yield. Plants challenged with salinity display many visual signs of salt injury. Qualitative effects are symptomatic i.e. stunted growth (Srivastave & Jana, 1984), chlorosis of green parts (James, 1988; Pentalone et al., 1997; Husain et al., 2003), leaf tip burning (Wahid et al., 1999b), scorch (Barroso & Alvarez, 1997) and necrosis of leaves (Volkumar et al., 1998; Chen et al., 2003). Quantitative ones include reductions in dry mass, elongation and expansion growth of leaves (Neumann et al., 1988), tissue ionic and nutrient contents (Misra et al., 2001) etc. Suppression in growth is usually ascribed to a reduced capacity of the green parts to photosynthesize under salinity (Morant-Manceau et
al., 2004), which, in addition to other factors, is more related to increased chlorophyll fluorescence (Murillo-Amamdor et al., 2002b) and changes in overall chlorophyll content (Zayed & Zeid 1997; Husain et al., 2003). Appraisal of morphological and physiological criteria of salinity tolerance has proven beneficial in increasing our understanding of salt tolerance in many plant species (Wahid et al., 1999b; Murillo-Amamdor et al., 2002a; Morant-Manceau et al., 2004). Legumes are important agricultural plants and entail one of the rich sources of proteins. Efforts to understand the salinity tolerance mechanisms of leguminous species have revealed that toxic ions are the main reason for reduced growth. Salt tolerance is achieved by the acquisition of succulence and selective transfer of K+ to young parts in lupin (Jeschke et al., 1986) and mungbean (Zayed & Zeid, 1997), enhanced Na+ removal from the xylem stream in soybean (Lacan & Durand, 1995), restricted Na+ uptake into the shoot, maintenance of high K+:Na+ ratio in clover shoot (Shannon & Nobel, 1995) and high photosynthetic rate in cowpea (Plaut et al., 1994). Mungbean [Vigna radiata (L.) Wilzeck] is one among the widely used protein sources. It shows suppressed growth even in marginally saline areas and most cultivars exhibit a
WAHID et al. / Int. J. Agric. Biol., Vol. 6, No. 6, 2004 salt tolerance threshold to <2 dS m-1 (Minhas et al., 1990). Mungbean shows completely inhibited seed germination in NaCl solution with osmotic potential of -1.5 MPa (Goertz & Coons, 1991; Wahid et al., 1999a; Murillo-Amamdor et al., 2002b). Failure to maintain pressure potential (Neumann et al. 1988; Misra et al., 2001) and reductions in chlorophyll and nutrient content of leaves (Zayed & Zeid, 1997; Misra et al., 2001) are important factors that render it salt-sensitive. In this study four newly evolved mungbean genotypes were investigated with the objective to determine their salt tolerance potential and the mechanism(s) involved. Yardsticks of these determinations were visual symptoms like chlorosis, necrosis and tip burning of trifoliate young and old leaves, changes in vegetative and reproductive growth, quantification of the levels of mineral elements and photosynthetic pigments at three phenological stages, and pod and seed yield at maturity. Such a study was imperative in view of the dearth of such information on most legume species.
MATERIALS AND METHODS Plant material and growth conditions. Selected healthy mungbean seeds surface sterilized with 0.1% (w/v) HgCl2 (for 3 minutes followed by four repeated washing with sterilized distilled water) were directly sown in pots (30 cm x 15 cm) lined with double layer of polythene sheets, filled with 10 kg of sandy loam, soil and kept in a greenhouse. The experimental design was completely randomized with three replications. After germination and thinning, five plants of uniform size were maintained in each pot. Salt (NaCl) solution was gradually added to the pots @ 20 mmol NaCl L-1 per day to achieve 40, 80, and 120 mmol L-1 levels, based on full field capacity of soil, and a control (no salt added) at early vegetative (EVS), late vegetative (LVS) and reproductive (RS) (i.e. at 30, 60 and 80 days after emergence of seedlings respectively) stages of growth. The physico-chemical characteristics of the soil were: sand 40%, silt 30%, clay 29%, textural class loam, organic matter 1.51%, pH 7.6, ECe 1.2 dS m-1, cation exchange capacity 13.2 meq per 100 g soil, sodium adsorption ratio 0.07 Watering was carried out to administer the soil moisture to field capacity. Plants were grown for 15 d under applied salinity at each growth stage and then harvested. Visual symptoms growth and yield characteristics. Two uppermost trifoliate leaves were marked as young and two lowermost green leaves as old for symptomatic and other determinations. These leaves were visually evaluated for symptoms of salt injury as tip-burning, chlorosis (yellowing) and necrotic spots as reported elsewhere (Wahid et al. 1999b). Leaf number per plant was counted and their area was determined using a leaf area meter (Model Li-3000, Licor, Lincoln, USA). For taking dry mass, the harvested plants were transferred to paper bags and kept in an oven at 70oC for seven days. One set of plants receiving salt
treatments at RS was saved for the determination of pod and seed yield. The pods were counted and seed number per pod was determined from the harvested plants from each treatment. Salinity tolerance limits i.e. mM50 (NaCl level in at which growth and yield parameters reduce to 50%), of genotypes were computed based on the growth and yield characteristics at above defined stages. Mineral nutrient analysis. For the determination of Na+, K+ and Ca2+ and P from leaves, the dried powdered material (0.5 g) was digested in HNO3:HClO4 mixture (3:1 ratio) at 280oC for 2 h, or until a sample has become clear, cooled and made up to 50 mL using deionized water. Na+ and K+ were determined on flame-photometer (Sherwood Model 410, Cambridge, UK), and Ca2+ on atomic absorption spectrophotometer (Perkin Elmer, Model 303, New York). Total P was estimated colorimetrically using Barten’s reagent and total N by microKjeldahl method. For Cldetermination, dried powdered material (0.5 g) was boiled in distilled water in a screw capped test tubes for 1 h, cooled and filtered, volume made up to 50 mL and determinations made on chloride analyzer (Model-VC-HI Central Kagaku Corporation, Japan). Chlorophylls and carotenoids determination. Fresh excised trifoliate leaves wrapped in black plastic bags, put in ice bucket were brought to laboratory. Each leaf sample (0.5 g) was extracted in 80% acetone (100 mL), vacuum filtered and filtrate immediately determined for chlorophyll (Chl) and carotenoid (Car) using spectrophotometer (Hitachi Model-U 2001 Japan). Amount of each Chl species was computed following the formulae of Arnon (1949), and that of Car as described by Davies (1976). Statistical analysis. Analysis of variance was performed using COSTAT software to determine statistically significant differences and interaction of various factors. Duncan’s new multiple range test was applied to compare the treatment means. Linear correlation was established between mean values of different variables at the highest salinity level (120 mmol L-1). For this purpose, apparent symptoms (graded to obtain values) and quantitative characters of leaves of each genotype within a growth stage were arranged in ascending order. The correlation coefficients (r) were computed cumulative of all growth stages (n=12). The “r” carrying single or double asterisk given in results section are different at p<0.05 and p<0.01, respectively.
RESULTS Visual symptomatic studies. Visual symptoms of ionic injury were evident in the form of tip burning, chlorosis and necrotic spots on leaflets of both the ages. Although ionic injury also occurred at lower salt levels, its extent was greater at higher levels (data shown in Table I pertain to 120 mmol L-1). Genotypes revealed remarkable differences at all the growth stages for these symptoms. Chlorosis was low on
1144
SALT-INDUCED SYMPTOMATIC AND PHYSIOLOGICAL CHANGES IN MUNGBEAN / Int. J. Agric. Biol., Vol. 6, No. 6, 2004 young leaflets ofTable NM-54I. at all stages and and high in NM-92, young leaves, and while valuesleaves were 44 for old genotypes Symptoms degree of salt injury on young oldthese trifoliate of and four55 mungbean -1 while this trend was just120 reversing for old leaflets of early these vegetative ones (Table V).late On vegetative the contrary, youngand leaflets of sensitive NaCl level at (EVS), (LVS) reproductive (RS) stages of under mmol L genotypes. Necrosis was low on young leaflets of NM-54 at genotypes accumulated as high as 40 and 60 mg g-1 dry growth weight of Na+ and Cl-, respectively, while these values were EVS and LVS and in NM-92 at RS; however, old leaflets Sign of salt Degree EVS LVS up to 36 and 62, respectively for old leaflets. Data revealedRSa showed no specific trend. Tip burning of young leaflets was injury significant Young difference genotypes, salinity levelsOld leaflets low in NM-98 at EVS, NM-54 at LVS andYoung NM-89 at RS, Old leaflets leaflets leafletsamong Oldthe leaflets Young leaflets NM-54NM-54 at NM-92 NM-54 NM-54 Chlorosis and their interaction, exceptNM-92 a non-significant interaction atNM-92 but high in NM-92 at all stages.Low For old leaflets, NM-89 depicted NM-98 of old leaflets.NM-89 The levels of N,NM-98 for Na+ contentNM-98 EVS and LVS and NM-89 at RS high leaflet tip NM-98LVS and RS NM-89 NM-89 NM-98 NM-89 NM-98 + 2+ ↓ and Ca of mungbean genotype got reduced at allNM-89 P, K burning. NM-92 NM-54 NM-92 NM-54 NM-92 NM-54 High growth stages, but significant genotypic differences were Growth, yield and salt tolerance. Although applied salinity Overall contentNM-92 of these nutrients were greaterNM-92 significantly reduced the shoot dry the genotypes NM-92discernible.NM-54 NM-89 Necrosis Lowweight ofNM-54 NM-98genotypes NM-89 NM-54 in younger NM-89 than older leavesNM-89 (Fig. 2). Although N-content ofNM-89 at all growth stages (Fig. 1), the difference among NM-92 NM-92 NM-92 was reduced, NM-98 young leaflets of NM-54 had theNM-98 was significant at LVS only, and↓ there was no interaction of NM-54the genotypes NM-89 NM-98 NM-98 NM-54 NM-98 NM-54 High highest and that of NM-98 the lowest value of this parameter salinity and genotypes at any stage (Table II). All the leaflets at all growth stages. We noted aNM-92 genotypes displayed a similar Low reduction inNM-98 the shoot dry NM-92in the young NM-54 NM-92 NM-89 Tip burnng NM-54 a lowest NM-89 NM-98 and salinity NM-54 significant NM-98 difference of genotype levels for NNM-98 weight except at LVS, where NM-89 indicated NM-89genotypes NM-98 NM-98 ↓ content forNM-89 young and old NM-89 leaflets. However, there was noNM-54 reduction in this parameter compared with other NM-92 NM-54 of salinity and genotypes at anyNM-92 stage or leafletsNM-89 (Fig. 1). Number and area ofHigh green leaves were more NM-54interaction NM-92 ages (Table VI). P content of bothgenotypes leaflets under affected by salinity thanII.theAnalysis total shoot dry weight, as was Table of variance (mean squares)ofofdifferent some growth characteristics of mungbean although decreased with a concomitant increase in root zone evident from a increased significant salinity effect of salinity in inducing salinity, the young leaflets had greater P-content than the old remarkable effect on the genotypes at all stages. However, Source interaction of df was apparent Shoot dry weightfor (g plant-1ones ) of green leaves per2). plant Leaf area (cm2 plant-1) atNumber all growth stages (Fig. Genotypes, salinity levels salinity and genotypes at LVS variation EVS LVS RS EVS LVS RS EVS LVS and their interaction were significant for young leaflets at all RS number of leaves, and at EVS and RS for leaf area (Table Genotypes (G) 3 0.07ns 1.69** 1.62ns 33.19** 57.80* 17.47** 31.24** 59.35** 6.64** growth180.47** stages. The old leaves217.64** had no significant difference II). NM-54 excelled maintaining highest 38.39** Salinity the (S) others 3 in11.10** 25.65** 433.03** 581.08** 1626.86** 29.57** among genotypes at0.86* EVS and LVS, one at number and area Gofxgreen leaves9at all salt levels (120 mmol 0.59ns S 0.01ns 0.46ns 1.01ns 1.40ns but a significant 3.79* 2.63ns 0.65** 32 0.04 0.81 0.08 0.09 no salinity and1.04 genotypes1.64 interaction 5.29 was stages. Contrarily, NM-98 was0.18greatly 0.61RS. However, L-1) or growth Error Mean square values significant at ** P(Fig. < 0.01, non-significant evident at any stage (Table VI). affected even at lower salinity levels at all stages 1).* P < 0.05, ns Leaflets of genotypes, irrespective of their age, showed Substrate salinity significantly reduced the pod and Table III. Salinity induced changes in some pod and seed yield characteristics of mungbean genotypes at a sharp reduction in K+ content under increased salt levels, seed production but significant genotypic differences were maturity resulting in marked differences of genotypes and salinity evident. All the genotypes indicated a reduction in the levels at allofstages, with anof seed interaction salinity and number of pods Genotypes per plant, numberNaCl of seeds pod and of pods per Number seeds Number per 1000ofseed weight Seed yield levels per Number plant per pod for young plant (g) RS (Table VI). (g plant-1) (mmoldifferences L-1) genotypes leaflets at LVS and seeds per plant but with significant among 245/7 Control 8.00±1.00 7.67±0.33 61.67±9.68 63.00±2.66 4.07±0.77 Genotypes indicated significant difference for old leaves at genotypes and salt levels. All these parameters were most 40 6.00±1.00 4.67±0.58 28.33±7.67 41.73±3.45 1.87±0.87 EVS, but not at later stages. However, applied salinity affected in NM-92 followed by NM-98, whereas3.67±0.58 NM-54 80 3.67±0.58 13.67±4.04 24.37±2.64 0.90±0.90 affected the level of this nutrient at all 18.20±1.20 stages. NM-54 had was the least affected. This led to a 120 marked reduction in the 2.67±0.58 3.00±1.00 8.33±4.04 0.55±0.27 the highest K+ content in young leaves at all salinity levels, final seed yield per plant of all the genotypes as was further 241/11 Control 8.33±0.58 7.67±0.33 63.67±0.58 64.03±3.00 4.20±0.27 while the reverse trend was evident in NM-98 at EVS and evident from a well-marked reduction in 1000 seed weight 40 5.67±1.15 5.33±0.67 30.67±9.81 44.47±3.26 2.02±0.04 2+ level in both the RS,3.33±0.58 and in NM-92 at11.33±4.04 LVS (Fig. 3). Ca29.90±2.88 as well (Table III). 80 3.33±0.58 0.75±0.05 leaflets got reduced by salinity. Young leaflets showed Genotypes showed variability 120 in NaCl tolerance limits 2.33±0.58 2.67±0.58 8.33±2.52 20.53±1.40 0.42±0.27 greater Ca2+ than the old ones (Fig. 2), resulting in (mM50), which was derived on the basis of above-given NM-89 Control 8.67±0.58 8.33±0.58differences72.33±8.5 4.77±0.56 significant among genotypes64.30±2.74 and salinity levels growth and seed yield attributes. NM-54 with mM50 of 51.6 40 5.33±0.67 5.00±1.00 27.09±8.19 45.93±3.85 1.78±0.45 at all stages. However, there was no interaction (average of the growth stages) was salt 80 ranked highly 4.67±0.58 4.67±0.67 22.00±2.00 31.57±2.87 of salinity 1.45±0.75 , except at LVS for young and at RS and3.33±0.33 genotypes for Ca2+ tolerant followed by NM-89 (Table 120 IV). Contrarily, NM-98 3.33±0.58 11.33±1.33 22.33±1.46 0.75±0.17 for old leaflets (Table VI). Comparison of genotypes with an average mM50 of 38.8 (giving ~25% less mM50 than NM-54 9.00±1.00 8.33±0.58 75.33±3.32 64.23±2.95the greatest 4.97±0.88 showed that young leaflets of NM-54 exhibited NM-54) was ranked salt sensitive. Control 40 7.33±0.67 7.00±1.00 51.67±5.62 51.70±2.39 3.41±0.37 2+ content at stages and salinity levels while NM-98 did Ca Nutrient relations. All the genotypes displayed the 80 5.33±0.33 5.33±0.33 28.67±3.18 35.10±2.85 1.89±0.21 + so for old leaves. as the salt levels accumulation of Na and Cl in leaflets 120 4.33±0.58 4.33±0.58 18.67±2.31 29.70±1.73 1.23±0.15 Significance of variance Chlorophylls and sources carotenoid content. Photosynthetic progressed (Table V). The old leaflets had greater content of SOV than young ones, df pigments of the genotypes revealed marked changes under both the ionic species irrespective of the Genotypes (G) 3 6.06** 6.02** 654.51** 132.00** 2.82** increased salinity in 7631.19** the leaflets of both the ages at all lesser growth stage. However, the overall 3level of Na+ was Salinity (S) 65.39** 49.19** 3825.89** 33.42** + growth stages (Fig. 3). In young leaves, Chl-a was relatively0.24ns in the than Cl . NM-54 had G x Sthe lowest content 9 of Na and Cl 0.56ns 0.58ns 55.56ns 11.94ns Error 32 0.52older 56.58 7.51the difference0.24 less 0.46 affected than Chl-b under salinity, as young leaflets compared to other genotypes, while the + square values sgenotypic ignificant atdifference. ** P < 0.01, *Na P< 0.05, ns non-significant among the genotypes was seen at EVS and LVS but not at leaflets displayedMean no remarkable RS. NM-54 had the highest Chl-a at all stages and salt levels and Cl contents of NM-54 (highly salt tolerant genotype) (Table VII). Contrarily, Chl-b was more affected particularly were up to 27 and 44 mg g-1 dry weight respectively in
1145
WAHID et al. / Int. J. Agric. Biol., Vol. 6, No. 6, 2004 Table IV. Salt tolerance limits and ranking of mungbean genotypes under NaCl salinity Vegetative growth EVS LVS
Reproductive Mean growth RS Seed yield NM-98 43.2a 37.7a 42.7a 31.5a 38.8a NM-92 42.0a 44.7b 43.3a 29.4a 39.9a NM-89 42.3a 50.6c 52.7b 38.2b 46.0b NM-54 47.7b 54.7d 56.7c 47.1c 51.6c Means sharing same letter differ non-significantly S, sensitive; Mt, medium tolerant; Ht, highly tolerant Genotype
Rank
S S Mt Ht
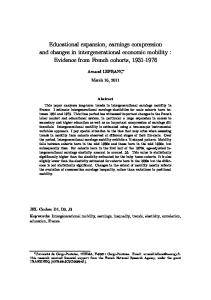
Fig. 1. Changes in shoot dry weight, number and area of green leaves of mungbean genotypes under salinity at early vegetative (EVS), late vegetative (LVS) and reproductive (RS) stages of growth
Dry weight (g plant-1)
5
Control
4
40
80
120
3 2 1
16
-5 4 M
-8 9
-9 2
N
N
N
60 DAE
M
M
-9 8
-5 4 N
N
M
M
-8 9
-9 2
30 DAE
M N
N
N
M
M
-9 8
-5 4
-8 9
M
M N
N
-9 8
M
M
N
N
Number of leaves per plant
20
-9 2
0
80 DAE
12 8 4
Leaf area (cm2 plant-1)
30 DAE
60 DAE
-5 4
-8 9
M N
M N
N
N
M
-9 2
-9 8
-5 4
M
-8 9
M N
N
M
-9 2
-9 8
M N
N
M
-5 4
-8 9
M N
M
-9 2
32
N
M
M
N
N
40
-9 8
0
80 DAE
24 16 8
4
9
-5
-8
M N
N
M
-9
-9
M N
M N
N
2
8
4 -5
9
LVS
M
-8
2 -9 M
M N
M
-9 N
N
M
-5
8
4
9 -8 M
M
EVS
N
N
N
N
M
-9
-9
8
2
0
RS
in young leaflets of sensitive genotypes (NM-98 & NM-92), thus showing a highly significant difference at EVS and
LVS and a significant one at RS. NM-54 maintained the greater content of Chl-b than the other genotypes (Fig. 3). Chl-a:b ratio increased in all the genotypes under salinity with the exception of NM-54, which maintained a steady Chl-a:b ratio at all the stages under salt stress (Fig. 3). However, the magnitude of changes in Chl-a:b ratio indicated no significant difference among genotypes and salt levels at EVS, but there was a significant difference among genotypes at LVS and RS, and a similar difference for salt levels at RS (Fig. 3). Salinity although reduced the Car content of young leaflets of the genotypes at all growth stages, NM-54 was the least affected than other genotypes. However, there was no difference among the genotypes; rather salinity induced a significant Car of the leaflets at various growth stages (Fig. 3). Chl-a content of old leaflets of genotypes were reduced to >50, >35 and >33% at EVS, LVS and RS respectively at the highest salt level (Fig. 3). For these leaves the genotypes indicated no difference at EVS and LVS but a significant one at RS. However, salinity treatment showed significant differences (Table VII). A high magnitude of changes in Chl-a content of these leaves resulted in an interaction of genotypes and salinity at EVS and RS. Applied salinity reduced the Chl-b content greater than Chla (Fig. 3). The effect of salinity on this pigment was more pronounced in NM-98 at EVS, NM-54 at LVS and NM-89 at RS. Chl-a:b ratio of the genotypes varied considerably at all stages with significant difference at LVS and RS but not at EVS (Table VII). Although this ratio increased in all the genotypes with increased salinity levels, a relatively lesser increase was noted in NM-92 at all the stages for these leaflets (Fig. 3). Car content of old leaflets was affected more than young ones. The genotypes had no significant difference for the Car, but the salinity levels indicated a significant difference at all stages (Table VII). However, NM-54, among the genotypes, displayed the highest Car content at all growth stages under increased salinity, though the content was much less than young leaflets of this genotype (Fig. 3). Correlations. Results were validated by establishing correlations between different variables at the highest salinity levels for the young leaflets in view of their importance to plant survival under salinity. There was a positive correlation of increased chlorosis with Na+ (r=0.769**) and Cl- (r=0.742**). A positive relationship of mM50 was evident with increase in Chl-b (r=0.731**) and Car (r=0.739**), but not with Chl-a (r=0.489ns). However, increased mM50 had an inverse relationship with higher Chla:b ratio (r=-0.688*). Increased necrosis indicated a week but positive correlation with excess of Na+ (r=0.621*) and Cl- (r=0.592*), but a strong inverse correlation with
1146
SALT-INDUCED SYMPTOMATIC AND PHYSIOLOGICAL CHANGES IN MUNGBEAN / Int. J. Agric. Biol., Vol. 6, No. 6, 2004 Table V. Ionic relations (mg g-1 dry weight) of young and old leaves of four mungbean genotypes under NaCl salinity at various growth stages Genotype NaCl (mmol L-1) NM-98
Cont 40 80 120
Early vegetative stage Na+ ClYoung Old Young Old leaves leaves leaves leaves 4.3±0.5 5.6±0.6 9.66±1.4 11.7±1.2 13.4±2.2 16.4±1.0 23.4±3.2 28.2±1.2 20.7±1.9 24.8±0.3 35.3±2.2 43.3±0.5 30.8±1.9 34.7±2.7 51.2±2.6 60.8±4.8
NM-92
Cont 40 80 120
4.2±1.0 11.7±1.3 23.2±2.3 31.5±2.4
5.7±0.8 9.9±0.8 11.6±1.7 5.1±0.4 14.7±1.2 20.4±2.3 25.7±2.1 12.4±1.9 26.6±1.9 39.9±3.0 46.6±3.5 23.6±2.3 33.6±2.1 53.3±1.7 58.9±3.6 33.5±2.1
6.3±0.7 16.8±2.0 29.5±2.6 33.9±2.5
10.5±0.8 21.2±1.8 40.3±4.3 54.2±3.5
11.0±1.3 29.5±3.6 49.6±2.3 56.0±3.7
5.8±1.2 12.4±1.7 25.2±1.4 34.0±1.8
6.4±1.0 17.4±1.2 29.7±3.0 34.6±1.3
10.6±1.5 22.5±2.0 41.5±2.9 55.1±4.4
11.1±1.7 30.4±2.0 52.3±4.6 60.8±2.1
NM-89
Cont 40 80 120
4.3±0.4 9.3±1.2 19.1±1.5 28.6±2.3
5.5±0.8 16.2±1.7 23.0±2.3 31.2±1.6
6.6±1.1 18.1±1.9 26.0±2.4 34.0±3.3
10.6±1.5 20.2±2.3 34.7±1.6 51.2±3.2
11.6±1.8 31.7±3.3 46.6±2.5 59.5±5.8
5.5±0.6 12.2±1.7 22.4±2.1 30.3±3.6
6.8±0.6 18.7±2.5 26.9±1.5 34.0±1.8
10.6±0.6 20.4±1.6 35.4±1.9 51.3±3.2
11.9±1.7 33.1±4.4 47.4±3.0 61.2±3.6
NM-54
Cont 40 80 120
4.5±0.4 8.7±1.1 16.8±1.4 25.2±3.2
5.8±0.7 9.8±0.9 11.8±0.6 5.6±1.1 6.5±0.8 10.4±0.8 16.3±1.3 16.2±2.1 29.1±2.6 9.8±0.8 20.1±2.7 16.7±1.9 29.3±2.1 29.4±2.5 48.5±1.2 17.0±0.6 30.1±2.6 29.6±2.9 35.2±2.1 42.3±3.0 60.7±2.3 26.4±3.2 38.6±2.0 42.9±3.7 Significance of variance sources
12.5±2.3 36.1±3.8 53.0±4.0 65.1±5.2
5.9±0.7 10.5±1.9 17.3±2.6 26.6±1.8
6.7±0.8 22.6±1.3 31.0±2.4 39.8±2.8
11.2±0.9 16.3±0.9 30.1±2.4 43.8±3.8
11.7±1.3 39.6±2.3 54.3±4.2 65.8±3.8
df 3 3 9 32
38** 1397** 7** 3
14** 1781** 6* 2
79** 5130** 20* 7
68** 1478** 11** 3
36** 1932** 7ns 3
118** 3604** 22** 4
56** 5894** 22* 8
SOV Gen (G) Salinity (S) GxS Error
10.4±0.8 19.8±2.2 34.7±2.9 50.1±4.1
98** 3555** 18** 5
11.1±0.9 28.4±2.9 41.5±1.9 55.4±3.6
65* 538** 56** 17
Young leaves 5.3±0.5 15.4±2.2 22.9±1.8 34.0±2.7
5.4±0.8 10.0±0.5 21.0±1.5 29.7±2.6
54** 1487** 10** 3
Late vegetative stage Na+ ClOld Young Old leaves leaves leaves 6.1±0.7 10.0±1.0 12.0±1.2 18.5±2.8 25.1±4.2 31.7±3.7 26.4±0.9 37.3±2.5 44.3±2.3 35.9±2.7 53.6±2.1 54.2±3.4
16** 1911** 5ns 4
116** 3674** 20* 7
Reproductive stage Na+ ClYoung Old Young Old leaves leaves leaves leaves 6.0±0.6 6.2±0.3 10.3±1.0 11.9±0.8 17.2±2.0 17.8±1.8 26.1±2.4 32.2±2.5 24.2±2.9 25.1±2.3 38.6±2.2 44.9±2.5 34.1±3.0 35.8±2.8 54.3±2.8 61.6±4.3
Mean square values significant at ** P < 0.01, * P < 0.05, ns non-significant
Table VI. Analysis of variance (mean squares) of some mineral nutrient contents of young and old trifoliate leaves of mungbean genotypes at various growth stages Source of variation
df
Young trifoliate leaves Ca2+ N K+ Early vegetative stage (EVS) Genotypes (G) 3 1.40** 0.89** 7.86** 9.27** 0.78** Salinity (S) 3 15.23** 1.63** 500.79** 230.60** 8.54** GxS 9 0.11ns 0.19** 1.38ns 0.94ns 0.06ns Error 32 0.12 0.05 0.64 0.69 0.07 Late vegetative stage (LVS) Genotypes (G) 3 0.96** 0.97** 7.17** 7.39** 0.22* Salinity (S) 3 14.18** 1.52** 498.65** 262.70** 8.79** GxS 9 0.10ns 1.23** 1.39** 1.38** 0.11ns Error 32 0.12 0.04 0.33 0.45 0.06 Reproductive stage (RS) Genotypes (G) 3 1.58** 0.88** 7.76** 8.23** 0.76** Salinity (S) 3 12.02** 1.38** 499.45** 263.55** 8.64** GxS 9 0.16ns 0.18** 1.38* 1.44ns 0.06ns Error 32 0.09 0.03 0.62 0.66 0.06 Mean square values significant at ** P < 0.01, * P < 0.05, ns non-significant N
P
reduced contents of N (r=-0.824**), P (r=-0.885**), K+ (r=0.911**) and Ca2+ (r=-0.854**). Likewise higher mM50 exhibited a negative relationship with chlorosis (r=-0.728**) and necrosis (r=-0.744**) of young leaflets.
DISCUSSION Nature, extent and timing of salinity application are important to determine the salt tolerance ability of any
P
Old trifoliate leaves K+
Ca2+
0.06ns 1.22** 0.05ns 0.03
0.94* 294.42** 0.32ns 0.31
0.92* 138.78** 0.48ns 0.31
0.04ns 0.96** 0.03ns 0.02
0.05ns 292.32** 1.01** 0.21
1.29** 129.74** 0.41ns 0.29
0.06* 1.22** 0.02ns 0.02
0.59ns 299.28** 0.38ns 0.22
1.32** 125.55** 0.72** 0.23
species (Zeng et al., 2001; Bayuelo-Jimenez et al., 2002; Sreenivasulu et al., 1998; Katerji et al., 2003). This study on mungbean genotypes performed at various growth stages showed substantial differences in the signs of salt damage (Table I), reductions in overall growth (Fig. 1) and the pod and seed yield attributes (Table II). The effect was most pronounced on the leaf area per plant (>75 and 55% reduction in sensitive and tolerant genotypes respectively), which severely curtailed the available area for stomatal gas
1147
WAHID et al. / Int. J. Agric. Biol., Vol. 6, No. 6, 2004 Table VII. Analysis of variance (mean squares) of Chl and Car content of young and old trifoliate leaves of mungbean genotypes at various growth stages Source of variation df
Young trifoliate leaves Chl-a Chl-b
Old trifoliate leaves Chl-a:b Carotenoid Chl-a Chl-b Early vegetative stage (EVS) Genotypes (G) 3 0.23* 0.38** 0.24ns 0.004ns 0.03ns 0.11** Salinity (S) 3 5.25** 3.51** 0.29ns 0.110** 5.42** 3.52** GxS 9 0.13ns 0.12ns 0.04ns 0.002ns 0.07** 0.04ns Error 32 0.06 0.06 0.11 0.002 0.03 0.02 Late vegetative stage (LVS) Genotypes (G) 3 0.36* 0.62** 0.93** 0.002ns 0.01ns 0.08** Salinity (S) 3 4.53** 2.43** 0.06ns 0.092** 3.09** 2.66** GxS 9 0.09ns 0.04ns 0.04ns 0.001ns 0.07ns 0.04ns Error 32 0.12 0.05 0.07 0.001 0.03 0.02 Reproductive stage (RS) Genotypes (G) 3 0.05ns 0.08* 0.16* 0.002ns 0.11* 0.18** Salinity (S) 3 5.11** 3.63** 0.17** 0.058** 2.60** 2.91** GxS 9 0.03ns 0.05ns 0.05ns 0.002ns 0.10** 0.04ns Error 32 0.04 0.03 0.04 0.002 0.03 0.02 Mean square values significant at ** P < 0.01, * P < 0.05, ns non-significant
Chl-a:b
Carotenoid
0.11ns 0.34** 0.32* 0.08
0.002ns 0.110** 0.005ns 0.003
0.24** 0.32** 0.05ns 0.03
0.004ns 0.049** 0.005ns 0.003
0.16** 0.53** 0.04ns 0.03
0.002ns 0.060** 0.004ns 0.006
Fig. 2. Mineral nutrient content of young and old leaves of mungbean genotypes under salinity at early vegetative (EVS), late vegetative (LVS) and reproductive (RS) stages of growth 10.0 N (%)
Control
Y oung leaflets
7.5
40
80
120
O ld leaflets
5.0 2.5
P (%)
LVS
RS
EVS
LVS
N
M
-5 4
-8 9
-9 2
N
N
M
M
-9 8
-5 4 N
M N
M
-8 9
-9 2 N
N
M
-9 8
M
-5 4 N
M
M N
N
M
-8 9
-9 2
-9 8 N
N
N
M
M
M
-5 4
-8 9
-9 2
M
M
N
N
M N
N
-9 8
-5 4
-8 9
M
-9 2 N
M N
EVS
2.0
M
-9 8
-5 4 N
M
-8 9 N
M
M N
M
M
N
N
3.0
-9 8
4.0
-9 2
0.0
RS
1.0
+
-1
LVS
RS
LVS
N
M
-5 4
-8 9
-9 2 N
N
M
M
-9 8
-5 4 N
M
-8 9 N
M N
N
EVS
M
-9 2
-9 8
M
M N
N
M
-5 4
-8 9
-9 2
M N
N
N
M
M
-9 8
-5 4
-8 9 N
N
M
M
-9 2
M
-9 8 N
N
M
M N
N
-5 4
-8 9
-9 2
M N
EVS
12
M
-9 8
-5 4
M
M N
N
-9 2
M N
N
M
-9 8 M
18
N
K (mg g DW)
24
-8 9
0.0
RS
6
12
LVS
EVS
LVS
N
M
-5 4
-8 9
-9 2 N
M
-9 8 N
M N
M
-5 4
-8 9 N
M
-9 2 N
N
N
M
-9 8
M
-5 4
M
-8 9
M
N
N
RS
M
-9 2
M N
N
M
-9 8
-5 4
-8 9
M N
N
N
M
M
-9 2
-9 8
-5 4 N
M
-8 9 N
M N
EVS
M
-9 2
-9 8 N
M N
M
-5 4
-8 9
M N
N
N
M
M
-9 2
-9 8 M N
18
RS
6
EVS
LVS
EVS
4 -5
9 N
M
-8
2 N
M
-9
8 N
M
-9
4 N
N
M
-5
9
LVS
M
-8
2 M N
N
M
-9
-9
8
4 M N
N
M
-5
9 -8
2 -9
M N
N
M
-9 M N
RS
exchange (Sreenivasulu et al., 1998). NaCl tolerance ability (mM50) from ~39 (NM-98) to ~52 (NM-54) substantiated that mungbean (Table IV). Despite a salt sensitive species (Minhas et al., 1990), has scope for improvement and fetching acceptable yield in low salinity profile soils.
8
4 -5
-8
M N
M N
M
9
2 -9
8 -9 N
M N
N
M
-5
4
9 -8
2 N
M
-9
8 N
M
-9
4 -5
M N
N
M
-8
2 -9
M N
N
M
-9 M N
9
0
8
2+
-1
Ca (mg g DW)
0 24
RS
Consistency in salt tolerance at all stages, as noted in NM54, is an important finding because the incidence of salinity spell at any growth stage may severely curtail the stand in the field.
1148
SALT-INDUCED SYMPTOMATIC AND PHYSIOLOGICAL CHANGES IN MUNGBEAN / Int. J. Agric. Biol., Vol. 6, No. 6, 2004 Mechanisms of salt tolerance have been widely studied in majority of crops, including legumes that are quite diverse in nature. Many plant species partition the excess of ions at organ (Wolf et al., 1991; Wahid, 2004), and/or sequester at cell levels (Jacoby, 1999; Chen et al., 2003). Taking the account of visual symptoms, the effect of excess ions is commonly reported in the form of tip burning, chlorosis (Wahid et al., 1997), appearance of scorch (Barroso & Alvarez, 1997) and necrotic spots on whole leaf (Wahid et al., 1999b; Chen et al., 2003). Whether the frequency of these signs is related to ultimate biomass and seed yield needs thorough investigations. This study indicated the effect of excess ions was apparent on leaves of both the ages; the old leaflets being much more affected than the young ones (Table I). It is noteworthy however that highly tolerant genotype (NM-54) had the lowest content of Na+ and Cl- as compared to the others (Table V). This indicated the ability of tolerant genotypes to exclude toxic ions into old senescing parts (Schachtman & Munns, 1992; Wahid, 2004), perhaps by withdrawing ions from the xylem stream (Jeschke et al., 1986; Wolf et al., 1991), so minimizing their accumulation in the young leaflets. Induced nutrient deficiency is another important effect
of increased salinity (Zidan et al., 1992). Salt stress alters the membrane properties leading to reduced uptake of various essential nutrients by the roots and transport to the shoots (Promila & Kumar, 2000; Lauchli & Luttge, 2002). This can be measured readily by tissue analysis or noted from the visual nutrient deficiency symptoms. Deficiency of N and Ca2+ leads to the chlorosis (yellowing) and that of P to the necrosis of leaves. Reduction in K+ levels is due to specific effect of Na+. Role of K+ has been implicated in the enzyme activities of respiration and photosynthesis and osmotic adjustment. Its deficiency initially leads to chlorosis and then necrosis (James, 1988; Taiz & Zeiger, 2002). Although the content of all nutrients were severely reduced under salinity, a better tendency of the tolerant genotypes to maintain their greater content in young leaflets emerged as an important strategy to depict low nutrient deficiency symptoms as chlorosis and necrosis (Table I). Both isotopelabeling and tissue-analysis studies have shown that different species have an important tendency of remobilization and utilization of various essential nutrients from aged and senescing leaves to the young growing regions under normal (Durand & Lacan, 1994; Mavrogianopouls et al., 2002; Wang et al., 2003) or stress
6.0
Control
Young leaves
4.0
40
80
120
Old leaves
2.0
LVS
EVS
LVS
-5 4
M N
N
M
-8 9
-9 2
-9 8
M N
N
N
M
M
-5 4
-8 9
-9 2
N
N
M
M N
M
-9 8
-5 4
-8 9 N
N
RS
M
M
-9 2
-9 8
M
M
N
N
N
M
-5 4
-8 9
-9 2 N
N
M
M
-9 8
-5 4 N
M
-8 9 N
N
M
-9 2
EVS
2.0
M
M N
N
M
-9 8
-5 4
-8 9
M N
N
M
-9 8
M
M
N
N
3.0
-9 2
0.0 4.0
RS
LVS
EVS
N
M
-5 4
-8 9
-9 2
LVS
-5 4
M N
N
M
-8 9
-9 2
-9 8
M
M
N
N
N
M
-8 9
-5 4
RS
M N
M N
M N
N
M
-9 8
-5 4
-8 9 N
M
-9 2 -9 2
-9 8 N
N
N
M
M
-5 4
-8 9
M
-9 2 N
M N
N
LVS
M
-9 8 M
-5 4
N
RS
M N
M N
N
M
-9 8
-5 4
-8 9
M N
M
-9 2
N
N
M
-9 8 M N
M N
-8 9
EVS
M
-9 2
M N
M N
N
M
-9 8
-5 4
-8 9
M N
N
-5 4
-8 9
-9 2 N
M
-9 8 N
N
M
-5 4
M
-8 9 N
M N
-9 2
RS
M
-9 8
N
N
M
M
-5 4
-8 9
M N
M
-9 2
N
N
M
-9 8 M N
LVS
EVS
1.0
M
-9 2
-9 8 N
N
M
-5 4
M
-8 9 N
M
-9 2 N
M
M
EVS
2.0 1.5
N
M N
0.0 3.0 2.5 2.0 1.5 1.0 0.5 0.0
-9 8
1.0
-1
RS
0.5
RS
1149
4
M
-5
9
RS
N
N
M
-8
-9
2
8 M N
M N
N
-9
-5
4
9
LVS
M
-8
2 N
M
-9
8 N
M
-9
4 N
M
-5
9 M
-8
EVS
N
M N
N
M
-9
-9 M N
2
8
4 -5
9 N
M
-8
2 N
M
-9
8 -9
M N
M N
M
-5
4
9 -8
LVS
N
M N
N
M
-9
2
8 -9
4 N
N
M
-5
9
EVS
M
-8
2 -9
M
M N
N
M
-9
8
0.0
N
Car (mg g FW)
Chl a:b ratio
-1
Chl b (mg g FW)
-1
Chl a (mg g FW)
Fig. 3. Clorophyll (Chl) and carotenoid (Car) content of young and old leaves of mungbean genotypes under salinity at early vegetative (EVS), late vegetative (LVS) and reproductive (RS) stages of growth
WAHID et al. / Int. J. Agric. Biol., Vol. 6, No. 6, 2004 (Hocking, 1982) conditions. The tolerant genotypes appeared to adopt this strategy in displaying higher content of essential nutrients (Fig. 2) in displaying better growth and seed yield at maturity. This aspect, however, needs to be verified in mungbean and other species. Stress conditions adversely affect the pigment composition in different plant species, as is quite often noted from the changed coloration (Wahid et al., 1997) or necrosis of leaves (Chen et al., 2003). Salinity-induced chlorophyll fluorescence has been used as a tool to ascertain the salt tolerance in various plant species (Misra et al., 2001; Morant-Manceau et al., 2004). In this study, the Chl and Car contents were substantially diminished under salinity in leaflets of both the ages (Fig. 3). Positive correlations of increased mM50 and high levels of photosynthetic pigments in young leaflets (cf. results section) revealed that greater contents of Chl and Car are important in salt tolerance. Furthermore, Chl-a:b ratio of young leaves of the sensitive genotypes (NM-92 and NM-98) increased significantly, while the tolerant ones (NM-89 and NM-54) tended to maintain a fairly steady value (Fig. 3). This corroborates the reports for durum wheat (Husain et al., 2003). Increased Chl-a:b ratio was positively related to Na+ and Cl- while negatively to increased mM50 of young leaflets. This revealed an important role of photosynthetic pigments (mainly Chl-b & Car) in the enhanced salt tolerance of mungbean genotypes (Table IV). This role may be a higher photochemical capacity of the Chl and Car-mediated regulation of nonphotochemical energy dissipation under stress (Rmiki et al., 1999). Increased necrosis, an important visual symptom (Volkmar et al., 1998), indicated a strong inverse correlated with reduced contents of N, P, K+ and Ca2+ contents. Excess of Na+ and Cl- on the other hand was only weakly correlated with necrosis of the genotypes (cf. results section). This showed that appearance of necrotic signs (Table I) was predominantly due to ion-induced nutrient deficiency (Fig. 2). Inverse relationships of higher mM50 with increased chlorosis and necrosis are ascribed to reduced dry matter partitioning during whole growth period in sensitive genotypes (Fig. 1). Leaf tip burning a naturally occurring phenomenon, although increased under salinity, sparingly exhibited any relationship with various attributes of young leaflets and thus revealed a little role in the salt sensitivity response. Ionic-induced deficiency of essential nutrient and loss of Chl and Car hamper the photosynthetic efficiency of the plants in the production and partitioning of photoassimilates (Sreenivasulu et al., 1998; Morant-Manceau et al., 2004) a higher rate of which is imperative in greater dry mass and seed yield. Therefore, sustained levels of all these attributes in young leaves are a requisite at all stages. A severe reduction in pod and seed yield of the genotypes was presumably related to the hampered photosynthetic activity of leaves due to chlorosis and necrosis of the leaves (Table I,
II). Moreover, it is documented that photosynthesis in fruit wall contributes significantly (up to 20%) towards seed filling (Wahid & Rasul, 2004); the browning (chlorosis) of pods due to salinity has also partly affected the final seed yield in mungbean genotypes. In crux, although ion-toxicity mainly crippled the dry mass and seed yield, nevertheless flexibility for salt tolerance indicates a scope for breeding and tailoring of mungbean in moderately saline tracts. Pattern of iondistribution did not change with the growth stages. Low chlorosis and necrosis of young leaves were taken as important criteria of salt tolerance. Ion-exclusion into senescing leaves together with enhanced tissue nutrients and photosynthetic pigments (mainly Chl-b) of young leaves were important strategies of salt tolerance.
REFERENCES Arnon,
D.I., 1949. Copper enzyme in isolated chloroplasts. Polyphenoloxidase in Beta Vulgaris. Plant Physiol., 24: 1–15 Barroso, M.C.M. and C.E. Alvarez, 1997. Toxicity symptoms and tolerance of strawberry to salinity in the irrigation water. Sci. Hort., 71: 177–88 Bayuelo–Jimenez, J.S., R. Craig and J.P. Lynch, 2002. Salinity tolerance of Phaseolus species during germination and early seedling growth. Crop Sci., 42: 584–94 Chen, S., S. Wang, E. Fritz, A. Huttermann and A. Altman, 2003. Effect of NaCl on shoot growth, transpiration, ion compartmentation, and transport in regenerated plants of Populus euphretica and Populus tomentosa. Canadian J. For. Res., 33: 967–75 Davies, B.H., 1976. Carotenoids. In: Goodwin, T.W. (ed.) Chemistry and Biochemistry of Plant Pigments, pp. 38–165. 2nd ed., Academic Press. London Durand, M. and D. Lacan, 1994. Sodium partitioning within the shoots of soybean. Physiol. Plant., 91: 65–71 Flowers, T.J., 2004. Improving crop salt tolerance. J. Exp. Bot., 55: 307–19 Goertz, S.H. and J.M. Coons, 1991. Tolerance of Tepary and Navy beans to NaCl during germination and emergence. Hort. Sci., 26: 246–9 Hocking, P.J., 1982. Effect of water stress on redistribution of nutrients from leaves of narrow leaved lupin (Lupinus angustilolius L.). Ann. Bot., 49: 541–3 Husain, S., R. Munns and A.G. Codon, 2003. Effect of sodium exclusion trait on chlorophyll retention and growth of durum wheat in saline soil. Australian J. Agric. Res., 54: 589–97 Jacoby, B., 1999. Mechanisms involved in salt tolerance of plants. In: Pessarakli, M. (ed.) Handbook of Plant and Crop Stress, pp. 97–123. 2nd ed, Marcel Dekker Inc. New York James, D., 1988. Salinity tolerance of blackgram and mungbean: II. Mineral ion accumulation in different plant parts. Korean J. Crop Sci., 46: 387–94 Jeschke, W.D., J.S. Pate and A.C. Atkins, 1986. Effects of NaCl salinity on growth, development, ion transport and ion storage in Whit lupin (Lupinus albus L. cv. Ultra). J. Plant Physiol., 124: 257–74 Katerji, N., J.W. van Hoorn, A. Hamdy and M. Mastrorilli, 2003. Salinity effect on crop development and yield, analysis of salt tolerance according to several classification methods. Agric. Water. Managmt., 62: 37–46 Lacan, D. and M. Durand, 1995. Na+ and K+ transport in excised bean roots. Physiol. Plant., 93: 132–8 Lauchli, A. and U. Luttge, 2002. Salinity: Evironment – Plants – Molecules. Kluwer Academic Publishers. London Mavrogianopoulos, G., D. Savvas and V. Vogli, 2002. Influence of NaCl salinity on half of the root system of hydroponically grown tomato on growth, yield and tissue mineral composition. J. Hort. Sci. Biotechnol., 77: 557–64
1150
SALT-INDUCED SYMPTOMATIC AND PHYSIOLOGICAL CHANGES IN MUNGBEAN / Int. J. Agric. Biol., Vol. 6, No. 6, 2004 Minhas, P.S., D.R. Sharma and B.K. Khosla, 1990. Mungbean response to irrigation with waters of different salinities. Irrig. Sci., 11: 57–62 Misra, A.N., A. Srivastava and R.J. Strasser, 2001. Utilization of fast chlorophyll a fluorescence in assessing the salt/ion sensitivity of mung bean and Brassica seedlings. J. Plant Physiol., 158: 1173–81 Morant–Manceau, A., E. Pradier and G. Tremblin, 2004. Osmotic adjustment, gas exchange and chlorophyll fluorescence of a hexaploid triticale and its parental species under salt stress. J. Plant Physiol., 161: 25–33 Murillo–Amador, B., R. Lopez–Aguilar, C. Kaya, J. Larrinaga–Mayoral and A. Flores–Hernandez, 2002a. Comparative effects of NaCl and polyethylene glycol on germination, emergence and seedling growth of cowpea. J. Agron. Crop Sci., 188: 235–47 Murillo–Amador, B., E. Troyo–Dieguez, R. Lopez–Aguilar, A. Lopez– Cortes, C.L. Tinoco–Ojanguri, H.G. Jones and C. Kaya, 2002b. Matching physiological traits and ion concentrations associated with salt tolerance with cowpea genotypes. Australian J. Agric. Res., 53: 1243–55 Neumann, P.M., E.V. Volkenburgh and R.E. Cleland, 1988. Salinity stress inhibits bean leaf expansion by reducing turgor, not wall extensibility. Plant Physiol., 88: 233–7 Pentalone, V.R., W.J. Kenworthy, L.H. Slaughter and B.R. James, 1997. Chloride tolerance in soybean and perennial Glycine accessions. Euphytica, 97: 235–9 Plaut, Z., C.M. Grieve and E. Federman, 1994. Salinity effects on photosynthesis in isolated mesophyll cells of cowpea leaves. Plant Physiol., 91: 493–9 Promila, K. and S. Kumar, 2000. Vigna radiata seed germination under salinity. Biol. Plant., 43: 423–6 Rmiki, K–E., Y. Lemoine, B. Schoeff, 1999. Carotenoids and stress in higher plants and algae. In: Pessarakli, M. (ed.). Handbook of Plant and Crop Stress, pp. 465–82. 2nd Ed, Marcel Dekker Inc. New York Schachtman, D.P. and R. Munns, 1992. Sodium accumulation in leaves of Triticum species that differ in salt tolerance. Australian J. Plant Physiol., 19: 331–40 Shannon, M.C., 1997. Adaptation of plants to salinity. Adv. Agron., 60: 76– 199 Shannon, M.C. and C.L. Noble, 1995. Variation in salt tolerance and ion accumulation among subterranean clover cultivars. Crop Sci., 35: 798–804
Sreenivasulu, R.P., S. Ramanjulu, C. Sudhakar and K. Veeranjaneyulu, 1998. Differential sensitivity of stomatal and non–stomatal components to NaCl or Na2SO4 salinity in horsegram, Macrotyloma uniflorum (Lam.). Photosynthetica, 35: 99–105 Srivastava, J.P. and S. Jana, 1984. Screening wheat and barley germplasm for salt tolerance. In: Staples, R.C. and G.H. Toeniessen (eds.) Salinity Tolerance in Plants: Strategies for Crop Improvement., pp. 223–84. John–Wiley, New York Taiz, L. and E. Zeiger, 2002. Plant Physiology, 3rd ed. Sinauer Associates Inc Publishers, Massachusetts Volkmar, K.M., Y. Hu and H. Steppuhn, 1998. Physiological responses of plants to salinity: a review. Canadian J. Plant Sci., 78: 19–27 Wahid, A., 2004. Analysis of toxic and osmotic effects of sodium chloride on leaf growth and economic yield of sugarcane. Bot. Bull. Acad. Sin., 45: 133–41 Wahid, A. and E. Rasul, 2004. Photosynthesis in leaf, stem, flower and fruit. In: Pessarakli, M. (ed.) Handbook of Photosynthesis, 2nd Ed. in press. Marcel Dekker Inc. New York Wahid, A., A.R. Rao and E. Rasul, 1997. Identification of salt tolerance traits in sugarcane lines. Field Crop. Res., 54: 9–17 Wahid, A., E. Rasul and A.R. Rao, 1999a. Germineration of seeds and propagules under salt stress. In: Pessarakli M (ed.) Handbook of Plant and Crop Stress, pp. 153–67. 2nd ed., Marcel Dekker Inc., New York Wahid, A., I. Masood, I–ul–H. Javed and E. Rasul, 1999b. Phenotypic flexibility as marker of sodium chloride tolerance in sunflower genotypes. Environ. Exp. Bot., 42: 85–94 Wang, W–Q., M. Wang and P. Lin, 2003. Seasonal changes in element contents in mangroove element retranslocation during leaf senescence. Plant Soil, 252: 187–93 Wolf, O., R. Munns, M.L. Tonnet and D.W. Jeschke, 1991. The role of stem in the partitioning of Na and K in salt treated barley. J Exp. Bot., 42: 697–704 Zayed, M.A. and I.M. Zeid, 1997. Effect of water and salt stresses on growth, chlorophyll, mineral ions and organic solute content, and enzyme activity in mung bean seedlings. Biol. Plant., 40: 351–6 Zeng, L., M.C. Shannon and S.M. Lesch, 2001. Timing of salinity stress affects rice growth and yield components. Agric. Water Managmt., 48: 191–206 Zidan, I., A. Shaviv, I. Ravina and P.M. Neumann, 1992. Does salinity inhibit maize leaf growth by reducing tissue concentration of essential mineral nutrients? J. Plant Nutr., 15: 1407–19 (Received 10 September 2004; Accepted 06 October 2004)
1151