Self-Fulfilling Price Cycles James Best University of Edinburgh
John Moore University of Edinburgh and London School of Economics
April 2014
1
Abstract This paper presents a model of a self-fulfilling price cycle in an asset market. In this model the dividend stream of the economy’s asset stock is constant yet price oscillates deterministically even though the underlying environment is stationary. This creates a model in which there is rational excess volatility - ‘excess’ in the sense that it does not reflect changes in dividend streams and ‘rational’ in that all agents are acting on their best information. The mechanism that we uncover is driven by endogenous variation in the investment horizons of the different market participants, informed and uninformed. On even days, the price is high; on odd days it is low. On even days, informed traders are willing to jettison their good assets, knowing that they can buy them back the next day, when the price is low. The anticipated drop in price more than offsets any potential loss in dividend. Because of these asset sales, the informed build up their cash holdings. Understanding that the market is flooded with good assets, the uninformed traders are willing to pay a high price. But their investment horizon is longer than that of the informed traders: their intention is to hold the assets they purchase, not to resell. On odd days, the price is low because the uninformed recognise that the informed are using their cash holdings to cherry-pick good assets from the market. Now the uninformed, like the informed, are investing short-term. Rather than buy-and-hold as they do with assets purchased on even days, on odd days the uninformed are buying to sell. Notice that, at the root of the model, there lies a credit constraint. Although the informed are flush with cash on odd days, they are not deep pockets. On each cherry that they pick out of the market, they earn a high return: buying cheap, selling dear. However they don’t have enough cash to strip the market of cherries and thereby bid the price up.
2
1
Introduction
Shiller [1980] argues that the volatility in asset prices is not justified by subsequent changes in dividend streams. Nor, he argues, are they justified by changes in public information about fundamentals [Shiller, 1992]. Such excess volatility is prima facie evidence that market participants are behaving irrationally. We ask if it is possible that such excess volatility be generated by purely rational market participants. Moreover, can it be explained from within the model – that is to say, endogenously, without exogenous variation? It is known that bubbles can be part of a stochastic equilibrium [Abreu and Brunnermeier, 2003]. In this paper we set ourselves the challenge of generating deterministic price movement in a perfectly stationary environment where asset prices reflect all publicly available information. In this economy the dividend stream of the asset stock would be constant while the asset prices would be volatile - a most extreme form of excess volatility. We show that it is possible. In our model the dynamic interaction of adverse selection (we have informed and uninformed traders) and credit constraints (the informed traders do not have deep pockets) can endogenously generate variation in the investment horizons of the different market participants. With these simple ingredients, we demonstrate a saw-tooth equilibrium in which prices deterministically rise one day and fall the next, ad infinitum. On even days, the price is high; on odd days it is low. On even days, informed traders are willing to jettison their good assets, knowing that they can buy them back the next day, when the price is low. The anticipated drop in price more than offsets any potential loss in dividend. Because of these asset sales, the informed build up their cash holdings. Understanding that the market is flooded with good assets, the uninformed traders are willing to pay a high price. But their investment horizon is longer than that of the informed traders: their intention is to hold the assets they purchase, not to resell. On odd days, the price is low because the uninformed recognise that the informed are using their cash holdings to cherry-pick good assets from the market. Now the uninformed, like the informed, are investing short-term. Rather than buy-and-hold as they do with assets purchased on even days, on odd days the uninformed are buying to sell. Notice that, at the root of the model, there lies a credit constraint. Although the informed are flush with cash on odd days, they are not deep pockets. On each cherry that they pick out of the market, they earn a high return: buying cheap, selling dear. However they don’t have enough cash to strip the market of cherries and thereby bid the price up. This paper sits within the literature on adverse selection that started with Akerlof [1970]. Our model is an infinite horizon adverse selection model. For earlier examples of 3
such models one can see Hendel and Lizzeri [1999] and Hendel et al. [2005] on dynamic adverse selection in the context of durable goods markets. These papers, as opposed to ours, do not look to examine or generate price volatility through this mechanism. Dow [2004] develops an adverse selection model that examines the potential for selffulfilling liquidity. In this paper there are two equilibria: a high liquidity equilibrium with narrow bid-ask spreads and a low proportion of trade being informational; and a low liquidity equilibrium with wide bid-ask spreads and a high proportion of trade being informational. Unlike the model in Dow [2004] we examine prices, as opposed to liquidity. We also examine adverse selection in a dynamic (infinite-horizon) setting as opposed to a one shot game. As a result the meaning of ‘self-fulfilling’ in the two papers is different. In Dow [2004] liquidity is self-fulfilling in the multiple equilibrium sense. There are two possible levels of liquidity and either level, high or low, justifies the equilibrium behaviour that justifies the level of liquidity. In our paper the price cycle is not self-fulfilling in the multiple equilibrium sense but in the sense that future prices justify the present price and the present price justifies future prices. Eisfeldt [2004] and Guerrieri and Shimer [2013] use adverse selection to model liquidity in a dynamic infinite horizon setting. Aggregate dynamics within their models result from aggregate shocks. A key difference, then, between these papers and our own is that the aggregate dynamics in our model arise completely endogenously, in a perfectly stationary environment. In Section II, we introduce the formal model. In Section III, we examine a constant price equilibrium. In section IV, we construct a self-fulfilling price cycle equilibrium. In section V, we provide a numerical example.
2
Model
The economy is discrete time, with a durable generic consumption good, fruit, and a single kind of asset, trees. At the start of each day trees mature with probability µ. The maturation process is i.i.d. across trees, age and time. When trees mature they bear fruit and immediately die. Trees that do not mature do not bear fruit and do not die. There are two types of tree: high quality “cherry” trees and low quality “lemon” trees. A fraction γ of trees are cherry. When trees mature, lemon trees bear l > 0 (generic) fruit and cherry trees bear h = l + ∆ (generic) fruit, where ∆ > 0. There is a continuum of risk-neutral traders. At the end of each day traders die with probability δ. Agents learn earlier in the day, after trees have matured, if they are to die at the end of the day. Death is i.i.d. across traders, age and time. Traders consume fruit, only once, just before they die.
4
There are two types of trader: “informed” traders and “uninformed” traders. Informed traders can determine whether an unmatured tree is a cherry or a lemon; uninformed traders cannot. A fraction θ of traders are informed. Each day – after the maturation of a fraction µ of the existing trees, but before a fraction δ of traders learn if they will die at the end of the day – a mass α of new traders are born endowed with a mass τ of new, unmatured, trees. A fraction γ of these new trees are cherry and a fraction θ of these new traders are informed. The overnight steady-state stock T of trees (of which γT are cherry) solves µT = τ . And the overnight steady-state mass A of traders (of whom θA are informed) solves δA = α. There is a daily competitive spot market in which trees are traded for fruit. The market occurs after traders learn if they will die at the end of the day. That is, the timing on each day is as follows: 1. A fraction µ of the existing trees mature: they yield fruit and die. 2. A mass α of new traders (of whom a fraction θ are informed) are born endowed with a mass τ of new, unmatured, trees (of which a fraction γ are cherry). 3. A fraction δ of traders – including a fraction δ of the newly-born1 – learn that they are dying today (see 5 below). 4. A market occurs in which trees are traded for fruit. 5. The dying traders consume their fruit and die. We can save on notation by assuming τ = µ and α = δ, so that T = 1 and A = 1. This model typically has several equilibria. Given the stationary nature of the environment, it is unsurprising that there is an equilibrium where price is constant through time; see section 2 below. We do not try to characterise all the non-constant-price equilibria. However, of particular interest to us is an equilibrium where the price deterministically oscillates: a high price on (e.g.) even days and a low price on odd days. We analyse this “saw-tooth” equilibrium in section 4. It is to this surprising equilibrium that we wish to draw the reader’s attention. There are features that are common to all the equilibria we study – i.e., common to a constant-price equilibrium and a saw-tooth equilibrium. Crucially, we assume that informed traders are able to cherry pick in the market – they only purchase cherry trees, to the extent that their budgets allow. Uninformed traders purchase the residual supply of trees. Of the trees purchased by the uninformed on day t, let qt be the equilibrium fraction that are cherry. 1
These traders live short lives.
5
The market price pt will reflect the uninformed buyers’ (rational) beliefs about qt . That is, pt is determined by an indifference condition for an uninformed buyer: between holding pt fruit and purchasing a tree of “quality” qt . In all the equilibria we examine in sections 3 and 4, we assume that the parameters are such that the informed buyers as a whole cannot afford to purchase all the cherry trees being supplied to the market, so qt > 0. Two behaviour patterns are obvious. First, a dying trader sells all his trees so as to maximise his fruit consumption before he dies. Second, on the day she is born, an informed trader sells all her endowment of lemon trees: if she uses the proceeds to purchase cherry trees then she is in effect using the market to replace lemon with cherry. (To simplify our diagrams, as an accounting convention we assume that informed newborns always first replace lemon with cherry, even if they have discovered they are going to die later that day and so will immediately resell these cherry trees.) Finally, we make five assumptions on parameters the reasons for which will not be apparent to the reader until later in the paper: Assumption 1: � 0 > a0 ≡θµ l(1 − γ)(1 − δ)δ + l(1 − δ)2 µ + ∆γ(1 − δ)2 µ − γδ[lδ − ∆(1 − δ)µ]
(1)
Assumption 2: �
� δ −θ >0 1− (1 − δ)µ
(2)
Assumption 3: � � � � δ(1 − µ) 0>a ˜0 ≡ θµ(1 − δ) (2 − δ)l + (1 − δ)µ∆ + γ[1 + (1 − δ)(1 − µ)] 1 − ∆ 2−µ 2
� � � � � � δ(1 − µ) 2 − [γδ − (1 − δ)(1 − γ)θµ] δ(2 − δ) l + γ(1 − µ) 1 − ∆ − (1 − δ) µ∆ 2−µ (3) Assumption 4: γ>
1 1 + (1 − δ)(1 − µ)
(4)
Assumption 5: � � 2(1 − γ)∆[1 + (1 − δ)(1 − µ)]2 2 0 <θµ(1 − δ) (2 − µ)(2 − δ)(l + ∆) − (2 − µ)(1 − δ) � � δ(1 − γ)∆[1 + (1 − δ)(1 − µ)] [1 − (1 − µ)2 (1 − δ)2 ] 2 − δ (2 − δ)(l + ∆) − (5) 1 − δ)(1 − µ)(2 − µ) 6
An analytical proof that parameters consistent with these assumptions exist is left to the appendix.
3
Constant Price Equilibrium
In this equilibrium the price and market quality of trees is constant: pt = p∗ and qt = q ∗ for all t. Dying traders sell all their trees; new born informed traders switch any lemon trees they carry for cherry (as described in section 2 above) – no other trees are sold. Informed traders exchange all their fruit for cherry trees sold by the dying traders. Uninformed traders purchase the residual stock of trees sold by the dying and the lemons sold by the new-born informed traders. q ∗ is the proportion of trees bought by the uninformed that are cherry.
3.1
Incentive Compatibility and Price
The informed and uninformed equilibrium behaviour follows from the fact that p∗ is the value of a market tree to an uninformed trader. The supply of market trees – the residual trees sold after cherry picking by the informed – is positive. Therefore, from the indifference of the uninformed between market trees and p∗ fruit, the net purchase of market quality trees by the uninformed is strictly positive i.e., the uninformed do not sell their market quality trees. Neither do the uninformed sell trees with which they are born as these trees are strictly preferred to p∗ fruit. To see this we first derive p∗ from its equivalence with an uninformed trader’s valuation of a market quality tree:
p∗ = µ(l + q ∗ ∆) + (1 − µ)p∗ = l + q ∗ ∆.
(6)
Where (l + q ∗ ∆) is the expected yield if the tree matures and p∗ is the value of the tree if it does not mature. A proportion γ of trees with which traders are born are cherry – a strictly greater proportion of cherry than for market trees. If a trader holds a tree with which they are born it can be sold for a price p∗ if it does not mature. The value of such a tree is then bounded below by µ(l + γ∆) + (1 − µ)p∗ , which is strictly greater than p∗ as defined in equation (6). Therefore uninformed traders strictly prefer the trees with which they are born to p∗ fruit. The above argument holds a fortiori for cherry trees, i.e. informed traders strictly prefer cherry trees to p∗ fruit. 7
Therefore informed traders exchange all their fruit for cherry trees and never sell cherry trees if they are not dying that day.
3.2
Market Clearing
As the informed traders hold only cherry trees overnight – call this stock N – the uninformed must hold the entire overnight stock of fruit in the economy – call this stock Y . At the equilibrium steady state of Y , Y ∗ , the total fruit consumed per day equals total fruit produced per day. The equilibrium steady state of N , N ∗ , is where the outflow of cherry trees from informed traders’ overnight stock is equal to the inflow. Of the (1 − δ)N ∗ trees held by the non-dying, a fraction µ are lost to maturation. δ of the N ∗ cherry trees are sold each period by the dying. The maturing cherry trees held by the non-dying informed traders yield (1 − δ)µN ∗ (l + ∆) fruit – this fruit is then exchanged for cherry trees. The non-dying new-born informed traders replace their lemons with cherry adding (1 − δ)θµ cherry trees to the stock of informed trees each day. The steady state condition for N ∗ is then:
(1 − δ)µN ∗ Maturing trees held by the nondying informed
+ δN ∗
= (1 − δ)µ(l + ∆)
Trees held by the dying informed.
N∗ + (1 − δ)θµ p∗
Trees bought from proceeds of maturing trees.
Trees of non-dying new-borns.
(7)
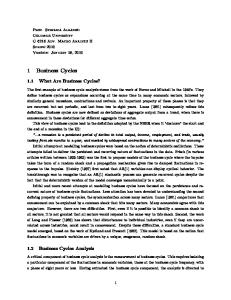
We can define all equilibrium stocks and flows in the economy in terms of N ∗ and Y ∗ . These stocks and flows are illustrated in figure 1 below:
8
Figure 1: Stocks and Flows in the Constant Price Equilibrium Markets must clear. In figure 1 we see the total number of trees sold by the dying and the newborn is: Tree Sales = δ + (1 − γ)(1 − δ)θµ; From dying informed and uninformed.
Lemon trees from non-dying informed new-borns.
(8)
and the quantity of these tress that are cherry is: Cherry Sales = γδ. (9)
Cherry trees from dying informed and uninformed. The informed buy only cherry trees: Informed Cherry Purchases = (1 − δ)µ(l + ∆)
N∗ p∗
Cherry trees bought from proceeds of maturing cherry trees held by nondying informed.
9
+ (1 − γ)(1 − δ)θµ Cherry trees bought by non-dying informed new-borns. (10)
The uninformed purchase the residual trees, a fraction of which are cherry: � � �� ∗ N Uninformed Cherry = q ∗ δ + (1 − γ)(1 − δ)θµ − (1 − δ)µ(l + ∆) ∗ + (1 − γ)(1 − δ)θµ p Purchases Trees sold − Informed cherry purchases = q∗
�
� N∗ δ − (1 − δ)µ(l + ∆) ∗ . p (11)
Hence, the market clearing condition for cherry trees2 is:
γδ
N∗ = (1 − δ)µ(l + ∆) ∗ + (1 − γ)(1 − δ)θµ + p
� � N∗ q δ − (1 − δ)µ(l + ∆) ∗ p
Cherry sales.
Informed cherry purchases.
Uninformed cherry purchases. (12)
Collecting the
∗
N∗ terms in the market clearing condition yields: p∗
(γ − q ∗ )δ − (1 − γ)(1 − δ)θµ = (1 − q ∗ )(1 − δ)µ(l + ∆)
N∗ p∗
(13)
and doing the same for the steady state stock of informed cherry holdings given by equation (7) yields �
� N∗ l + q∗∆ [δ + (1 − δ)µ] − (1 − δ)µ (l + ∆) ∗ = (1 − δ)θµ l+∆ p
where l + q ∗ ∆ comes from equation (6) for p∗ . Using (13) to substitute out
(14) N∗ in p∗
(14) and rearranging gives the quadratic:
Φ(q ∗ ) ≡(1 − δ)2 µ2 θ(1 − q ∗ ) � � l + q∗∆ − [δ + (1 − δ)] − (1 − δ)µ [δ(γ − q ∗ ) − (1 − γ)(1 − δ)θµ] l+∆ =0 2
(15)
Which also implies market clearing for lemon trees. Total lemon tree sales is: Lemon Sales = Tree Sales − Cherry Sales. Total lemon tree purchases is: Lemon Purchases = (1 − q ∗ )[Tree Sales − Informed Cherry Purchases]. Letting Lemon Sales = Lemon Purchases and rearranging yields equation (12).
10
Given the equilibrium behaviour of informed and uninformed traders we require that the solution to this quadratic lies in the interval of [0, γ]. The quadratic function Φ(.) can be written more compactly as: Φ(q) = a2 q 2 + a1 q + a0 ;
(16)
where
a2 = δ
∆ [δ + (1 − δ)µ] > 0. l+∆
(17)
The coefficient on the square term, a2 , is positive and a0 is less than zero by assumption (Assumption 1 section 2). Therefore, if Φ(γ) > 0, there exists a unique q ∗ ∈ [0, γ] such that Φ(q ∗ ) = 0. Define qN such that:3 δ(γ − qN ) − (1 − γ)(1 − δ)θµ = 0.
(18)
It is clear that qN < γ. We can see that qN > 0 by assumption 1. As a0 < 0 it follows that
−lγδ 2 + θµl(1 − γ)(1 − δ) < 0 ⇒ δγ − (1 − γ)(1 − δ)θµ > 0,
(19)
γ > qN > 0.
(20)
and therefore:
Evaluate the sign of Φ(.) at 0 and qN :
Φ(0) = a0 < 0 Φ(qN ) = (1 − δ)2 µ2 θ(1 − qN ) > 0.
(21) (22)
Therefore there exists a unique q ∗ ∈ [0, γ] such that Φ(q ∗ ) = 0 as shown in figure 2 below: 3
qN because from (13) N ∗ = 0 where q = qN .
11
Figure 2 Next, it is shown that N ∗ > 0. Examining the right hand side of the quadratic in (15), when q ∗ = 0 the first term is positive and, from equation (22), so is the final term in brackets. As Φ(0) < 0 it must be the case that l + q∗∆ [δ + (1 − δ)] − (1 − δ)µ > 0. l+∆
(23)
Which from equation (14) implies that N∗ >0 p∗ and therefore N ∗ > 0 for q ∗ ∈ [0, γ]. The stock of uninformed cherry trees held over night, (γ − N ∗ ), must also be greater than zero. In steady state the uninformed lose as many cherry trees as they gain. Hence, (γ − N ∗ ) solves
∗
(γ − N )[δ + (1 − δ)µ] = γ(1 − δ)(1 − θ)µ Cherry lost to death and maturation.
Cherry held by undying newborns.
� � N∗ + q δ − (1 − δ)µ(l + ∆) ∗ p ∗
Uninformed cherry purchases. (24)
If the right hand side is positive then γ − N ∗ is positive. The number of cherry trees gained by the uninformed each period is positive if the number of cherry trees purchased by the uninformed is positive. Rearranging the market clearing condition (12) gives: 12
� � � � N∗ N∗ (γ − q ) δ − (1 − δ)µ(l + ∆) ∗ = (1 − δ)(1 − γ) θµ + (l + ∆) ∗ > 0, p p ∗
(25)
which implies that uninformed cherry purchases are positive, i.e., their steady state stock of cherry trees is positive. Finally, we show that the steady state stock of fruit held overnight by the uninformed is positive. The uninformed hold all the fruit in the economy. The steady state stock of fruit in the economy is where total daily fruit consumption equals total daily fruit production. Dying traders consume their fruit held from the previous day, δY ∗ ; the fruit from selling their trees, δp∗ ; and the fruit from their maturing trees held from the previous day, δµ(l+γ∆).4 Fruit production is due only to maturing trees and is equal to µ(l+γ∆). Thus Y ∗ solves δY ∗ + δp∗ + δµ(l + γ∆)
=
µ(l + γ∆). (26)
Fruit Consumed by the Dying
Fruit from Maturing Trees
Substituting out p∗ in (26) and rearranging implies that Y ∗ is positive if: (1 − δ)µ(l + γ∆) − δ(l + q ∗ ∆) > 0. q ∗ ≤ γ hence a sufficient condition for Y ∗ > 0 is: (1 − δ)µ > δ, which follows immediately from assumption 2.
4
Saw-Tooth Equilibrium
In this equilibrium the market price deterministically oscillates between low on odd days, p1 , and high on even days, p0 . Correspondingly, the quality of trees purchased from the market by the uninformed oscillates between low on odd days, q1 , and high on even days, q0 . On even days all traders sell their trees. All trees sold on even days are purchased by non-dying uninformed traders – no tree is purchased by an informed trader. On even 4
Fruit is consumed only by the dying. Death is i.i.d. so the average dying trader holds the average of the economy.
13
days all trees are sold, the average tree sold is the population average, and informed traders do not cherry pick the market. Hence, the quality of trees purchased by the uninformed on even days is the quality of the population, i.e., q0 = γ.5 On odd days the dying traders sell all their trees and new born informed traders switch any lemon trees they carry for cherry (as described in section 2 ) these are the only trees sold on an odd day. Death is i.i.d. so the trees sold by the dying are the population average. The non-dying informed traders exchange all their fruit for cherry trees – cherry picking trees sold by the dying. The uninformed purchase the residual stock of trees sold by the dying and the lemons sold by the new-born informed traders. Hence, the quality of trees purchased by the uninformed on odd days is lower than the population average, i.e., q1 < q0 = γ.
4.1
Incentive Compatibility and Prices
Surprisingly, on even days, non-dying informed traders sell trees they know to be cherry to non-dying uninformed traders who only believe the tree is cherry with probability γ. This trade is only possible because of the differing investment horizons of the (nondying) informed and uninformed traders. On even days the non-dying informed traders have a shorter investment horizon than the non-dying uninformed: the return to informed traders from purchasing cherry trees is higher on odd days than on even days – so informed traders want to maximise the funds they have available for odd day investments. However, tree holdings suffer a temporary capital loss on odd days when prices drop from p0 to p1 – exactly when informed traders need funds for investment. Hence, informed traders are willing to pay a liquidity premium for fruit and take less than the value, (l + ∆), of a cherry tree’s long-run dividend stream. Non-dying uninformed traders, on the other hand, intend to hold even day trees for the long term – only selling the tree (in effect) when they die. The uninformed traders, if they do not die on the odd day, are unaffected by the temporary capital loss as they (mainly) value the asset for its dividend stream. The longer investment horizon of the uninformed then allows for gains from trade between the non-dying informed and uninformed traders despite the fact that the informed traders know they are selling their cherry trees for less than the ‘true’ value. The volume of trade on odd days is lower than on even days as only the dying and new-born informed with lemons are selling. Trade between the dying and the nondying occurs due to (the more conventional reason of) different preferences over trees and fruit. Trade between the non-dying informed and uninformed occurs because the 5
Note, that the behaviour of the non-dying uninformed is equivalent to holding their population average trees, those they hold from the previous even day or with which they were born, and only selling those trees purchased on odd days.
14
informed are selling trees they know to be lemons to traders who believe that the trees are cherry with probability q1 > 0. Incentive compatibility of the uninformed strategy follows from the non-dying uninformed being indifferent between pt fruit and a tree of quality qt at date t. On even days they are indifferent between p0 fruit and trees of quality γ and so, on even days, must strictly prefer p0 fruit to trees of quality q1 , so they sell odd day trees on even days. By the same argument, on odd days, they must strictly prefer trees of quality γ to p1 fruit, so they don’t sell population trees on odd days. Before showing incentive compatibility for the informed it is useful to have expressions for prices on odd and even days. The non-dying uninformed are making speculative purchases with an intent to resell the following day when prices are high. Their hope is that the tree won’t mature before they have a chance to sell it and claim the capital gains. Setting p1 equal to the expected return then yields: p1 = µ(l + q1 ∆) + (1 − µ)p0
(27)
The price on even days is lower than the value, (l + γ∆), of a population tree’s dividend stream because the bearer suffers a capital loss if they die on an odd day before the tree has matured. There are four disjoint outcomes for an uninformed trader holding a population tree:
Day of Event
Event
Expected Payoff
Probability
Odd
Tree Matures
(l + γ∆)
µ
Odd
Tree Doesn’t Mature Trader dies
p1
(1 − µ)δ
Even
Tree Matures
(l + γ∆)
(1 − µ)(1 − δ)µ
Even
Tree Doesn’t Mature
p0
(1 − µ)2 (1 − δ)
Setting price equal to expected value yields
p0 = µ(l + γ∆) + (1 − µ)δp1 + (1 − µ)(1 − δ)µ(l + γ) + (1 − µ)2 (1 − δ)p0 .
(28)
Substituting equation (27) for p1 in (28) and rearranging gives the following expression for price on even days:
15
p0 = l + γ∆ − (γ − q1 )
δ(1 − µ) ∆. 2−µ
(29)
Which is the expected value of a population tree’s dividend stream less the expected capital loss from having to sell in the event of dying on an odd day. It is worth noting for future reference that both p0 and p1 are affine functions of q1 . It is easy to check that the price does in fact oscillate. From equation (27), p0 > p1 if and only if p0 > (l + q1 ∆). Subtracting l + q1 ∆ from (29) and rearranging yields � � δ(1 − µ) ∆, p0 − (l + q1 ∆) = (γ − q1 ) 1 − 2−µ which is greater than zero for q1 < γ. In any feasible saw-tooth equilibrium the price on even days is higher than the price on odd days. Returning to incentive compatibility, if an informed trader purchases a cherry tree on an odd day they can always sell on the subsequent day if it does not mature. Hence, the value of a cherry tree to an informed trader on an odd day is bounded below by µ(l + ∆) + (1 − µ)p0 > p1 , i.e. it is always optimal for non-dying informed traders, on odd days, to exchange all their fruit for cherry trees. From this, on any odd day, informed traders either exchange their portfolio for cherry trees or, if they are dying, exchange their portfolio for fruit, which they then consume. In either event the informed traders utility is linearly increasing in the market value of their portfolio that day. Given, the optimal behaviour on odd days, the non-dying informed traders’ decision problem on the even day is to maximise the expected value of their portfolio at price p1 on the subsequent odd day. Returns are linear so we can restrict attention to the decision of holding p0 fruit versus holding a single cherry tree at the end of the even day. The expected market value of a cherry tree held over from the even day is µ(l + ∆) + (1 − µ)p1 . Therefore, the informed traders’ strategy is incentive compatible if and only if p0 ≥ µ(l + ∆) + (1 − µ)p1 . Using the price equations, (27) and (29), to substitute out p0 and p1 above and rearranging gives the following incentive compatibility condition for informed traders: 0 ≤ F ≡ −(1 − γ) + (γ − q1 )(1 − δ)(1 − µ).
(30)
We will show later that given the assumptions in section 2 this condition always holds. 16
4.2
Market Clearing
The total equilibrium stocks of fruit held over even nights by informed traders and uninformed traders are W0 and Y0 respectively. The total equilibrium stock of cherry W1 trees held over odd nights by informed traders is and the total equilibrium stock of p1 fruit held over odd nights is Y1 . Figure 3 shows the stocks and flows of trees and fruit on even days.
Figure 3: Stocks and Flows on Even Days Looking at figure 3, the non-dying informed exchange all unmatured cherry trees – both those held over from the odd day and those carried by the new borns – for fruit. The total fruit received is (1 − δ)[(1 − µ)
W1 + θµ]p0 . p1
The non-dying informed also receive (1 − δ)µ
W1 (l + ∆) p1
fruit from the cherry trees that matured on the morning of the even day. The informed had no fruit over the odd night and purchased no trees on the even day so the fruit 17
holdings of the informed over even nights is W0 = (1 − δ){
W1 [µ(l + ∆) + (1 − µ)p0 ] + θµp0 }. p1
(31)
Figure 4 shows the stocks and flows of trees and fruit on odd days.
Figure 4: Stocks and Flows on Odd Days Looking at figure 4, the non-dying informed exchange their fruit stock for (1 − δ)
W0 p1
cherry trees on the odd day; and gain (1−δ)θµ cherry trees from the non-dying newborn informed, of which a fraction (1 − γ)θµ were acquired by using the market to replace lemon trees with cherry. The informed cherry tree holdings over odd nights then is W1 W0 = (1 − δ)( + θµ). p1 p1
(32)
The informed hold no fruit over the odd night. We can now go on to define the market clearing conditions on odd days. In figure 4 we see the total number of trees sold by the dying and the newborn is: 18
+ (1 − γ)(1 − δ)θµ;
Tree Sales = δ from dying informed and uninformed
lemon trees from non-dying informed new-borns
(33)
and the quantity of these tress that are cherry is: Cherry Sales = γδ. cherry trees from dying informed and uninformed
(34)
The informed buy only cherry trees: Informed Cherry Purchases = (1 − δ)
W0 p1
+ (1 − γ)(1 − δ)θµ
cherry trees bought from fruit held over even nights by non-dying informed
cherry trees bought by non-dying informed new-borns (35) The uninformed purchase the residual trees, a fraction q1 of which are cherry: �� � � W0 + (1 − γ)(1 − δ)θµ Uninformed Cherry = q1 δ + (1 − γ)(1 − δ)θµ − (1 − δ) p1 Purchases Trees Sold − Informed Cherry Purchases � = q1
� W0 δ − (1 − δ) . p1 (36)
Hence, the market clearing condition for cherry trees on odd days6 is:
γδ Cherry Sales
� � W0 W0 + (1 − γ)(1 − δ)θµ + q1 δ − (1 − δ) . = (1 − δ) p1 p1 Informed Cherry Purchases
6
Uninformed Cherry Purchases (37)
Which also implies market clearing for lemon trees. Total lemon tree sales is: Lemon Sales = Tree Sales − Cherry Sales. Total lemon tree purchases is: Lemon Purchases = (1 − q ∗ )[Tree Sales − Informed Cherry Purchases]. Letting Lemon Sales = Lemon Purchases and rearranging yields equation (37).
19
W0 terms in the market clearing condition yields: p1
Collecting the
(γ − q1 )δ − (1 − γ)(1 − δ)θµ = (1 − q1 )(1 − δ)
Solving the steady state equations for W0 and yields:
W0 . p1
(38)
W1 W0 , (31) and (32), in terms of p1 p1
W0 � p1 − (1 − δ)2 [µ(l + ∆) + (1 − µ)p0 ] p1 = θµ(1 − δ) {(1 − δ)µ(l + ∆) + [1 + (1 − δ)(1 − µ)] p0 } Substituting out
(39)
W0 using (38), and rearranging yields: p1
˜ 1 ) ≡(1 − δ)2 (1 − q1 )θµ {(1 − δ)µ(l + ∆) + [1 + (1 − δ)(1 − µ)]p0 } Φ(q � − p1 − (1 − δ)2 [µ(l + ∆) + (1 − µ)p0 ] [(γ − q1 )δ − (1 − δ)(1 − γ)θµ] =0
(40)
˜ 1 ) is quadratic in q1 as both p0 and p1 are affine functions of q1 : Φ(q ˜ 1) = a Φ(q ˜2 (q1 )2 + a ˜ 1 q1 + a ˜0
(41)
where
a ˜2 =
δµ∆ � (2 − µ) − [1 + (1 − δ)(1 − µ)](1 − δ)2 θ(1 − µ) 2−µ + δ 3 ∆(1 − µ)2
2−δ 2−µ
>0
(42)
a ˜2 > 0 follows from [1 + (1 − δ)(1 − µ)] < 2 − µ and by assumption 3 a ˜0 < 0. As in the ˜ constant price equilibrium, Φ(0) < 0 and the co-efficient on the quadratic component ˜ is positive so we can show a unique q1 ∈ [0, γ] solves the quadratic if Φ(γ) > 0. 20
Examining (40) it is clear that the argument used in the constant price equilibrium ˜ N ) > 0 so there exists a unique q1 ∈ (0, γ) also applies here: q1 = qN ∈ (0, γ) and Φ(q that solves the quadratic. Examining (38) the left hand side is positive where q1 ∈ (0, qN ). Therefore where ˜ q1 solves Φ(.) the fruit holdings of the informed over even nights is positive, W0 > 0. This also implies that the odd night cherry holdings for the informed is positive at the solution as it follows from (32) that: � � W1 (W0 > 0) ⇒ >0 . p1 Over even nights the uninformed hold the entire stock of trees in the economy. Over odd nights the uninformed hold the entire stock of lemon trees and all those cherry trees not held by the informed. The stock of cherry trees held by the uninformed over odd nights is:
W1 γ− p1
� = (1 − δ)(1 − µ)γ + (1 − δ)γ(1 − θ)µ + q1
Uninformed cherry trees held over odd nights
Residual stock from even night
Endowment of non-dying new-borns
W0 δ − (1 − δ) p1
Cherry trees purchased by uninformed (43)
The right hand side is positive if the uninformed purchase a positive amount of cherry trees. Rearranging the market clearing condition (37): � � � W0 W0 (γ − q1 ) δ − (1 − δ) = (1 − γ)(1 − δ) θµ + . p1 p1 The right hand side positive so it follows that �
δ − (1 − δ)
(44)
W0 > 0, p1
and hence cherry purchases of the uninformed on odd days are greater than zero. That is, the uninformed hold a positive stock of cherry trees over odd nights. The uninformed hold weakly positive stocks of fruit over even and odd nights: Y0 > 0 and Y1 > 0. Over even nights
Y0 =(1 − δ)Y1 + +(1 − δ)[ fruit from maturing trees of the uninformed ] −p0 [Number of trees sold excluding the sales of the non-dying uninformed] (45) 21
�
fruit. Before the market on even days the market value of all the trees in the economy not owned by the non-dying uninformed is the expression on the third line. On the odd days, the non-dying uninformed keep fraction (1 − δ) of the fruit held over the even night. As they hold all trees in the economy over even nights the nondying uninformed receive a fraction (1 − δ) of all the fruit from maturing trees in the economy. They also purchase all the trees sold by the dying less those bought by the informed. Over odd nights the uninformed fruit holding then is
Y1 = (1 − δ)Y0 + (1 − δ)µ(l + γ∆) − p1 (δ − (1 − δ)
W0 ). p1
(46)
The uninformed hold over odd nights, as stated earlier, [(1 − δ)(1 − µ) + (1 − δ)(1 − θ)µ] trees of quality γ and W0 δ − (1 − δ) p1 trees of quality q1 . This implies that the uninformed maturing trees yield µ(1 − δ)[(1 − µ) + (1 − θ)µ](l + γ∆) + µ[δ − (1 − δ)
W0 ](l + q1 ∆) p1
fruit on even days. Excluding the sales of the non-dying uninformed, the trees sold on even days are those sold by the dying and those sold by the non-dying uninformed, which is a total of δ + (1 − δ)2 (1 − µ)
W0 + (1 − δ)2 (1 − µ)θµ + (1 − δ)θµ p1
trees. Using these values and substituting for Y1 in equation (45) using equation (46) we get
W0 ]}+ Y0 =(1 − δ){(1 − δ)Y0 + (1 − δ)µ(l + γ∆) − p1 [δ − (1 − δ) p1 � � W0 ](l + q1 ∆) +(1 − δ) µ(1 − δ)[(1 − µ) + (1 − θ)µ](l + γ∆) + µ[δ − (1 − δ) p1 � � W0 2 2 −p0 δ + (1 − δ) (1 − µ) + (1 − δ) (1 − µ)θµ + (1 − δ)θµ . (47) p1 Substituting for p1 above with equation (27) and rearranging implies Y0 ≥ 0 if and only if µ(1 − δ)2 (l + γ∆)(2 − θµ) ≥ p0 [δ + (1 − δ)θµ][1 + (1 − δ)(1 − µ)]. 22
Given that p0 ≤ (l + γ∆) a sufficient condition for Y0 ≥ 0 is µ(1 − δ)2 (2 − θµ) ≥ [δ + (1 − δ)θµ][1 + (1 − δ)(1 − µ)] or, δ ]−θ >0 µ(1 − δ)
[1 −
(48)
which is true by assumption 2. Assumption 2 also implies that Y1 ≥ 0. The value of Y0 ≥ 0 that minimises Y1 is Y0 = 0. Putting this into equation (46)and rearranging yields Y1 = [(l + γ∆)(1 − δ)µ − δp1 ] + (1 − δ)W0 . Therefore Y1 ≥ 0 if (l + γ∆)(1 − δ)µ − δp1 . Given (l + γ∆) ≥ p1 a sufficient condition for Y1 ≥ 0 is µ(1 − δ) > δ , which is weaker than assumption 2. It still remains to demonstrate that the equilibrium behaviour for the informed is incentive compatible. In particular that: 0 ≤ F ≡ −(1 − γ) + (γ − q1 )(1 − δ)(1 − µ),
(49)
˜ 1 ) = 0 for some q1 ∈ (0, γ). where Φ(q F is decreasing in q1 . Define, qF as that value of q1 which implies F = 0: qF ≡ γ − Observe that qF > 0 where γ>
(1 − γ) . (1 − δ)(1 − µ)
(50)
1 1 + (1 − δ)(1 − µ)
which is assumption 4. From rearranging (18) and subtracting qF : q N − qF =
� � (1 − γ) δ − (1 − δ)2 µ(1 − µ)θ . δ(1 − δ)(1 − µ)
Which is greater than 0 as we know from assumption 1 that δ > (1 − δ)2 µ. ˜ 1 ) = 0. This can be As qN > qF we must demonstrate that q1 ∈ [0, qF ] solves Φ(q ˜ done if it is demonstrated that Φ(qF ) > 0, i.e.
23
Figure 5 ˜ F ) > 0 and hence there exists a unique It can be shown that assumption 5 implies Φ(q ˜ incentive compatible q1 ∈ [0, γ] that solves Φ(q1 ) = 0.
5
A Numerical Example
Suppose an economy in which 1% of the population is informed; there are 50% more cherry trees than lemon and each cherry tree produces 50% more fruit than a lemon. Finally, one tree matures for every 10 that don’t and 1 trader dies for every 20 that don’t. Or:
µ = 1/11 δ = 1/21 γ = 0.6 θ = 0.01 l=1 ∆ = 0.5 In the constant price equilibrium prices and qualities are:
q ∗ = 0.57 p∗ = 1.28 (51) 24
In the saw-tooth equilibrium prices and qualities are:
q0 q1 p0 p1
= 0.6 = 0.12 = 1.29 = 1.27
The price on odd days is 2% lower than on even days. From within a completely stationary environment prices cycle deterministically from high to low to high.
25
References D Abreu and MK Brunnermeier. Bubbles and Crashes. Econometrica, 71(1):173–204, 2003. GA Akerlof. The Market for ”Lemons”: Quality Uncertainty and the Market Mechanism. The quarterly journal of economics, 1970. James Dow. Is Liquidity SelfFulfilling?*. The Journal of Business, 77(4):895–908, 2004. Andrea L. Eisfeldt. Endogenous liquidity in asset markets. The Journal of Finance, LIX(1), 2004. Veronica Guerrieri and R Shimer. Dynamic Adverse Selection: A Theory of Illiquidity, Fire Sales, and Flight to Quality. 2013. I Hendel and A Lizzeri. Adverse Selection in Durable Goods Markets. American Economic Review, 89(5):1097–1115, 1999. Igal Hendel, Alessandro Lizzeri, and Marciano Siniscalchi. Efficient Sorting in a Dynamic Adverse-Selection Model. Review of Economic Studies, 72(2):467–497, April 2005. ISSN 0034-6527. RJ Shiller. Do Stock Prices Move Too Much to be Justified by Subsequent Changes in Dividends? The American Economic Review, 71(3):421–436, 1980. RJ Shiller. Market volatility. MIT Press, 1992.
26
Appendix Proposition 1 There exists a set of parameters that satisfy assumptions 1 through 5. To show this set of parameters exist consider the case where ∆ → 0. Lemma 1 If assumption 3 holds when ∆ → 0 then assumption 1 holds when ∆ → 0. Proof: (∆ → 0) ⇒ a0 → lθµ(1 − δ)[(1 − γ)δ + (1 − δ)µ] − lγδ 2 which is less than zero if and only if γδ 2 > θµ(1 − δ)[(1 − γ)δ + (1 − δ)µ]
(52)
Turn to a ˜0 from Assumption 3: (∆ → 0) ⇒ a ˜0 → (2 − δ)l{θµ(1 − δ)[1 − δγ] − γδ 2 } which is less than zero if and only if γδ 2 > θµ(1 − δ)[1 − δγ].
(53)
The right hand side of inequality (53) is larger than the right hand side of inequality (52). Therefore, (˜ a0 < 0) ⇒ (a0 < 0) �
Lemma 2 There exists a set of parameters consistent with assumption 3 and 5 as ∆ → 0. As ∆ → 0 assumption 3 holds if and only if
θ<
γδ 2 . µ(1 − δ)(1 − δγ)
As ∆ → 0 assumption 5 tends to 27
(54)
� � 0 < (2 − δ)l θµ(1 − δ)2 (2 − µ) − δ 2
(55)
Hence, assumption 5 holds if and only if δ2 < θ. µ(1 − δ)2 (2 − µ)
(56)
Therefore, there exist parameters compatible with assumptions 3 and 5 if and only if δ2 γδ 2 < θ < . µ(1 − δ)2 (2 − µ) µ(1 − δ)(1 − δγ)
(57)
(57) is possible for any set of parameters satisfying:
γ>
1 1 + (1 − δ)(1 − µ)
(58) �
Note that (58) in the proof of lemma 2 is assumption 4. Hence assumption 4 is compatible with assumptions 3 and 5. From lemma 1 it then follows that there is a set of parameters consistent with assumptions 1, 3,4 and 5. Finally, we turn to assumption 2:
θ <1−
δ . (1 − δ)µ
(59)
The lower bound on a value for θ compatible with all five assumptions, as a function of the other parameters when ∆ rightarrow 0, is given by assumption 5: δ2 < θ. µ(1 − δ)2 (2 − µ)
(60)
δ2 δ <θ <1− 2 µ(1 − δ) (2 − µ) (1 − δ)µ
(61)
There exists a θ such that
28
when δ is sufficiently small relative to µ. There exists a γ such that assumption 4 is satisfied for any pair of µ and δ. Hence there exists a set of parameters compatible with assumptions 2 and 4. From lemma 2 assumption 4 implies there exists parameters that satisfy assumptions 3 and 5 when ∆ rightarrow 0. From 1 assumption 3 implies assumption 1 when ∆ rightarrow 0. �
29