Semantic Characteristics of NLP-extracted Concepts in Clinical Notes vs. Biomedical Literature Stephen Wu, PhD, Hongfang Liu, PhD Department of Health Sciences Research, Mayo Clinic, Rochester, MN Abstract Natural language processing (NLP) has become crucial in unlocking information stored in free text, from both clinical notes and biomedical literature. Clinical notes convey clinical information related to individual patient health care, while biomedical literature communicates scientific findings. This work focuses on semantic characterization of texts at an enterprise scale, comparing and contrasting the two domains and their NLP approaches. We analyzed the empirical distributional characteristics of NLP-discovered named entities in Mayo Clinic clinical notes from 20012010, and in the 2011 MetaMapped Medline Baseline. We give qualitative and quantitative measures of domain similarity and point to the feasibility of transferring resources and techniques. An important by-product for this study is the development of a weighted ontology for each domain, which gives distributional semantic information that may be used to improve NLP applications. Introduction Natural Language Processing (NLP) is crucial to clinical informatics because information that is stored in clinical notes is too massive to be humanly comprehensible, but too complicated to be directly interpreted by a machine. Enterprise-level concept extraction systems like cTAKES [1] have begun to process vast amounts of clinical data, but the accuracy of their output has been evaluated on comparatively small amounts of annotated data. An alternative strategy is to limit evaluations to use cases, describing NLP systems’ effects on downstream applications. We may then ask: How can clinical NLP output be evaluated at an enterprise level? The same scenario arises for documents in other domains as well. Most notably, NLP in the biomedical literature domain seeks to understand the results of prolific biomedical research. Ultimately, information from both clinical and biomedical domains may be used in furthering the science of healthcare delivery. But Meystre, et al. have clearly distinguished between the clinical and biomedical domains, pointing out divergent characteristics such as misspellings, ungrammaticality, the use of shorthand, informal templates, and diversity of input sources [2] . Accordingly, DemnerFushman and colleagues have found that it is difficult to apply certain question-answering tools across domains due to abbreviations [3] . There are substantial patient privacy issues associated with clinical texts that are not present for published biomedical literature. These are practical issues that make cross-pollination difficult, but the results reported here focus on the big picture of semantic distance between the two domains. This study empirically compares and contrasts the aggregate characteristics of NLP-discovered named entities in clinical and biomedical text. It is therefore the first enterpriselevel evaluation of NLP output, and suggests where transferability between the two domains may be easier or harder. For clinical data, ten years of Mayo Clinic’s clinical notes have been processed by a production-level precursor to cTAKES [4] . For biomedical data, we use the output of MetaMap [5] on Medline/PubMed abstracts, which contains most of the biomedical citations to date. The applications of methods used here are not limited to cross-domain comparisons. Comparisons of subdomains [6] , sections of a document [7] , and longitudinal semantic shift [8] have all been attempted. We also expect that similar studies would be used to compare successive versions of NLP output at an enterprise level. It would be prudent to test NLP components against a regression set of data as they improve, but the integrity of extracted semantic information in a large-scale deployment is rarely studied. Indeed, the biases of each NLP system can even be seen in this study, as data is prepared for cross-domain comparison. A more practical use of the concept distributions we analyze here is that they entail the building of a weighted ontology, which may be used for, e.g., concept similarity metrics, document similarity metrics, or use case-specific terminology subsetting. As statistical processing and machine learning techniques increasingly dominate NLP, a means for
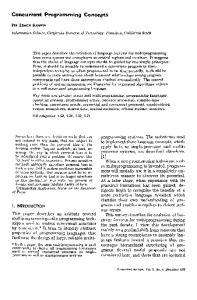
merging these methodologies with expert-curated ontological information is necessary. Berndt, et al.’s recent work [9] calls information at this scale “macro-ontological,” and rightly points out that it may be inserted into the text mining process. Similar to their work, the concept weights gathered here are in a format that completely preserves the ontological structure; however, our counts provide empirical distributional semantic information, and are based on corpora rather than the structure of the ontology itself. Structure-based weights and distribution-based weights are likely complementary, though a thorough exploration is beyond the scope of this discussion. The remainder of this paper will proceed as follows: the data and processing for the experiment will be described, followed by the resulting distributional characteristics in qualitative and quantitative form. Finally, we will discuss the implications of the results, and draw conclusions about the similarities and differences between the two domains. Experimental Procedure The distributional comparison between clinical and biomedical texts was carried out according to Figure 1.
Mayo MCLSS 2001-2010
Medline/ Pubmed -2011
Mayo Clinical Notes Index (CNI)
MetaMap
Query counting concepts
Scripts counting concepts
Filter by SNOMED concepts and semantic type
Hierarchical propagation of counts
Depths and strings
Unpropagated counts & data Propagated counts & data
Hierarchical propagation of counts
Depths and strings
Unpropagated counts & data Propagated counts & data
Figure 1: Block diagram of data collection for clinical (top) and biomedical (bottom) data. The data source for clinical text was Mayo Clinic clinical notes between 1/1/2001–12/31/2010, retrieved from the Mayo Clinic Life Sciences System (MCLSS). MCLSS stores processed data from a comprehensive snapshot of Mayo Clinic’s service areas, excluding only microbiology, radiology, ophthamology, and surgical reports. Additionally, each possible note type at Mayo was represented: Clinical Note, Hospital Summary, Post-procedure Note, Procedure Note, Progress Note, Tertiary Trauma, and Transfer Note. Biomedical text was from the 2011 Medline/Pubmed Baseline, which contains all 19,569,568 of the indexed citations (abstracts) to date. This similarly represents a comprehensive brush of different subfields in biology and clinical research. Both of these were pre-processed with the standard NLP tools in their respective domains. Mayo’s Clinical Notes Index (CNI) is a UIMA-based NLP pipeline [4] that may be considered an enterprise-level precursor to cTAKES [1] . For biomedical data, we used an existing repository1 of MetaMap’s [5] output on the Medline/Pubmed Baseline. Each system identifies named entities in its respective text, tying the term used in text to an ontology (e.g., SNOMED code or ULMS CUI). Our study is based primarily on the frequency of named entity usage in each corpus. The dashed line in Figure 1 indicates that the NLP processing was completed before this experiment. In fact, the results of CNI were stored in MCLSS, allowing us to query directly for counts of concept frequency in Mayo’s data. Biomedical data in the MetaMapped Medline Baseline was accessed in MetaMap Machine Output (MMO) format, and thus scripts had to be written to find the frequency of concepts discovered in Biomedical text. A further difference between Mayo data and Medline data is that CNI only performed concept identification for SNOMED codes in a limited set of semantic types, whereas MetaMap used any UMLS codes. Thus, some converting of data had to be done for clinical data, and some restricting of data had to be done for biomedical data. From this point, both data sources underwent the same processes — a hierarchcial propagation (described in the 1 Accessible
at http://skr.nlm.nih.gov/resource/MetaMappedBaselineInfo.shtml
following subsection), and depth and string lookups — to produce two output tables in each domain. The format of these output tables is similar to the UMLS Rich Release Format (RRF), as can be seen in the table below. CUI C0000726 C0000727 C0000729 C0000731 C0000733
TUI T029 T184 T184 T033 T037
Preferred Name Abdominal (qualifier value) [D]Acute abdomen (situation) [D]Abdominal cramps (situation) [D]Abdominal swelling (situation) Injury of abdomen (disorder)
Depth 8 10 4 11 10
Count 19,237,214 36,356 122,000 272,058 7389
Before we discuss the process of hierarchical propagation, a few more details should be mentioned pertaining to how we obtained the raw data. CUI. Mayo’s CNI concept identification output primarily uses SNOMED codes (UMLS 2005AA release) rather than the UMLS Concept Unique Identifiers. We mapped these codes to 2010AB CUIs that were also present in 2005AA. For Medline data, we used MetaMap’s 2010AB-based output CUIs; however, for fair comparison we eliminated CUIs not cross-indexed with SNOMED codes in the UMLS 2005AA release. TUI. Only certain Type Unique Identifiers (based on UMLS 2005AA) were used in CNI, and MetaMapped results were filtered to use only these as well. These were broken into 4 broad semantic groups, motivated by Bodenreider and McCray [10] : 1. Anatomical Sites: T021, T022, T023, T024, T025, T026, T029, T030 2. Procedures: T059, T060, T061 3. Disorders: T019, T020, T037, T046, T047, T048, T049, T050, T190, T191 4. Findings: T033, T034, T040, T041, T042, T043, T044, T045, T046, T056, T057, T184 Preferred Name. A “preferred” string representations for the CUI in question, based on MRCONSO.RRF from the UMLS 2010AB release. A synonym or abbreviation may instead be the actual term discovered in the text. For example, ‘allergy’ is mapped to the CUI for ‘hypersensitivity,’ and ‘cancer’ is mapped to ‘malignant neoplasm.’ Depth. This is the length of the longest path when traversing SNOMED ‘isA’ relationships (from MRREL.RRF, UMLS 2010AB release) from a node to its greatest ancestor. If a node has no parent, it will have a depth of 0. Count. A summed frequency of concepts for all documents in a domain. The unpropagated version is directly calculated from the output of NLP components, whereas the propagated version will be described in the following section. Both propagated and unpropagated frequencies give a numerical value to each concept. Portions of the ontology that are more commonly used (and therefore more “important”) have higher values. Therefore, each of these frequency distributions may be considered a weighted ontology. Hierarchical Propagation If a concept is present in text, it would be logical to say that the concept’s parents are implied. This is true as we move up the entire hierarchy of ‘isA’ relationships, so that an instance of a concept should add to the count of each of its ancestors. The result is propagated counts (the second and fourth outputs in Figure 1). As an example, consider “Acute abdominal pain” (SNOMED: 116290004, CUI: C07400577). There are four paths to the root, two of which are shown here. Concepts that are common between the two paths are shown in italics: 1. Acute abdominal pain ⊂ Abdominal pain ⊂ Pain of truncal structure ⊂ Finding of trunk structure ⊂ Finding of body region ⊂ Finding by site ⊂ Clinical finding ⊂ SNOMED CT Concept
2. Acute abdominal pain ⊂ Abdominal pain ⊂ Pain of truncal structure ⊂ Pain finding at anatomical site ⊂ Pain ⊂ Pain/sensation finding ⊂ Sensory nervous system finding ⊂ Neurological finding ⊂ Clinical finding ⊂ SNOMED CT Concept These multiple paths arise because each node in SNOMED can have multiple parents. The propagating of “Acute abdominal pain” counts is done recursively. First, each parent is considered. If the parent has previously been visited for the current count, it is skipped; otherwise, the count value is added to the count at that parent, and the parent’s parents are explored. Thus, every node that is an ancenstor of “Acute abdominal pain” has its count incremented exactly once for each occurrence of the concept. Results Our goal is a large scale comparison of unstructured text in clinical and biomedical domains, but such an empirical comparison is intrinsically limited to the corpora that are available. It is important, therefore, to note some of the characteristics of the representative corpora. These are summarized in Figures 2(a) and 2(b).
# of documents # of char Char per doc CUIs represented Concept mentions Mentions per doc Mentions per char
Mayo 41,300,263 105,744,557,997 2,560.385 60,085 3,607,188,946 87.34058 0.0341129
Medline 19,569,568 15,799,786,165 807.365 57,635 387,189,859 19.78530 0.02450602
Unused CUIs 116,270
Mayo only 16,963
Mayo & Medline 43,122
Medline only 14,513
(a) (b)
Figure 2: Corpus-wide statistics (a) For size and ‘density’ of each corpus, and (b) showing the domain-specific usage and overlap of codes. Note that the Mayo corpus has over twice as many documents, and over three times more text per document, for an overall difference of approximately 6.7 times more text than in Medline. At the bottom of Figure 2(a), we can also see that the NLP techniques discover more concepts per unit of text in the clinical text than in biomedical text (within the 4 semantic groups). The Venn Diagram of Figure 2(b) has an outer box corresponding to all UMLS Codes that are both cross-indexed with SNOMED and in the four targeted semantic groups. Not shown in the box is the fact that out of the 190,868 CUIs (unused + used in either corpus) of this appropriate semantic type, 26,885 were anatomical sites, 46,404 were procedures, 78,784 were disorders, and 38,795 were findings. The left circle is unpropagated counts on Mayo clinical notes, where 60,085 CUIs were utilized; this amounts to 31.4% usage out of 190,868 CUIs. On the right, biomedical text in the Medline/Pubmed Baseline used 57,635 CUIs for 30.2% usage. The semantic contents of the four sets of data (unpropagated/propagated clinical, unpropagated/propagated biomedical) can be compared and contrasted both qualitatively and quantitatively. First, it is illustrative to consider what concepts are most frequently used in each domain, shown in Table 1. We have included both propagated and unpropagated counts here for completeness, though (a) and (b) are sorted on unpropagated counts, while (c) and (d) are sorted on propagated counts. The latter tables are included to answer whether differences in domain vocabularies arise from discussion on fundamentally different topics, or from stylistic differences. On a more quantitative level, Figure 3 gives two different perspectives on the concept distributions in the two domains. The x-axis of 3(a) is a ranked listing of concepts by frequency, so that the top 1,500 concepts are shown with their frequencies. The frequencies (y-axis) for Medline have been inflated by a factor of 9.32 so that there would be as
CUI
Preferred Name
d
Unprop.
Prop.
(a) Clinical text, sorted by unpropagated concepts C0226896 T029 Oral cavity structure C1278910 T029 Entire oral cavity C1267547 T029 Entire mouth region C0087111 T061 Therapeutic procedure C0543467 T061 Surgical procedure C0040732 T061 Transplantation C0020517 T046 Hypersensitivity C0011884 T047 Diabetic retinopathy NOS C0006826 T191 Malignant neoplasm of unspecified site C1457887 T184 [D]Symptoms NOS C0013404 T184 Dyspnea C0262926 T033 History of
13 14 13 4 5 6 9 15 10 4 9 3
32,236,636 32,235,510 32,117,398 56,879,390 45,569,157 23,031,955 100,468,522 72,572,180 40,876,164 52,146,747 51,930,291 49,538,699
76,282,880 32,235,510 32,117,398 94,755,125 140,087,294 26,125,497 103,987,580 72,591,107 151,723,239 52,146,747 54,364,872 49,538,699
(b) Biomedical text, sorted by unpropagated concepts C0007634 T025 Cell Anat. C1269647 T025 Entire cell C0040300 T024 Body tissue structure C0087111 T061 Therapeutic procedure Proc. C0185117 T061 Expression - action C0002778 T059 Analysis C0012634 T047 Disease Disord. C0027651 T191 [M]Neoplasms NOS C0332157 T037 Exposure to C0086045 T041 Concentration Find. C0445223 T033 Related C0021469 T044 Inhibition
4 5 4 4 8 5 5 9 4 7 9 6
6,953,646 1,845,159 1,786,460 6,692,103 3,265,739 3,003,052 2,314,616 2,092,336 1,681,851 3,977,538 2,962,048 2,511,785
25,396,028 13,835,867 26,631,714 9,853,609 3,265,739 3,005,552 67,806,901 9,610,846 1,681,851 3,977,538 2,962,048 2,511,785
(c) Clinical text, sorted by propagated concepts C0005898 T029 Body region structure Anat. C0229962 T023 Body part structure C0460002 T022 Body system structure C0418956 T061 Regimes and therapies Proc. C0543467 T061 Surgical procedure C0087111 T061 Therapeutic procedure C1260954 T190 Morphologically altered structure Disord. C0333343 T190 Cavity C1290837 T047 Disorder of trunk C0427350 T033 Clinical history and observation findings Find. C0577559 T033 Mass of body structure C0333949 T040 Growth alteration
4 5 4 2 5 4 2 5 8 5 6 4
3,262 28,620 9,553 12 45,569,157 56,879,390 1,288 312,953 3 7 9,789,342 24
640,580,828 603,753,689 467,307,325 156,928,734 140,087,294 94,755,125 517,592,257 217,120,971 165,081,858 306,807,228 217,237,523 209,167,102
(d) Biomedical text, sorted by propagated concepts C0460002 T022 Body system structure Anat. C0005898 T029 Body region structure C0229962 T023 Body part structure C0022885 T059 Laboratory procedure - general - NOS Proc. C0543467 T061 Surgical procedure C0087111 T061 Therapeutic procedure C0012634 T047 Disease Disord. C1260954 T190 Morphologically altered structure C0332447 T190 Morphologically abnormal structure C0574125 T033 Functional finding Find. C0577559 T033 Mass of body structure C0333949 T040 Growth alteration
4 4 5 6 5 4 5 2 3 6 6 4
23,908 9,789 6,571 2,725,576 2,326,931 6,692,103 2,314,616 43,155 3,026 2,383 553,914 406
63,103,622 54,630,436 51,912,244 14,950,364 13,760,485 9,853,609 67,806,901 35,060,838 33,734,763 21,298,135 14,748,953 14,355,901
Anat.
Proc.
Disord.
Find.
Type
Table 1: Highest-frequency concepts with depth d and 2 types of frequency counts. Subtables have 3 CUIs each for Anatomical Sites, Procedures, Disorders, and Findings. (a) and (b) are sorted within each semantic group by unpropagated counts of mentions in clinical and biomedical text, respectively. (c) and (d) are sorted within each semantic group by propagated counts, giving a sense of common topics for each domain.
many concept mentions as there are in the Mayo corpus. Additionally, the top of the plot has been truncated to focus on the characteristics at lower frequencies. It should be observed that at approximately rank 250, the two lines meet, and beyond that biomedical concepts are consistently used more frequently than clinical concepts.
8000 6000 4000
Number of codes
8e+06
0
6e+06
0
1
2
3
4
5
6
7
8
9 10
12
14
16
18
20
22
24
26
28
30
32
4e+06
Frequency (log scale)
8000
Propagated Frequency of Codes in Clinical vs. Biomedical Text
1000
6000
1500
0
500
4000
Number of codes
0e+00
0
Clinical Biomedical
2000
2e+06
Adjusted frequency
Clinical Biomedical
2000
1e+07
Frequency of Code Usage in Clinical vs. Biomedical Text Clinical Biomedical
CUI Rank (by frequency)
(a)
0
1
2
3
4
5
6
7
8
9 10
12
14
16
18
20
22
24
26
28
30
32
Frequency (log scale)
(b)
Figure 3: Alternative views of the domain-specific differences in frequency distribution. (a) Adjusted frequencies of the top 1,500 codes in each domain. (b) Frequency histograms for propagated and unpropagated codes in each domain. Figure 3(b) displays two histograms, each comparing the two domains. The x-axes represent how often a code was used in each respective corpus, and the y-axes indicate how many of the 60,085 (for clinical) or 57,635 (for biomedical) codes were used with that range of frequencies. Thus, there are over 8,000 clinical codes that were only used a few times, but there were only a few codes that were used with extremely high frequency. The x-axis is on a log2 scale, and numbers under each frequency bin represent any frequency with ⌈log2 C⌉, where C is the raw count. We may also be interested in considering what types of concepts are unique to each domain. The most frequent specific codes for each domain are shown in Table 2. CUI
Type
C1290956 C0021485 C0449201 C0424927 C1313971 C0687058 C0016205 C1273875 C0423572 C1279702
T033 T061 T029 T033 T190 T029 T184 T033 T184 T047
C0007634 C0012634 C0439631 C0221198 C0021107 C0478530 C0205054 C0600688 C0460148 C0011581
T025 T047 T061 T033 T061 T033 T029 T037 T190 T048
Preferred Name Depth Most frequent concepts unique to clinical data Medication (IADL finding) 4 Injection of therapeutic agent 9 PER 3 Details of education 6 Abnormal tissue appearance 0 Depression (external anatomical feature) 6 [D]Flatulence, eructation and gas pain NOS 13 Values (community) 9 Pins and needles 11 Calorie overload 8 Most frequent concepts unique to biomedical data Cell 4 Disease 5 Primary operation 7 Lesion 4 Implantation 4 [X]Examination and observation for reason, unspecified 4 Portal 5 Toxic effect 4 Human body structure 4 Depressive disorder 8
Count (unprop.) 32,784,979 14,013,728 6,639,386 6,132,688 5,430,700 4,482,187 3,016,160 1,912,720 1,582,854 1,361,713 6,953,646 2,314,616 1,510,502 1,199,479 726,011 605,052 582,197 551,577 396,627 370,674
Table 2: The most frequent concepts that are only present in one domain.
4e+08 2e+08
Clinical Biomedical
0e+00
Adj. Mention Frequency
Further quantitative analysis of the concepts unique to each domain can be done — the plot in Figure 4 shows how many concept mentions were at a particular depth in the SNOMED hierarchy, where the depth in the hierarchy is assumed to be a reasonable measure of how specific a concept is (the higher the number, the more specific). This is noisy, however; for example, depths 0–3 focused concepts for which no parents were found.
0 1 2 3 4 5 6 7 8 9
11
13
15
17
19
21
23
25
27
29
31
33
Depth
Figure 4: Mention frequencies for codes of different depths in the SNOMED hierarchy, in clinical (left) and biomedical (right) text. Discussion We may draw interesting conclusions from the foregoing data. First, though, we should caution that because we used any CUI that appeared in both UMLS 2005AA and 2010AB for this study, there are several confounding variables besides the domain difference. For example, CNI’s SNOMED output might be mapped to a different UMLS code than the same string in MetaMap; or, codes may have been deprecated in usage between 2005AA and 2010AB. In any case, each NLP system has its own concept identification process, including synonymy and abbreviation detection and word sense disambiguation. Thus, the coding schema and bias of NLP systems is present in the data. For example, the presence of “diabetic retinopathy” as one of the overall most frequent codes in clinical text (72,572,180 mentions, i.e., more than once per document) was likely discovered as “DR.” and indicative of an error in abbreviation detection. Also, CNI allows multiple concept annotations on the same span, possibly inflating some of the counts. Irrespective of these shortcomings, the massive scale of data we have processed has allowed us to gain some big picture understanding of the differences between the domains and the quality of the NLP systems. Concept-level characteristics It is evident that there is significant overlap in the coverage of clinical and biomedical texts. From Figure 2(b), we can see that the majority of codes found were held in common — 71.8% of the codes used in clinical text were also used in biomedical text, and 74.8% of the biomedical codes were shared with clinical text. Additionally, where the domains differ in the codes they use, they do so in an understandable way. Recall that we had filtered MetaMap output based on the 2005AA version of the UMLS for the sake of fair distributional comparison. If we modify the experimental setup to use the updated 2010AB version of the UMLS that was used in MetaMap, the shared proportion is 71.8% for clinical and 70.4% for biomedical texts, leaving about the same amount of semantic content unique to each domain. This implies that each domain has roughly the same amount of semantic coverage, i.e., that the contents of clinical notes and biomedical abstracts are similarly diverse and broad in scope. Qualitatively, we may consider Tables 1(c)–(d), which contain propagated counts that give a sense of what types of concepts are most frequently mentioned. “Mass of body structure” and “Growth alteration” show up on both Findings lists, and similar correspondences are frequent in the propagated concept counts. Differences show up here as well, in a manner quite telling of the underlying domains — these propagated Findings lists are headed by “Clinical history
and observation findings” for clinical text, and “Functional finding” for biomedical text. However, the most frequent propagated concepts are infrequently mentioned in the text. Thus, major differences in concept usage are seen in the unpropagated concepts of Tables 1(a)–(b). These tables have very little commonality; Findings that concern clinical texts may be general (e.g., “symptoms”) or specific (e.g., “dyspnea”), but are very different from biomedical Findings (e.g., “concentration,” “inhibition”). The most frequent domain-unique concepts in Table 2 show the extreme cases of this semantic divergence between domains. “Medication” would not be used as a finding in biomedical text, whereas “cell” is rarely used in clinical text. Further, terms like “flatulence” and “pins and needles” deal with very human-oriented concepts, and this patientcentered perspective is lacking from the biomedical domain. Distributional characteristics We can move beyond individual concepts and look at the similarities and differences between the domains at an even broader scale. Consider the distribution of frequency-ranked concepts in Figure 3(a). Both Mayo data and Medline exhibit the same shape of distribution, with a steep drop at the beginning, and then a long tail. This does not quite follow Zipf’s law, as natural text would, but this is likely due to the fact that we are constrained to finite terminologies — thus, the tail must end. In the face of bias or errors in the NLP systems or coding methods, the fact that these distributions are not altogether incongruous reaffirms that the NLP methodologies have extracted reasonable information. The differences in Figure 3(a) are also instructive. The Mayo clinical data has a steeper curve, meaning that it has a more skewed distribution than biomedical data. As pointed out before, the two curves meet at around 250. The top 250 clinical terms have much more frequency mass than the top 250 biomedical terms; the difference is so stark that it takes the roughly 60,000 concepts in the tail to make up the difference. This implies that when training or evaluating NLP systems in clinical text, a larger sample of text (than in biomedical text) is needed in order to find rare terms. The skewed characteristic is also observable in the histograms of Figure 3(b), where the y-axis is now the number of CUIs rather than the number of mentions. Again, we have similar distributional shapes for the two domains. Medline, however, has a more balanced usage of codes, exhibited by the higher bars in the middle of the plot that make it closer to a normal distribution. Since extracted concepts in clinical data is meant to represent actual phenotypes, we may conclude that clinical phenotypes are in fact extremely skewed. Many terms (e.g., Aleutian disease, basophilic hyperplasia) are very uncommon, whereas a few terms (e.g., pain) are very common. Despite this, the fact that both domains have overall similar distributional shapes indicates that methodologies used in one domain may be helpful in the other. Style characteristics A careful examination of Figure 3(b) also has implications about the style in the clinical vs. biomedical domains — are the terms used in each domain more general and abstract, or more focused and precise? First, note that propagation has the effect of spreading out the distribution; this spreading is only possible by an increase of frequency counts for non-leaf nodes in the hierarchy. The spreading effect is greater in the clinical codes. This means that many non-leaf nodes (more general terms) are used infrequently in the raw text; however, they are implied by the other terms. A smaller spreading effect in biomedical CUIs means that more general terminology has already been used to some degree. The depth charts of domain-unique codes in Figure 4 confirm this observation, but add a little more information. Medline abstracts seem to have both a larger number of shallow-depth codes, as we would expect from the previous observations. However, biomedical data also seems to have a longer depth ‘tail’ — clinical concepts are more focused in the middle depths. To the degree that depth measures general vs. focused terminology (it is, in fact, a very noisy measure), word senses in biomedical text seems to be more skewed, such that they are either (loosely) very general or very specific. This confirms intuition about the nature of the document sources. In clinical notes, commonly observed phenomena
are relatively precise. Physicians are able to deal with some ambiguity because of contextual information, and therefore do not need to use concepts that are overly specific. In biomedical literature, broad-brushing descriptions are complemented by extremely precise, technical language (e.g., “Highly pathogenic avian influenza viruses (HPAIVs) cause severe disease in humans”). Conclusion In this work, we have compared and contrasted large-scale NLP results in the clinical and biomedical domains. We discovered large amounts of overlap in the general semantics of the two domains, and frequency distributions were shaped similarly. However, the two types of data differed significantly in the mentioned concepts, how often semantic concepts were invoked, and the generality of terms used. The similar distributional characteristics, paired with understandable domain-specific semantic variation, indicate that NLP techniques are significantly capturing the content of each domain. This points to the ability to share techniques and resources between the two fields, but the likely need for fine-tuning. In preparing each corpus for semantic comparison, we have also constructed empirically-determined weighted ontologies, which may make practical use of these domain characteristics in future work. Acknowledgements The authors would like to thank Vinod Kaggal, Kevin Peterson, Dr. Alan Aronson, and Dr. Chris Chute for making this study possible. References 1. G.K. Savova, J.J. Masanz, P.V. Ogren, J. Zheng, S. Sohn, K.C. Kipper-Schuler, and C.G. Chute. Mayo clinical Text Analysis and Knowledge Extraction System (cTAKES): architecture, component evaluation and applications. Journal of the American Medical Informatics Association, 17(5):507, 2010. 2. S.M. Meystre, G.K. Savova, K.C. Kipper-Schuler, and JF Hurdle. Extracting information from textual documents in the electronic health record: a review of recent research. Yearb Med Inform, 3:128–144, 2008. 3. D. Demner-Fushman, J.G. Mork, S.E. Shooshan, and A.R. Aronson. UMLS content views appropriate for NLP processing of the biomedical literature vs. clinical text. Journal of Biomedical Informatics, 43(4):587–594, 2010. 4. G. Savova, K. Kipper-Schuler, J. Buntrock, and C. Chute. UIMA-based clinical information extraction system. Towards Enhanced Interoperability for Large HLT Systems: UIMA for NLP, 39, 2008. 5. A.R. Aronson. Effective mapping of biomedical text to the UMLS Metathesaurus: the MetaMap program. In Proceedings of the AMIA Symposium, page 17. American Medical Informatics Association, 2001. 6. Tom Lippincott, Diarmuid O. S´eaghdha, Lin Sun, and Anna Korhonen. Exploring variations across biomedical subdomains. In Proceedings of the 23rd International Conference on Computational Linguistics, pages 689–697. Association for Computational Linguistics, 2010. 7. K.B. Cohen, H.L. Johnson, K. Verspoor, C. Roeder, and L.E. Hunter. The structural and content aspects of abstracts versus bodies of full text journal articles are different. BMC bioinformatics, 11(1):492, 2010. 8. J.B. Michel, Y.K. Shen, A.P. Aiden, A. Veres, M.K. Gray, J.P. Pickett, D. Hoiberg, D. Clancy, P. Norvig, J. Orwant, et al. Quantitative analysis of culture using millions of digitized books. Science, 331(6014):176, 2011. 9. D.J. Berndt, J.A. McCart, and S.L. Luther. Using Ontology Network Structure in Text Mining. In AMIA Annual Symposium Proceedings, volume 2010, page 41. American Medical Informatics Association, 2010. 10. O. Bodenreider and A.T. McCray. Exploring semantic groups through visual approaches. Journal of Biomedical Informatics, 36(6):414–432, 2003.