Semiconductors - Global
Industry Overview Equity | Global | Semiconductors 02 April 2014
Cycle has legs picks: TSMC, ASE, RFMD, SWKS, MTK, ARM, & add ASMPT Top We see a nice set-up for semi stocks going into the results season with most companies likely to beat expectations and guide favorably. Our latest global supply chain survey coupled with our three-day Asian technology conference (March 1821st) lead us to believe that demand is good while inventory is very low.
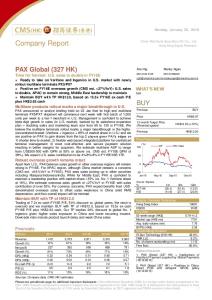
Inventory decline sharply QoQ We have captured 142 firms’ 4Q13 inventory after a slew of Taiwan hardware companies released consolidated financial results 31-March (reporting deadline). Aggregated inventory held by OEM, EMS distributors, and semicon companies declined by 6% QoQ which is the low-end of the last four years (Chart 1). Inventory measured in days decline form 95 days in 4Q12 to only 90 days in 4Q13.
Downstream DOI turns below-seasonal in 4Q13
Unauthorized redistribution of this report is prohibited. This report is intended for
[email protected].
Inventory data aggregated from 49 hardware (downstream) firms showed a decrease of 6.1% QoQ in dollar terms to US$67.2bn (in 4Q13). This was slightly above the five-year average of down 6.3% QoQ. DOI decreased 7.5 days QoQ to 28.4 days, below the five-year average of 33.5 days. All the subsectors’ DOI were below the five-year seasonal average, except for PC. DOI of the PC supply chain came back to seasonal after three sequential above-seasonal quarters. Wireless posted a well below-seasonal DOI in 4Q on strong demand, mainly led by Apple. There was a major inventory decline at EMS that came from Hon Hai (down 13.5% QoQ), Celestica (down 7.3% QoQ) and Jabil Circuits (down 5.9% QoQ).
Daniel Heyler >>
+852 2536 3416
Vivek Arya
+1 646 855 1755
Simon Dong-je Woo, CFA >>
+82 2 3707 0554
Research Analyst Merrill Lynch (Hong Kong)
[email protected] Research Analyst MLPF&S
[email protected]
Research Analyst Merrill Lynch (Seoul)
[email protected]
Adithya Metuku, CFA >> Research Analyst MLI (UK)
[email protected]
+44 20 7995 8323
Chart 1: Total reported tech inventory dollars
Semis inventory decreased 4.3% QoQ; DOI down 4.5 days Global semi inventory of 93 firms was down 4.3% QoQ to US$22.9bn in 4Q13 after a 3.0% increase in 3Q13. The change was well below the five-year average of up 0.7% QoQ. Furthermore, days of inventory (DOI) decreased 4.5 days QoQ, also far more than the five-year average of up 0.9 days. Additionally, absolute levels (66.6 days) were 2.1 days below the 5-yr average (64.5 days). Inventory held by global communication semi companies fell by 12.4% substantially below the typical 2.2% increase in 4Q13 driven by the strong demand for smartphones in China/EM.
Apple supply chain likely to drop sharply in 1Q14
Source: Company reports; BofA Merrill Lynch Global Research estimates, updated as of 31 Mar 2014
Report links: 3Q13 global inventory report (Nov 2013) 2Q13 global inventory report (Sept 2013) 1Q13 global inventory report (Jun 2013)
Global hardware revenue in our survey grew 18.4% QoQ in 4Q13, which was above the five-year average of up 9.7% QoQ. All subsectors recorded above-seasonal growth, except wireline. Wireless companies recorded strong growth of 34% QoQ versus the five-year average of 26% QoQ. Our global team has modeled wireline sales growth to exceed seasonality in 1Q14 but forecasts PC, wireless, distribution and EMS to be sub-seasonal.
This research report provides general information only. No part of this report may be used or reproduced or quoted in any manner whatsoever in Taiwan by the press or other persons without the express written consent of BofA Merrill Lynch. >> Employed by a non-US affiliate of MLPF&S and is not registered/qualified as a research analyst under the FINRA rules. Refer to "Other Important Disclosures" for information on certain BofA Merrill Lynch entities that take responsibility for this report in particular jurisdictions. BofA Merrill Lynch does and seeks to do business with companies covered in its research reports. As a result, investors should be aware that the firm may have a conflict of interest that could affect the objectivity of this report. Investors should consider this report as only a single factor in making their investment decision. 11373975 Refer to important disclosures on page 12 to 14. Link to Definitions on page 10.
S emic ondu c to rs - Glo bal 0 2 Ap ril 201 4
Overview
Chart 2: 4Q global inventory dollars
Absolute DOI is below seasonality except for PC
PC Supply Chain
We captured 49 out of 50 downstream companies, which account for about 99% the value of our global survey of OEM, EMS and distribution firms.
Wireline Equipment Supply Chain Wireless Supply Chain Distribution
30%
EMS
35%
12% 13% 10% Source: BofA Merrill Lynch Global Research, updated as of 10 Mar 2014
Chart 3: 4Q inventory days vs 5-year average 60
Inventory Days
50 40 30 20 10 0 PC
Wireline
Actual
Wireless
Distributors
EMS
Seasonality
Source: Company reports, BofA Merrill Lynch Global Research estimates, updated as of 13 Feb 2014
Total inventory value (dollars) for the reported technology companies decreased 6.1% QoQ to US$67.2bn during 4Q13. The QoQ change was in-line with the fiveyear seasonal (average) decrease of 6.3% QoQ. However, Inventory, as measured in days (DOI) for downstream companies, decreased by 7.5 days QoQ to only 28.4 days, which was well below their five-year seasonal average of 33.4 days. While foundry orders appear to be strong going into 2Q14, we expect semi sales to come in relatively strong for 2Q/3Q14 which should absorb much of the production. Our breakdown of DOI across different subsectors were all below the seasonal average, except for the PC supply chain, for which DOI has been above seasonality for seven sequential quarters due to continuously weak demand. Communication (wireline and wireless) companies reported surprisingly low DOI. Our continuously bullish view of China/EM mobile device demand is wellsupported by this data. We recognize that many private OEMS in China are not included in this data set but distributor and semi inventory will capture China/EM attributable to strong smartphone demand especially in emerging markets. DOI at distributors and EMS providers was also below seasonality. (Chart 2)
Strong wireless, ultra-low inventory (inc. Apple) Revenue for reported downstream tech companies grew 18.4% QoQ in 4Q13, on strong mobile demand and new product launches, which is above their five-year average of 9.7% QoQ. For 1Q14, these names are expected to see a 16.6% decline, below the five-year average of down 12.2% QoQ on seasonality. Only wireline is expected to grow (by 2% QoQ) in 1Q14 while other subsectors are expected to record QoQ declines.
Exhibit 1: Total downstream inventory days
Exhibit 2: Total downstream inventory dollars
Source: Company reports, BofA Merrill Lynch Global Research estimates
Source: Company reports, BofA Merrill Lynch Global Research estimates
2
S emic ondu c to rs - Glo bal 0 2 Ap ril 201 4
Semiconductor inventory We have captured 93 semi companies in our quarterly inventory survey. Both semiconductor inventory dollar and DOI declined in 4Q13. Global semiconductor inventory decreased by 4.3% QoQ to US$22.9bn in 4Q13, after a 3.0% increase in 3Q13. The decline was greater than the five-year average of up 0.7% QoQ. However, semi inventory, measured in days, decreased by 4.5 days QoQ, well below the five-year average of up 0.9 days. Additionally, the absolute level of inventory (66.6 days) was 2.1 days below the 4Q's five-year average.
Communication semi companies looking very lean
Table 1: Semi 4Q inventory analysis Dollars Q/Q (%) Inventory Days Days Q/Q
4Q13A
4Q Ave
-4.3% 66.6 (4.5)
0.7% 68.7 0.9
Source: Company reports, BofA Merrill Lynch Global Research estimates
Exhibit 3: Semiconductor inventory days
Source: Company reports, BofA Merrill Lynch Global Research estimates
Among all subsectors, only PLD and Analog/mix signal posted an increase QoQ in 4Q13. PLD noted a 8% QoQ increase in inventory on both Altera (up 3.4%) and Xilinx (up 12.5%). Its DOI increased by 7.8 days to 103.8 days. Analog/mixed signal is another subsector to report an inventory increase with 0.5% QoQ. DOI increased 2.4 days to 103.6 days. Foundry reported flat QoQ in inventory and DOI increased by 1.5 days to 46.4 days. OSAT companies reported a 1.5% QoQ decline in inventory while DOI dropped by 4.4 days to 47.4 days. Memory companies declined 4% QoQ in inventory while DOI decreased dramatically by 8.9 days to 71.3 days on strong revenue from Micron, but still above the five-year average of 66.0 days. PC-related companies saw a decrease of 6.9% in inventory from Intel (down 8.0%) and Realtek (down 17.9%). Their DOI decreased 9.5 days to 72.3 days. Communication semi companies reduced inventory by 12.4% vs the typical 2.2% increase due to strong demand for wireless products. MediaTek’s inventory largely decreased by 29.1% QoQ, and its DOI also decreased by 14.9 days to 38.9 days. Inventory held by Qualcomm and Broadcom dropped 18.3% and 3.0% QoQ, respectively. RFMD/Marvell noted a 5.5/8.6% inventory decline. Exhibit 4: Semiconductor inventory dollars
Source: Company reports, BofA Merrill Lynch Global Research estimates
3
S emic ondu c to rs - Glo bal 0 2 Ap ril 201 4
Computer hardware inventory back to seasonal PC supply chain inventory decreased 5.1% QoQ to US$23.6bn in 4Q13, slightly above the five-year average of down 5.5%. DOI decreased by 3.5 days QoQ to 27.7 days, which was lower than the five-year seasonality of down 2.0 days. The 27.7-day level was slightly higher than the seasonal avg of 26.9 days in 4Q. After remaining at a high level for three quarters, DOI has declined to a seasonal-level due to the holiday shopping season and new product launches while the overall demand across the PC supply chain is still weak. Exhibit 5: PC supply chain inventory days
Source: Company reports, BofA Merrill Lynch Global Research estimates
Exhibit 6: PC supply chain inventory dollars
Source: Company reports, BofA Merrill Lynch Global Research estimates
Communications - DOI continues sub-seasonal Inventory held at 10 wireline-related hardware vendors was flat QoQ to US$6.7bn in 4Q13. That’s above the five-year average of down 6.5% QoQ. The inventory dollars have been stable in the past several quarters, indicating strong inventory management capability by these companies. DOI decreased by 5.4 days QoQ to 51.4 days, 9.1 days below the seasonal average of 60.5 days. Exhibit 7: Wireline equipment supply chain inventory days
Source: Company reports, BofA Merrill Lynch Global Research estimates
4
Exhibit 8: Wireline equipment supply chain inventory dollars
Source: Company reports, BofA Merrill Lynch Global Research estimates
S emic ondu c to rs - Glo bal 0 2 Ap ril 201 4
Wireless – DOI extremely low Wireless inventory decreased 12.7% QoQ to US$8.7bn, which was below the five-year average of -8.3%. Major decreases came from Research in Motion (73% QoQ) and Nokia (-45% QoQ), but were partially offset by Apple (+20% QoQ). Overall, DOI decreased 8.5 days to 16.5 days (vs five-year seasonal average of down 7.5 days). This level was significantly below the five-year average of 26.2 days in 4Q and reached a new low in the past several years. The extremely lean DOI level implies that demand in the overall handset market remains strong, especially in China and emerging markets, albeit some softer demand in the high-end market. Exhibit 9: Wireless supply chain inventory days
Source: Company reports, BofA Merrill Lynch Global Research estimates
Exhibit 10: Wireless supply chain inventory dollars
Source: Company reports, BofA Merrill Lynch Global Research estimates
Distributor inventory – DOI below seasonal Inventory held at distributors decreased by 2.1% QoQ to US$8.0bn during 4Q13. This decrease was in line with the five-year seasonal average of -1.7%. DOI decreased 6.3 days to 36.8 days, below the five-year seasonal average of down 1.5 days. The lower-than-seasonal DOI implies room for channel restocking. Exhibit 11: Distributor supply chain inventory days
Source: Company reports, BofA Merrill Lynch Global Research estimates
Exhibit 12: Distributor supply chain inventory dollars
Source: Company reports, BofA Merrill Lynch Global Research estimates
5
S emic ondu c to rs - Glo bal 0 2 Ap ril 201 4
EMS – DOI lowest in five years EMS inventory dollars were down 7.6% QoQ to US$20.1bn in 4Q13, in-line with the five-year average of down 7.6% QoQ. DOI at EMS vendors decreased 13.3 days to 31.6 days, which is the lowest in the past five years and below the fiveyear seasonal average of down 7.2 days. There was a major inventory decline that came from Hon Hai (down 13.5% QoQ), Celestica (down 7.3% QoQ) and Jabil Circuits (down 5.9% QoQ). Exhibit 13: EMS supply chain inventory days
Exhibit 14: EMS supply chain inventory dollars
Source: Company reports, BofA Merrill Lynch Global Research estimates
Source: Company reports, BofA Merrill Lynch Global Research estimates
Apple’s supply chain inventory – low Apple reported purchase commitments of US$16.1bn for the December quarter, representing a 13.4% QoQ decrease (five-year average is down 14.8% QoQ). The inventory on its balance sheet was US$2.1bn with inventory days, including purchase commitment, at 46.5 days, or 3.1 days below the five-year average of 49.6 days. Chart 4: Apple’s inventory plus purchase commitments 70
100
60
80 60
US$bn
40 30
40
20 20
10
Inventory + purchase commitments Inventory days (incl. commitment) Source: Company reports, BofA Merrill Lynch Global Research estimates
6
Revenue
3Q13
1Q13
3Q12
1Q12
3Q11
1Q11
3Q10
1Q10
3Q09
1Q09
3Q08
1Q08
3Q07
1Q07
3Q06
1Q06
3Q05
1Q05
3Q04
0 1Q04
-
Inventory days
50
S emic ondu c to rs - Glo bal 0 2 Ap ril 201 4
Apple to support downstream sales in 4Q13 BofAML's coverage companies in the global tech hardware sector grew 18.4% QoQ in 4Q13, well below the five-year average of up 9.7% QoQ. The deviation from historical trends is mainly driven by wireless (34% QoQ vs five-year average of 26%) and EMS (32% QoQ vs five-year average of 10%). PC and distributor growth also outpaced seasonality, while wireline was below seasonal. The strong growth in wireless was mainly from Apple given new product launch momentum. If excluding Apple, both downstream and wireless companies could have posted a worse-than-seasonal demand. Among the 49 hardware companies that have reported quarterly results recently, 25 are under BofAML’s coverage which accounted for 86% of the value of factory revenue. BofAML global analysts anticipate that the overall downstream will record a worse-than-seasonal decline in 1Q14 on inventory adjustment, especially in wireless, distributor and EMS. Chart 5: Total downstream sales growth (% QoQ)
Chart 6: Total downstream (ex Apple) sales growth (% QoQ) 15%
25% 20%
17%
15% 10%
10%
12% 6%
5%
4% 2%
3%
0% -3%
-10% -15%
-13% -17%
-20%
-13% -17%
2Q12 3Q12 4Q12 1Q13 2Q13 3Q13 4Q13 1Q14E 2Q14E
BofAML survey
6%
4%4%
4% 1%
0%
1%
0% -5%
0%
-5% -3%
6%
5%
7%
0%
8% 5%
10%
8%
12%
11% 10%
18%
-1%
-10% -13%
-15%
-13%
-16%
-15%
-20% 2Q12 3Q12 4Q12 1Q13 2Q13 3Q13 4Q13 1Q14E2Q14E
5-year avg.
BofAML survey
5-year avg.
Source: Company reports, BofA Merrill Lynch Global Research estimates
Source: Company reports, BofA Merrill Lynch Global Research estimates
Chart 7: PC supply chain sales growth (% QoQ)
Chart 8: Wireline equipment supply chain sales (% QoQ)
15% 10% 5%
10% 3% 2% 0%
8% 7% 1%
7% 8% 4% 4% 3%
3% 2%
0% -5% -10% -15%
-11%
-12% -14%
-13%
-20% 2Q12 3Q12 4Q12 1Q13 2Q13 3Q13 4Q13 1Q14E 2Q14E
BofAML survey
5-year avg.
Source: Company reports, BofA Merrill Lynch Global Research estimates
10% 8% 6% 4% 2% 0% -2% -4% -6% -8% -10%
8% 6% 5%
5% 5%
6%
3%
3% 1% 1%
1% -1%
3% 2%
-1%
-5% -8%
-9%
2Q12 3Q12 4Q12 1Q13 2Q13 3Q13 4Q13 1Q14E2Q14E
BofAML survey
5-year avg.
Source: Company reports, BofA Merrill Lynch Global Research estimates
7
S emic ondu c to rs - Glo bal 0 2 Ap ril 201 4
Chart 9: Wireless equipment supply chain (% QoQ) 37%
40%
15% 10%
20% 10%
11%
6%
5%
0%
5%
1%
-7%
0% -5% -1%
-18%-17% -23%
-18% -20% BofAML survey
-20% -22%
2Q12 3Q12 4Q12 1Q13 2Q13 3Q13 4Q13 1Q14E2Q14E
5-year avg.
Source: Company reports, BofA Merrill Lynch Global Research estimates
Chart 12: EMS sales (% QoQ) 40%
20% 14%
15% 7% 4%
32%
30%
8%
7% 5% 7%
-12%
-19% -21%
-25%
BofAML survey
Chart 11: Distributor sales (% QoQ)
6% 4%
5% 5% 2%
22% 15%
20% 10%
7%
12%
12% 8% 5% 4%
10% 7%
0%
0% 0%
-1%
-4%
-5% -9%
-12% 2Q12 3Q12 4Q12 1Q13 2Q13 3Q13 4Q13 1Q14E 2Q14E
BofAML survey
-10% -20%
-15% 5-year avg.
Source: Company reports, BofA Merrill Lynch Global Research estimates
8
-2% -6% -12%
5-year avg.
Source: Company reports, BofA Merrill Lynch Global Research estimates
-10%
-1% -5%
4%
-20%
2Q12 3Q12 4Q12 1Q13 2Q13 3Q13 4Q13 1Q14E 2Q14E
-5%
7% 5%
-15%
-11%
-30%
5%
10%
-10%
-1%
-20%
10%
15%
5%
0% -10%
18% 13%
20%
34% 26%
25%
30%
Chart 10: Wireless equipment (ex Apple) supply chain (% QoQ)
-30%
0%
-1% -7% -15%
-17% -24%
-23%
2Q12 3Q12 4Q12 1Q13 2Q13 3Q13 4Q13 1Q14E2Q14E
BofAML survey
5-year avg.
Source: Company reports, BofA Merrill Lynch Global Research estimates
S emic ondu c to rs - Glo bal 0 2 Ap ril 201 4
Semis – above-seasonal in 4Q13; in-line 1Q14 According to SIA (Semiconductor Industry Association) data, total semiconductor sales declined by 0.8% QoQ to US$79.9bn in 4Q13, above the five-year average of a 5.8% decline. All subsectors posted above-seasonal growth in 4Q13, except for memory which declined 4.6% QoQ vs the five-year average of down 3.1%. Logic IC grew 1.2% QoQ, above the five-year average of 6.9%. Analog (down 0.8% QoQ vs five-year average of down 7.8%) and MPU (1.3% QoQ vs. five-year average of down 6.3%) were also largely above seasonality. Our current global semi model shows 1Q14 to be in-line with seasonal and 2Q-3Q14 to be slightly sub-seasonal. Chart 13: Total semiconductor billings (% QoQ) 10% 8%
7% 6%
8%7%
Chart 14: Logic billings (% QoQ) 12%
8% 7% 8% 4%
4%
2%
1%
0%
6%5%
5%
6%
4%
3% 1%
2% 0%
-1%
-2%
-1%
-4%
0%
-2%
-2%
-4% -4% -4%
-4% -5%
-6%
-6%
-8%
-8%
1Q13 2Q13 3Q13 4Q13 1Q14E 2Q14E 3Q14E 4Q14E Actual/BofAML forecast
-6% -7% -6% 1Q13 2Q13 3Q13 4Q13 1Q14E2Q14E3Q14E4Q14E Actual/BofAML forecast
Chart 16: Memory billings (% QoQ) 11%
11%
20% 15%
7%
15% 10%
3% 2%
1%
11% 9% 9%
5% -2%-2%
-2%
-7%
5-year avg.
Source: SIA, BofA Merrill Lynch Global Research estimates
Chart 15: MPU billings (% QoQ)
1%2%
-6%-6%
5 year avg.
Source: SIA, BofA Merrill Lynch Global Research estimates
12% 10% 8% 6% 4% 2% 0% -2% -4% -6% -8% -10%
10% 10%
8%
6%
-6%
10% 10%
10%
0% -2%
1.8%
1%
3%
4%
6% 2%
0% -5%
-6% -6%
9%
-2% -3%
-3% -5%
-1%
-10%
1Q13 2Q13 3Q13 4Q13 1Q14E2Q14E3Q14E4Q14E Actual/BofAML forecast Source: SIA, BofA Merrill Lynch Global Research estimates
5-year avg.
1Q13 2Q13 3Q13 4Q13 1Q14E2Q14E3Q14E4Q14E Actual/BofAML forecast
5-year avg.
Source: SIA, BofA Merrill Lynch Global Research estimates
9
S emic ondu c to rs - Glo bal 0 2 Ap ril 201 4
Chart 17: Analog billings (% QoQ) 12% 10% 8% 6% 4% 2% 0% -2% -4% -6% -8% -10%
Chart 18: Discrete billings (% QoQ)
10%
4%
9% 5% 5%
5%
5%5%
2%
-1%
0% -2%
-3% -3%
-4%
-8% 1Q13 2Q13 3Q13 4Q13 1Q14E 2Q14E 3Q14E 4Q14E Actual/BofAML forecast
10% 8% 6% 4% 2% 0% -2% -4% -6% -8% -10%
8% 8%
9%
9% 6%
5%
1%
-1%
-1%
-4%
-4%
-6% -7% -9% 1Q13 2Q13 3Q13 4Q13 1Q14E 2Q14E 3Q14E 4Q14E
5-year avg.
Actual/BofAML forecast
Source: SIA, BofA Merrill Lynch Global Research estimates
9% 8%
5-year avg.
Source: SIA, BofA Merrill Lynch Global Research estimates
Table 2: Companies mentioned in report Name
Altera Apple ARM Holdings ASM Pacific BlackBerry Broadcom Celestica Inc. Hon Hai Prec. Intel Jabil Circuit Marvell Micron Technology MediaTek Nokia QUALCOMM Realtek RFMD Skyworks Taiwan Semi Xilinx
ML Ticker ALTR AAPL ARMHF ASMVF BBRY BRCM CLS HNHAF INTC JBL MRVL MU MDTKF NOK QCOM RLTQF RFMD SWKS TSMWF XLNX
BBG Ticker ALTR US AAPL US ARM LN 522 HK BBRY US BRCM US CLS US 2317 TT INTC US JBL US MRVL US MU US 2454 TT NOK US QCOM US 2379 TT RFMD US SWKS US 2330 TT XLNX US
QRQ C-1-7 C-2-7 C-1-7 C-1-7 C-3-9 C-1-7 C-3-9 B-1-7 A-1-7 C-1-7 C-3-7 C-3-9 C-1-7 C-1-9 C-2-7 C-3-7 C-1-9 C-1-9 C-1-7 C-1-7
Price
36.24 536.74 998.00 75.65 8.08 31.47 10.95 86.20 25.81 18.00 15.75 23.66 463.50 7.34 78.86 91.60 7.88 37.52 119.50 54.27
Source: SIA, BofA Merrill Lynch Global Research estimates
Link to Definitions Technology
Click here for definitions of commonly used terms.
Special Disclosures Information on securities which are listed on the exchanges where ML Securities (Taiwan) Limited is not permitted to trade or solicit trades for clients is for informational purposes only and is not a recommendation or a solicitation to trade such securities. ML Securities (Taiwan) Limited will not execute transactions for
10
S emic ondu c to rs - Glo bal 0 2 Ap ril 201 4
nor accept orders from clients to trade such securities. Foreign investment in Taiwan securities is regulated and restricted. Currently, foreign investment in Taiwan securities is permitted by investment through: (1) global depository receipts, (2) convertible bonds, (3) mutual funds issued offshore of Taiwan, and (4) a special foreign institutional investors (FINIs) and foreign individual investors (FIDIs) program supervised by the Taiwan SFB whereunder FINIs/FIDIs may apply for investment ID to invest in Taiwan securities by registration with Taiwan Stock Exchange. FINIs will additionally need consent from the foreign exchange authority, ie, the Central Bank of China. In addition to the limitations above, various industry-specific percentage-based limitations on foreign ownership of Taiwan companies (and in some cases prohibitions) may apply. Investments are subject to exchange rate and currency conversion restrictions and risks. Dividends and interest earned by foreign investors' Taiwan securities/instruments are generally subject to a 20% withholding tax. Ordinary shares are not available to ML private client accounts in the U.S. This report is distributed in the Republic of China by Merrill Lynch Securities (Taiwan) Limited, which is regulated by the SFB of the Republic of China. BofA Merrill Lynch is currently acting as Financial Advisor to RF Micro Devices Inc in connection with its proposed merger with TriQuint Semiconductor Inc, which was announced on February 24, 2014. The proposed transaction is subject to approval by shareholders of RF Micro Devices Inc and TriQuint Semiconductor Inc.This research report is not intended to (1) provide voting advice, (2) serve as an endorsement of the proposed transaction, or (3) result in the procurement, withholding or revocation of a proxy.
11
S emic ondu c to rs - Glo bal 0 2 Ap ril 201 4
Important Disclosures FUNDAMENTAL EQUITY OPINION KEY: Opinions include a Volatility Risk Rating, an Investment Rating and an Income Rating. VOLATILITY RISK RATINGS, indicators of potential price fluctuation, are: A - Low, B - Medium and C - High. INVESTMENT RATINGS reflect the analyst’s assessment of a stock’s: (i) absolute total return potential and (ii) attractiveness for investment relative to other stocks within its Coverage Cluster (defined below). There are three investment ratings: 1 - Buy stocks are expected to have a total return of at least 10% and are the most attractive stocks in the coverage cluster; 2 - Neutral stocks are expected to remain flat or increase in value and are less attractive than Buy rated stocks and 3 - Underperform stocks are the least attractive stocks in a coverage cluster. Analysts assign investment ratings considering, among other things, the 0-12 month total return expectation for a stock and the firm’s guidelines for ratings dispersions (shown in the table below). The current price objective for a stock should be referenced to better understand the total return expectation at any given time. The price objective reflects the analyst’s view of the potential price appreciation (depreciation). Investment rating Total return expectation (within 12-month period of date of initial rating) Ratings dispersion guidelines for coverage cluster* Buy ≥ 10% ≤ 70% Neutral ≥ 0% ≤ 30% Underperform N/A ≥ 20% * Ratings dispersions may vary from time to time where BofA Merrill Lynch Research believes it better reflects the investment prospects of stocks in a Coverage Cluster.
INCOME RATINGS, indicators of potential cash dividends, are: 7 - same/higher (dividend considered to be secure), 8 - same/lower (dividend not considered to be secure) and 9 - pays no cash dividend. Coverage Cluster is comprised of stocks covered by a single analyst or two or more analysts sharing a common industry, sector, region or other classification(s). A stock’s coverage cluster is included in the most recent BofA Merrill Lynch Comment referencing the stock. BofA Merrill Lynch Research personnel (including the analyst(s) responsible for this report) receive compensation based upon, among other factors, the overall profitability of Bank of America Corporation, including profits derived from investment banking revenues.
Other Important Disclosures Officers of MLPF&S or one or more of its affiliates (other than research analysts) may have a financial interest in securities of the issuer(s) or in related investments. BofA Merrill Lynch Global Research policies relating to conflicts of interest are described at http://www.ml.com/media/43347.pdf. "BofA Merrill Lynch" includes Merrill Lynch, Pierce, Fenner & Smith Incorporated ("MLPF&S") and its affiliates. Investors should contact their BofA Merrill Lynch representative or Merrill Lynch Global Wealth Management financial advisor if they have questions concerning this report. "BofA Merrill Lynch" and "Merrill Lynch" are each global brands for BofA Merrill Lynch Global Research. Information relating to Non-US affiliates of BofA Merrill Lynch and Distribution of Affiliate Research Reports: MLPF&S distributes, or may in the future distribute, research reports of the following non-US affiliates in the US (short name: legal name): Merrill Lynch (France): Merrill Lynch Capital Markets (France) SAS; Merrill Lynch (Frankfurt): Merrill Lynch International Bank Ltd., Frankfurt Branch; Merrill Lynch (South Africa): Merrill Lynch South Africa (Pty) Ltd.; Merrill Lynch (Milan): Merrill Lynch International Bank Limited; MLI (UK): Merrill Lynch International; Merrill Lynch (Australia): Merrill Lynch Equities (Australia) Limited; Merrill Lynch (Hong Kong): Merrill Lynch (Asia Pacific) Limited; Merrill Lynch (Singapore): Merrill Lynch (Singapore) Pte Ltd.; Merrill Lynch (Canada): Merrill Lynch Canada Inc; Merrill Lynch (Mexico): Merrill Lynch Mexico, SA de CV, Casa de Bolsa; Merrill Lynch (Argentina): Merrill Lynch Argentina SA; Merrill Lynch (Japan): Merrill Lynch Japan Securities Co., Ltd.; Merrill Lynch (Seoul): Merrill Lynch International Incorporated (Seoul Branch); Merrill Lynch (Taiwan): Merrill Lynch Securities (Taiwan) Ltd.; DSP Merrill Lynch (India): DSP Merrill Lynch Limited; PT Merrill Lynch (Indonesia): PT Merrill Lynch Indonesia; Merrill Lynch (Israel): Merrill Lynch Israel Limited; Merrill Lynch (Russia): OOO Merrill Lynch Securities, Moscow; Merrill Lynch (Turkey I.B.): Merrill Lynch Yatirim Bank A.S.; Merrill Lynch (Turkey Broker): Merrill Lynch Menkul Değerler A.Ş.; Merrill Lynch (Dubai): Merrill Lynch International, Dubai Branch; MLPF&S (Zurich rep. office): MLPF&S Incorporated Zurich representative office; Merrill Lynch (Spain): Merrill Lynch Capital Markets Espana, S.A.S.V.; Merrill Lynch (Brazil): Bank of America Merrill Lynch Banco Multiplo S.A.; Merrill Lynch KSA Company, Merrill Lynch Kingdom of Saudi Arabia Company. This research report has been approved for publication and is distributed in the United Kingdom to professional clients and eligible counterparties (as each is defined in the rules of the Financial Conduct Authority and the Prudential Regulation Authority) by Merrill Lynch International and Bank of America Merrill Lynch International Limited, which are authorized by the Prudential Regulation Authority and regulated by the Financial Conduct Authority and the Prudential Regulation Authority, and is distributed in the United Kingdom to retail clients (as defined in the rules of the Financial Conduct Authority and the Prudential Regulation Authority) by Merrill Lynch International Bank Limited, London Branch, which is authorised by the Central Bank of Ireland and subject to limited regulation by the Financial Conduct Authority and Prudential Regulation Authority - details about the extent of our regulation by the Financial Conduct Authority and Prudential Regulation Authority are available from us on request; has been considered and distributed in Japan by Merrill Lynch Japan Securities Co., Ltd., a registered securities dealer under the Financial Instruments and Exchange Act in Japan; is distributed in Hong Kong by Merrill Lynch (Asia Pacific) Limited, which is regulated by the Hong Kong SFC and the Hong Kong Monetary Authority (note that Hong Kong recipients of this research report should contact Merrill Lynch (Asia Pacific) Limited in respect of any matters relating to dealing in securities or provision of specific advice on securities); is issued and distributed in Taiwan by Merrill Lynch Securities (Taiwan) Ltd.; is issued and distributed in India by DSP Merrill Lynch Limited; and is issued and distributed in Singapore to institutional investors and/or accredited investors (each as defined under the Financial Advisers Regulations) by Merrill Lynch International Bank Limited (Merchant Bank) and Merrill Lynch (Singapore) Pte Ltd. (Company Registration No.’s F 06872E and 198602883D respectively). Merrill Lynch International Bank Limited (Merchant Bank) and Merrill Lynch (Singapore) Pte Ltd. are regulated by the Monetary Authority of Singapore. Bank of America N.A., Australian Branch (ARBN 064 874 531), AFS License 412901 (BANA Australia) and Merrill Lynch Equities (Australia) Limited (ABN 65 006 276 795), AFS License 235132 (MLEA) distributes this report in Australia only to 'Wholesale' clients as defined by s.761G of the Corporations Act 2001. With the exception of BANA Australia, neither MLEA nor any of its affiliates involved in preparing this research report is an Authorised Deposit-Taking Institution under the Banking Act 1959 nor regulated by the Australian Prudential Regulation Authority. No approval is required for publication or distribution of this report in Brazil and its local distribution is made by Bank of America Merrill Lynch Banco Múltiplo S.A. in accordance with applicable regulations. Merrill Lynch (Dubai) is authorized and regulated by the Dubai Financial Services Authority (DFSA). Research reports prepared and issued by Merrill Lynch (Dubai) are prepared and issued in accordance with the requirements of the DFSA conduct of business rules. Merrill Lynch (Frankfurt) distributes this report in Germany. Merrill Lynch (Frankfurt) is regulated by BaFin.
12
S emic ondu c to rs - Glo bal 0 2 Ap ril 201 4
This research report has been prepared and issued by MLPF&S and/or one or more of its non-US affiliates. MLPF&S is the distributor of this research report in the US and accepts full responsibility for research reports of its non-US affiliates distributed to MLPF&S clients in the US. Any US person receiving this research report and wishing to effect any transaction in any security discussed in the report should do so through MLPF&S and not such foreign affiliates. General Investment Related Disclosures: Taiwan Readers: Neither the information nor any opinion expressed herein constitutes an offer or a solicitation of an offer to transact in any securities or other financial instrument. No part of this report may be used or reproduced or quoted in any manner whatsoever in Taiwan by the press or any other person without the express written consent of BofA Merrill Lynch. This research report provides general information only. Neither the information nor any opinion expressed constitutes an offer or an invitation to make an offer, to buy or sell any securities or other financial instrument or any derivative related to such securities or instruments (e.g., options, futures, warrants, and contracts for differences). This report is not intended to provide personal investment advice and it does not take into account the specific investment objectives, financial situation and the particular needs of any specific person. Investors should seek financial advice regarding the appropriateness of investing in financial instruments and implementing investment strategies discussed or recommended in this report and should understand that statements regarding future prospects may not be realized. Any decision to purchase or subscribe for securities in any offering must be based solely on existing public information on such security or the information in the prospectus or other offering document issued in connection with such offering, and not on this report. Securities and other financial instruments discussed in this report, or recommended, offered or sold by Merrill Lynch, are not insured by the Federal Deposit Insurance Corporation and are not deposits or other obligations of any insured depository institution (including, Bank of America, N.A.). Investments in general and, derivatives, in particular, involve numerous risks, including, among others, market risk, counterparty default risk and liquidity risk. No security, financial instrument or derivative is suitable for all investors. In some cases, securities and other financial instruments may be difficult to value or sell and reliable information about the value or risks related to the security or financial instrument may be difficult to obtain. Investors should note that income from such securities and other financial instruments, if any, may fluctuate and that price or value of such securities and instruments may rise or fall and, in some cases, investors may lose their entire principal investment. Past performance is not necessarily a guide to future performance. Levels and basis for taxation may change. This report may contain a short-term trading idea or recommendation, which highlights a specific near-term catalyst or event impacting the company or the market that is anticipated to have a short-term price impact on the equity securities of the company. Short-term trading ideas and recommendations are different from and do not affect a stock's fundamental equity rating, which reflects both a longer term total return expectation and attractiveness for investment relative to other stocks within its Coverage Cluster. Short-term trading ideas and recommendations may be more or less positive than a stock's fundamental equity rating. BofA Merrill Lynch is aware that the implementation of the ideas expressed in this report may depend upon an investor's ability to "short" securities or other financial instruments and that such action may be limited by regulations prohibiting or restricting "shortselling" in many jurisdictions. Investors are urged to seek advice regarding the applicability of such regulations prior to executing any short idea contained in this report. Foreign currency rates of exchange may adversely affect the value, price or income of any security or financial instrument mentioned in this report. Investors in such securities and instruments, including ADRs, effectively assume currency risk. UK Readers: The protections provided by the U.K. regulatory regime, including the Financial Services Scheme, do not apply in general to business coordinated by BofA Merrill Lynch entities located outside of the United Kingdom. BofA Merrill Lynch Global Research policies relating to conflicts of interest are described at http://www.ml.com/media/43347.pdf. Officers of MLPF&S or one or more of its affiliates (other than research analysts) may have a financial interest in securities of the issuer(s) or in related investments. MLPF&S or one of its affiliates is a regular issuer of traded financial instruments linked to securities that may have been recommended in this report. MLPF&S or one of its affiliates may, at any time, hold a trading position (long or short) in the securities and financial instruments discussed in this report. BofA Merrill Lynch, through business units other than BofA Merrill Lynch Global Research, may have issued and may in the future issue trading ideas or recommendations that are inconsistent with, and reach different conclusions from, the information presented in this report. Such ideas or recommendations reflect the different time frames, assumptions, views and analytical methods of the persons who prepared them, and BofA Merrill Lynch is under no obligation to ensure that such other trading ideas or recommendations are brought to the attention of any recipient of this report. In the event that the recipient received this report pursuant to a contract between the recipient and MLPF&S for the provision of research services for a separate fee, and in connection therewith MLPF&S may be deemed to be acting as an investment adviser, such status relates, if at all, solely to the person with whom MLPF&S has contracted directly and does not extend beyond the delivery of this report (unless otherwise agreed specifically in writing by MLPF&S). MLPF&S is and continues to act solely as a broker-dealer in connection with the execution of any transactions, including transactions in any securities mentioned in this report. Copyright and General Information regarding Research Reports: Copyright 2014 Merrill Lynch, Pierce, Fenner & Smith Incorporated. All rights reserved. iQmethod, iQmethod 2.0, iQprofile, iQtoolkit, iQworks are service marks of Bank of America Corporation. iQanalytics®, iQcustom®, iQdatabase® are registered service marks of Bank of America Corporation. This research report is prepared for the use of BofA Merrill Lynch clients and may not be redistributed, retransmitted or disclosed, in whole or in part, or in any form or manner, without the express written consent of BofA Merrill Lynch. BofA Merrill Lynch Global Research reports are distributed simultaneously to internal and client websites and other portals by BofA Merrill Lynch and are not publicly-available materials. Any unauthorized use or disclosure is prohibited. Receipt and review of this research report constitutes your agreement not to redistribute, retransmit, or disclose to others the contents, opinions, conclusion, or information contained in this report (including any investment recommendations, estimates or price targets) without first obtaining expressed permission from an authorized officer of BofA Merrill Lynch. Materials prepared by BofA Merrill Lynch Global Research personnel are based on public information. Facts and views presented in this material have not been reviewed by, and may not reflect information known to, professionals in other business areas of BofA Merrill Lynch, including investment banking personnel. BofA Merrill Lynch has established information barriers between BofA Merrill Lynch Global Research and certain business groups. As a result, BofA Merrill Lynch does not disclose certain client relationships with, or compensation received from, such companies in research reports. To the extent this report discusses any legal proceeding or issues, it has not been prepared as nor is it intended to express any legal conclusion, opinion or advice. Investors should consult their own legal advisers as to issues of law relating to the subject matter of this report. BofA Merrill Lynch Global Research personnel’s knowledge of legal proceedings in which any BofA Merrill Lynch entity and/or its directors, officers and employees may be plaintiffs, defendants, co-defendants or co-plaintiffs with or involving companies mentioned in this report is based on public information. Facts and views presented in this material that relate to any such proceedings have not been reviewed by, discussed with, and may not reflect information known to, professionals in other business areas of BofA Merrill Lynch in connection with the legal proceedings or matters relevant to such proceedings. This report has been prepared independently of any issuer of securities mentioned herein and not in connection with any proposed offering of securities or as agent of any issuer of any securities. None of MLPF&S, any of its affiliates or their research analysts has any authority whatsoever to make any representation or warranty on behalf of the issuer(s). BofA Merrill Lynch Global Research policy prohibits research personnel from disclosing a recommendation, investment rating, or investment thesis for review by an issuer prior to the publication of a research report containing such rating, recommendation or investment thesis. Any information relating to the tax status of financial instruments discussed herein is not intended to provide tax advice or to be used by anyone to provide tax advice. Investors are urged to seek tax advice based on their particular circumstances from an independent tax professional. The information herein (other than disclosure information relating to BofA Merrill Lynch and its affiliates) was obtained from various sources and we do not guarantee its accuracy. This report may contain links to third-party websites. BofA Merrill Lynch is not responsible for the content of any third-party website or any linked content contained in a third-party website. Content contained on such third-party websites is not part of this report and is not incorporated by reference into
13
S emic ondu c to rs - Glo bal 0 2 Ap ril 201 4
this report. The inclusion of a link in this report does not imply any endorsement by or any affiliation with BofA Merrill Lynch. Access to any third-party website is at your own risk, and you should always review the terms and privacy policies at third-party websites before submitting any personal information to them. BofA Merrill Lynch is not responsible for such terms and privacy policies and expressly disclaims any liability for them. Subject to the quiet period applicable under laws of the various jurisdictions in which we distribute research reports and other legal and BofA Merrill Lynch policyrelated restrictions on the publication of research reports, fundamental equity reports are produced on a regular basis as necessary to keep the investment recommendation current. Certain outstanding reports may contain discussions and/or investment opinions relating to securities, financial instruments and/or issuers that are no longer current. Always refer to the most recent research report relating to a company or issuer prior to making an investment decision. In some cases, a company or issuer may be classified as Restricted or may be Under Review or Extended Review. In each case, investors should consider any investment opinion relating to such company or issuer (or its security and/or financial instruments) to be suspended or withdrawn and should not rely on the analyses and investment opinion(s) pertaining to such issuer (or its securities and/or financial instruments) nor should the analyses or opinion(s) be considered a solicitation of any kind. Sales persons and financial advisors affiliated with MLPF&S or any of its affiliates may not solicit purchases of securities or financial instruments that are Restricted or Under Review and may only solicit securities under Extended Review in accordance with firm policies. Neither BofA Merrill Lynch nor any officer or employee of BofA Merrill Lynch accepts any liability whatsoever for any direct, indirect or consequential damages or losses arising from any use of this report or its contents.
14