Exp Brain Res (2007) 179:397–408 DOI 10.1007/s00221-006-0797-8
R E SEARCH ART I CLE
Smooth pursuit eye movements in 1,087 men: eVects of schizotypy, anxiety, and depression Nikolaos Smyrnis · Ioannis Evdokimidis · Asimakis Mantas · Emmanouil Kattoulas · Nicholas C. Stefanis · Theodoros S. Constantinidis · Dimitrios Avramopoulos · Costas N. Stefanis
Received: 9 December 2005 / Accepted: 6 November 2006 / Published online: 30 November 2006 © Springer-Verlag 2006
Abstract Individuals with schizotypal personality disorder or high scores in questionnaires measuring schizotypy are at high risk for the development of schizophrenia and they also share some of the same phenotypic characteristics such as eye-tracking dysfunction (ETD). The question arises whether these individuals form a distinct high-risk group in the general population or whether schizotypy and ETD covary in the general population with no distinct cutoV point for a high-risk group. A large sample of military conscripts aged 18–25 were screened using oculomotor, cognitive and psychometric tools for the purposes of a prospective study on predisposing factors for the development of psychosis. Schizotypy measured using the perceptual aberration scale (PAS) and the schizotypal personality questionnaire (SPQ), anxiety and depression, measured using the Symptom Checklist 90-R, had no eVect on pursuit performance in the total sample. Small groups of individuals with very high scores in schizotypy questionnaires were then identiWed. These
N. Smyrnis · N. C. Stefanis · T. S. Constantinidis · D. Avramopoulos · C. N. Stefanis University Mental Health Research Institute, Athens, Greece N. Smyrnis · I. Evdokimidis · A. Mantas · E. Kattoulas Cognition and Action Group, Neurology Department, National and Kapodistrian University of Athens, Eginitio Hospital, Athens, Greece N. Smyrnis (&) · N. C. Stefanis Psychiatry Department, National and Kapodistrian University of Athens, Eginitio Hospital, 74 Vas. SoWas Ave., 11528 Athens, Greece e-mail:
[email protected]
groups were not mutually exclusive. The high PAS group had higher root-mean-square error scores (a quantitative measure for pursuit quality) than the total sample, and the high disorganized factor of SPQ group had lower gain and higher saccade frequencies in pursuit than the total sample. The presence of signiWcant diVerences in pursuit performance only for predeWned high schizotypy groups favors the hypothesis that individuals with high schizotypy might present one or more high-risk groups, distinct from the general population, that are prone to ETD as that observed in schizophrenia. Keywords Eye movements · Smooth pursuit deWcit · Population · Personality traits · Psychosis proneness
Introduction Impairment in the performance of smooth eye pursuit movements [eye-tracking dysfunction (ETD)] has been consistently reported for schizophrenic patients and their Wrst-degree relatives (Holzman et al. 1973, 1974; Holzman and Levy 1977; Levy et al. 1993). Holzman and Matthysse (1990) proposed that smooth eye pursuit could serve as a biological marker for detecting genetic susceptibility to schizophrenic spectrum disorders. In this respect it becomes an important issue whether ETD is present before the onset of schizophrenia, for example, in high-risk populations. Such high-risk populations are, beyond the Wrst-degree relatives of patients, those individuals with clinically diagnosed schizotypal personality disorder or individuals within the general population that score high on selfreporting questionnaires that measure schizotypy. It
123
398 has been shown that schizotypal individuals are at a greater risk of developing psychosis than the general population (Chapman et al. 1994). Two major theoretical frameworks have been proposed to explain the link between schizotypy and schizophrenia. The theory of “schizotaxia” of Meehl (Meehl 1989) proposes that schizotaxia is a conjectured neural integrative defect due to a dominant “schizogene” that gives rise to the schizotypal personality. This genetic proWle in synergy with other polygenic potentiators and adverse life experiences gives rise to the clinical syndrome of schizophrenia in a small percentage of these individuals. In a theory closely related to Meehl’s theory of schizotaxia, Matthysse et al. (1986) proposed that schizotypal traits are one of the phenotypic expressions of an underlying vulnerability to schizophrenia, while other such expressions are the deWcits in tests of neurocognitive function and eye movement tasks, like the smooth eye pursuit task. This theoretical framework predicts that, in a distinctive group of individuals with high schizotypy, that have not developed schizophrenia, there would be indications of eye movement function deWcits similar to those observed in schizophrenia. The second theoretical framework of schizotypy favored by Eysenck (Eysenck and Eysenck 1976) proposes that personality traits, such as those that deWne psychosis, are a continuum from health to schizophrenia with no need to introduce arbitrary cutoV points, above which schizotypy lies as a diVerent entity (Claridge 1994). According to this view certain dimensions of personality are to be found in the general population and their extremes lead to the symptoms of a disease state such as schizophrenia. Within this framework, schizotypy is decomposed in dimensions using a factor model and the diVerent factors identiWed in the samples of the general population (for example, a positive symptom factor loading on unusual perceptual experiences) reXect the corresponding factor structure of the clinically identiWed syndrome of schizophrenia (in the previous example, the positive symptoms of schizophrenia). This model then would predict that other phenotypic expressions of schizophrenia, such as ETD, would also co-vary with psychosis in the population, showing a gradual increase in the levels found in patients. Thus one would predict, based on the co-variation of phenotypic expressions of schizophrenia in the normal population, that a correlation of ETD and schizotypy would be evident in the population. All previous studies on schizotypy and smooth eye pursuit used predeWned groups of schizotypes and normal controls to study the eVects of schizotypy on smooth eye pursuit performance. It was reported that
123
Exp Brain Res (2007) 179:397–408
students with qualitatively assessed ETD had a higher probability of schizotypal personality disorder diagnosed using DSMIII criteria (Siever et al. 1984). Individuals with DSMIII schizotypal personality disorder had a higher probability of qualitatively assessed ETD compared to normal controls and compared to individuals with personality disorders not in the schizophrenia spectrum (Siever et al. 1990, 1994). Using the Chapman self-reporting questionnaires such as the perceptual aberration scale (Chapman et al. 1978), it was shown that a group of individuals with very high scores in schizotypy had a higher probability of ETD measured as low quality pursuit compared to normal controls (O’Driscoll et al. 1998; Gooding et al. 2000). In addition, a group of individuals with very high scores in the schizotypal personality questionnaire (Raine 1991) had lower quality of smooth eye pursuit compared to controls (Lencz et al. 1993). In contrast to these Wndings, one study showed that individuals with very high schizotypy scores had no diVerence in the mean quality of their pursuit compared to controls, but there was more variability in the quality of the pursuit records in this group (Simons and Katkin 1985). Finally, it was reported that only a subgroup of individuals with clinical characteristics of schizotypy, that were also Wrstdegree relatives of patients with schizophrenia, had a signiWcantly higher probability of presenting with qualitatively measured ETD compared to normal controls (Thaker et al. 1996). In the majority of studies on schizotypy and smooth eye pursuit, the ETD was detected only with qualitative assessment of the smooth eye pursuit records. Siever et al. (1994) used quantitative measures of pursuit performance, namely pursuit gain and saccade frequency, and observed no diVerence between schizotypes and controls. Gooding et al. (2000) measured pursuit performance using the rootmean-square error that is the diVerence of the eye movement signal to the target movement signal. This quantitative measure assesses global pursuit quality. In the study of Gooding et al. (2000) root-meansquare error was higher and pursuit gain was lower in the high schizotypy groups compared to controls but there was no diVerence in saccade frequency in the two groups. The Athens Study of Psychosis Proneness and Incidence of Schizophrenia (ASPIS, Smyrnis et al. 2003; Stefanis et al. 2004) involved the collection of data from eye-movement and cognitive tests in a sample of 2,130 young men in the Greek Air Force. The study is prospective in nature and longitudinal, designed to follow these individuals and investigate if oculomotor functions, such as smooth eye pursuit, and cognitive
Exp Brain Res (2007) 179:397–408
functions have predictive value for the later development of a clinical psychiatric disorder. In this report, we provide data on quantitative measures of smooth eye pursuit performance in this sample. Although these data are limited by the speciWc task conditions, age and gender, they provide a unique database of oculomotor function in a large sample of apparently healthy individuals. This unique database oVered us the opportunity to address the question of whether within a large sample of apparently healthy individuals there is one or more small groups that exhibit a combination of neurophysiological (ETD) and psychological (high schizotypy) phenotypic expressions of high risk for the development of schizophrenia. The theory of schizotaxia predicts the existence of such groups and also predicts that these groups share genetic similarities with patients suVering from schizophrenia. The negative prediction of the same theory is that all other individuals of the population do not share these phenotypic expressions of genetic susceptibility with the schizotaxia group. An alternative prediction would be that diVerent phenotypic expressions of high risk for schizophrenia are present in an attenuated form in the population. Thus genetic susceptibility co-varies with the magnitude of the phenotypic expressions and there are no distinct high-risk groups. All previous studies have used a priori deWned groups to study ETD in schizophrenia spectrum disorders. Having data for eye movement tasks and psychometric scores in a large sample, we were able to study ETD in the total sample and observe whether phenotypic expressions such as ETD and schizotypy co-vary in the sample or whether ETD is present only in a small subgroup in the total sample with high schizotypy. In the latter case we would be able to derive speciWc high-risk groups within our sample that would combine diVerent phenotypic characteristics common to schizophrenia and predict a higher genetic susceptibility for these individuals to develop psychosis. A potential confounding factor in the study of ETD as a biological marker in schizophrenia spectrum disorders is whether ETD is related to anxiety and depression and thus does not reXect a phenotypic expression of vulnerability that should be stable in time. The potential confounding eVect of depression and anxiety becomes even more important in this sample of young army recruits who were in the Wrst phase of their military training. Military training is a stressful condition that could result in the development of anxiety or depression symptoms. We thus tested the relation of ETD to anxiety and depression in addition to schizotypy.
399
Methods Participants and materials A sample of 2,130 young men aged 18–25 were recruited from the Greek Air Force. All participants gave written informed consent. A total of 2,075 individuals performed the following eye-movement tasks: smooth eye-pursuit, saccade, antisaccade, visual Wxation. We also administered to a randomly selected subset of 1,657 of these subjects (80% of participants) a battery of self-rated questionnaires assessing among other variables (a) schizotypy with the perceptual aberration scale (PAS, Chapman et al. 1978) and the schizotypal personality questionnaire (SPQ, Raine 1991); (b) current psychopathology with the Symptom Checklist 90 revised scale (SCL90-R, Derogatis et al. 1974) translated and standardized in the Greek population (Ntonias et al. 1990); (c) personality characteristics with the Temperament and Character Inventory (TCI-140-R, Cloninger et al. 1993). A 2-year follow-up phase was initiated for all participants to record those that were admitted in the Neurology or Psychiatry services of the Air Force General Hospital during service time. During this phase of the study 43 subjects with a neurological or psychiatric disorder were identiWed. Most of these individuals had a diagnosis before entering the service but they did not report it during the initial medical assessment of conscripts entering military service. This assessment is a standard interview-based procedure performed by a team of medical doctors of all specialties (military personnel). Among the 43, seven subjects were diagnosed with psychosis. These 43 individuals were not excluded from the total sample data set in the presentation that followed but their exclusion did not change any of the Wndings. The four validity items of the TCI-R questionnaire were used to exclude 296 subjects (20.8% of the 1,657) that responded incorrectly in at least one of these items, thus ensuring the collaboration of the responders in these self-report scales. These items were of the type “please answer this question by ticking box 4”and a wrong answer would indicate that the individual was responding at random. Another 274 subjects (20.1% of the remaining 1,361) did not comply with the criteria for successful performance of the pursuit task (see below for deWnition of these criteria). The analyses were performed on the remaining sample of 1,087 subjects (valid responders). Apparatus A detailed description of the apparatus for eye movement measurements is given in a prior report
123
400
(Smyrnis et al. 2003). Eye movements were recorded from the right eye only using the IRIS SCALAR® infrared device. A 12-bit A/D converter was used for data acquisition (Advantech® PC-Lab Card 818L). Eye movement data were sampled at 600 Hz and were stored in the PC hard disk for oV-line data processing. Procedure Each subject initially performed a calibration procedure. A target (white cross 0.5 £ 0.5°) appeared at the center of the visible screen and then at constant intervals of 2 s moved successively 10° to the right back to the center, 10° to the left and back of the center. This cycle was repeated twice and then two more cycles were performed at distances of 5°. The subjects were instructed to look at the visual target. We thus recorded four saccades for each of four positions (left/ right, 5/10°). If necessary left/right diVerences in amplitude were corrected with a manual adjustment of the IRIS device gain control and the calibration procedure was repeated. Then the subject was instructed to follow a target (white cross 0.5 £ 0.5°) that was moving horizontally on the computer monitor in constant speed. The visual angle of the moving target was §10° from the center of the screen. We used Wve target speeds (10, 20, 30, 40 and 50 deg/s). The subject completed Wve cycles for each target speed consisting of the target moving 20° to the left and then 20° to the right at constant speed. The target started moving at the speed of 10 deg/s. After completion of the Wve cycles the target increased speed and the subject continued tracking at 20 deg/s then at 30 deg/s, etc., until all Wve target speeds were presented. There was no stop between changes in target speed. In this analysis we report data on the Wrst three of the target speeds (10–30 deg/s). The reason for excluding the speed of 40 and 50 deg/s was that at these target speeds a large proportion of subjects would change to a diVerent strategy and would not pursue the target but would make large predictive saccades from one corner of the screen to the other. Quantitative assessment of smooth eye pursuit A PC program was used to calculate the root-meansquare error between the eye position and the target position record at each target speed (10, 20, and 30 deg/s). The root-mean-square error is a global measure of pursuit accuracy and increases with increasing dissimilarity between the eye position and the target position. We excluded root-mean-square error
123
Exp Brain Res (2007) 179:397–408
measurements where the eye position signal had saturated for more than 10% of the total signal duration. We also excluded the top 2.5% of root-mean-square error scores at each target speed that were considered as extremely low quality pursuit signals. An interactive PC program (created using the TestPoint® CEC) was used for detection and measurement of pursuit gain and number of saccades from the eye movement record. First the calibration amplitude data were entered into a polynomial model (using the “Wtpolynomial” function of Testpoint) and a linear Wt was used to adjust for small left/right hemiWeld diVerences in amplitude measurement that could not be detected by the experimenter. This linearization process was important in order to make sure that left and right pursuit displacement was measured with the same accuracy. The program then selected a period of 133 ms centered at the point where the target crossed the center of the screen (two periods per run, ten periods for each target speed). This window was selected in order to measure eye velocity at the primary position (Leigh and Zee 1991). The operator manually discarded the period if an artifact was detected (i.e., a blink). If the period was artifact free, then the program computed the instantaneous velocity by simple numeric diVerentiation. No Wltering was applied to instantaneous velocity. After computing the instantaneous velocity the program derived a median value of it for all the period scanned. Then the program identiWed particular points where the instantaneous velocity exceeded the median value by more than twofold, an abrupt increase in instantaneous velocity that is synonymous to an abrupt acceleration of the eye. This large acceleration cannot be explained by smooth pursuit at a constant speed; thus, by inference a saccade has began. Although this criterion is not the one typically used in the saccade detection (a saccade velocity over a certain threshold), we found that it was very good at detecting saccades without over-including saccades in the high pursuit speed records or missing saccades in the low speed records. The program considered these instances as occurrences of saccadic eye movements and measured their latency from the period onset and their duration. The saccades were marked on the pursuit record and the operator could accept or reject them by inspection. After excluding all time segments with saccades, the remaining pure pursuit segments were marked on the position trace and were used to measure mean velocity (amplitude diVerence divided by the total segment time) for the segment and Wnally by dividing the mean velocity with the corresponding target velocity to derive a gain value for the particular
Exp Brain Res (2007) 179:397–408
segment. For each individual, the following smooth eye pursuit performance indices were evaluated: (1) median pursuit gain at each target speed (10, 20, 30 deg/s); (2) saccade frequency at each target speed which was the total number of saccades for all periods without artifacts divided by the sum of these time periods. The indices of pursuit gain and saccade number for a particular speed for a particular subject were considered valid if they were derived from at least three periods of measurements free of artifacts. The analysis was performed only for subjects that had valid measurements in all nine indices of pursuit performance (see section on Participants and materials). Statistical analysis Repeated measures analysis of variance (ANOVA) was used to test for diVerences between target speeds for root-mean-square error, gain and saccade frequency in the total sample and to test for the eVects of level of education (Wve levels) on these pursuit indices. We then used two approaches to analyze the relation of psychometric scores to pursuit performance. The Wrst approach is to test the eVects of psychometric score variables on pursuit performance globally within the total sample without grouping into subgroups with speciWc characteristics. For this purpose we used the general linear model to test for the eVects of the psychometric variables (schizotypy, anxiety and depression) on each one of the three pursuit performance measures (root-mean-square error, pursuit gain, saccade frequency) in the total sample using the three target speeds as the repeated measures within subject factor. The general linear model is a generalization of the linear regression model, such that eVects can be tested for categorical predictor variables (an ANOVA design), as well as for continuous predictor variables (a multiple regression design) and in designs with multiple dependent variables as well as with a single dependent variable. We also considered a general linear model where four SPQ factor scores were entered as continuous predictors instead of the total SPQ score. The second approach was based on the deWnition of speciWc subgroups within the total sample. In this group analysis we used the criterion of 2 standard deviations (2 SD) to derive groups with a very high schizotypy score. Note that these groups were not mutually exclusive. We thus derived a high PAS score group (N = 55 subjects), a high SPQ score group (N = 26 subjects) and four groups of individuals with similarly deWned high scores in each of the four factors of SPQ (cognitive perceptual group N = 34 subjects; negative group N = 41 subjects; disorganization group N = 23
401
subjects; paranoid group N = 19 subjects). The high PAS and high SPQ groups were partially overlapping, that is 13 individuals belonged to both groups. Two more groups of high anxiety (N = 54 subjects) and high depression (N = 45 subjects) were derived from SCL90-R scores on anxiety and depression. Again these groups were partially overlapping, that is 25 individuals belonged to both groups. Repeated measures ANOVA with within subjects factor the target speed and between subjects factor the group (total sample versus high score group) was used to assess the eVect of group on each one of the pursuit indices of performance (root-mean-square error, gain, saccade frequency). All statistical analyses were performed using the STATISTICA 6.0 software (STATSOFT Inc. 1984–2001).
Results General characteristics and psychometric proWle of participants Table 1 shows the descriptive statistics for age and education of the participants. It also presents the descriptive statistics for the PAS score, SPQ total score and SCL90-R anxiety and depression scores in the total sample. In a previous paper we described in detail the conWrmatory factor analysis that was used to decompose SPQ (Stefanis et al. 2004). On the basis of this analysis a four factor model was the best in describing this data set. The Wrst factor loaded on the subscales of odd beliefs and odd perceptual experiences (cognitiveperceptual). The second factor loaded on suspiciousness, social anxiety, no close friends and constricted aVect (negative). The third factor loaded on odd behavior and odd speech (disorganization) and the fourth factor loaded on social anxiety, suspiciousness and ideas of reference (paranoid).
Table 1 Mean and standard deviation (SD) for the total sample data
Age Education PAS SPQ Anxiety Depression
Mean
SD
20.9 12.6 7.54 27.34 8.22 13.86
1.9 1.87 5.27 12.41 6.59 8.48
PAS perceptual aberration scale, SPQ schizotypal personality questionnaire, Anxiety: symptom checklist 90-R anxiety scale, Depression: symptom checklist 90-R depression scale
123
402
Exp Brain Res (2007) 179:397–408 5
The root-mean-square error increased with increasing target speed (F2,2172 = 451, P < 10¡5) (Fig. 1), the gain decreased (F2,2172 = 595, P < 10¡5) (Fig. 2) and the saccade frequency increased (F2,2172 = 337, P < 10¡5) (Fig. 3). The level of education had no signiWcant eVect on root-mean-square error (F4,1082 = 0.5, P > 0.7) or interaction with target speed (F8,2164 = 1, P > 0.4). The level of education also had no signiWcant eVect on pursuit gain (F4,1082 = 0.25, P > 0.9) or interaction with target speed (F8,2164 = 126, P > 0.2). Finally, there was no signiWcant eVect of level of education on saccade frequency (F4,1082 = 0.6, P > 0.6) neither a signiWcant interaction with target speed (F8,2164 = 1.12, P > 0.3).
4
EVect of psychometric scores on pursuit performance in the total sample Root-mean-square error As described in the Methods section, this analysis focused on the eVects of psychometric scores on rootTotal Sample
240
High PAS
RMSE
200 160 120 80 40 0 10 deg/sec
20 deg/sec
GAIN
1.0
Total Sample
0.9
Disorganization
0.8 0.7 0.6 0.5 20 deg/sec
30 deg/sec
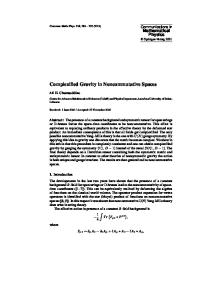
Fig. 2 Histograms showing the pursuit gain (GAIN) at 10, 20 and 30 deg/s for the group with high scores (>SD) in the disorganization factor of the schizotypal personality questionnaire (SPQ) compared to the total sample for the three diVerent target speeds. Bars represent standard errors of the mean
123
Total Sample Disorganization
3 2 1 0 10 deg/sec
20 deg/sec
30 deg/sec
Fig. 3 Histograms showing the saccade frequency (SF) in saccades per second at 10, 20 and 30 deg/s for the group with high scores (>SD) in the disorganization factor of the schizotypal personality questionnaire (SPQ) compared to the total sample for the three diVerent target speeds. Bars represent standard errors of the mean
mean-square error in the total sample. In the Wrst analysis we used as independent variables (predictors) the SPQ total score, the PAS score and the SCL90-R anxiety and depression scores and as the repeated measures dependent variables, the root-mean-square errors at the three diVerent speeds. Part A of Table 2 presents the results of the general linear model analysis. It can be seen that none of the psychometric variables had a signiWcant main eVect on root-mean-square error and there was no signiWcant interaction of the eVect of these variables and target speed. In the second analysis we used as independent variables the four factors of SPQ. Part A of Table 3 presents the results of this analysis. It can be seen that none of the SPQ factors had signiWcant main eVect on root-mean-square error and there was no signiWcant interaction between these variables and target speed.
30deg/sec
Fig. 1 Histograms showing the root-mean-square error (RMSE) at 10, 20 and 30 deg/s for the high perceptual aberration scale (PAS) schizotypy group (PAS > 2 SD) compared to the total sample for the three diVerent target speeds. Bars represent standard errors of the mean
10 deg/sec
SF (sac / sec)
Pursuit performance
Pursuit gain The same general linear model analysis was used to study the eVect of psychometric scores on pursuit gain in the total sample. In the Wrst analysis we used as independent variables (predictors) the SPQ total score, the PAS score and the SCL90-R anxiety and depression scores and as the repeated measures dependent variables, the pursuit gains at the three diVerent speeds. Part B of Table 2 presents the results of the general linear model analysis. It can be seen that none of the psychometric variables had a signiWcant main eVect on pursuit gain and there was no signiWcant interaction of the eVect of these variables and target speed. Part B of Table 3 presents the results of the second analysis that used the four factors of SPQ as independent variables. It can be seen that none of the SPQ factors had a signiWcant main eVect on pursuit gain and there was no signiWcant interaction between these variables and target speed.
Exp Brain Res (2007) 179:397–408
403
Table 2 The table presents the results of general linear model analysis on the eVects of psychometric variables Predictors
Main eVect F
Main eVect P
Model A: repeated measures factor: root-mean-square error (three target speeds) PAS 1.45 0.22 SPQ 3.68 0.06 Anxiety 0.07 0.78 Depression 1.02 0.31 Model B: repeated measures factor: pursuit gain (three target speeds) PAS 0.67 0.41 SPQ 0.90 0.34 Anxiety 1.06 0.30 Depression 0.01 0.91 Model C: repeated measures factor: saccade frequency (three target speeds) PAS 0.08 0.76 SPQ 1.33 0.24 Anxiety 0.50 0.47 Depression 0.22 0.63
Interaction F
Interaction P
1.01 0.10 1.68 1.70
0.36 0.90 0.18 0.18
0.60 0.03 0.06 0.65
0.54 0.96 0.93 0.52
1.13 0.12 0.06 0.47
0.32 0.88 0.94 0.62
PAS perceptual aberration scale, SPQ schizotypal personality questionnaire, Anxiety: SCL90-R anxiety scale, Depression: SCL90-R depression scale
Table 3 The table presents the results of general linear model analysis on the eVects of the SPQ factors Predictors
Main eVect F
Main eVect P
Model A: repeated measures factor: root-mean-square error (three target speeds) Cognitive-perceptual 0.88 0.34 Negative 1.68 0.19 Disorganization 0.02 0.87 Paranoid 0.39 0.53 Model B: repeated measures factor: pursuit gain (three target speeds) Cognitive-perceptual 1.60 0.20 Negative 0.07 0.79 Disorganization 1.04 0.30 Paranoid 0.005 0.94 Model C: repeated measures factor: saccade frequency (three target speeds) Cognitive-perceptual 0.01 0.89 Negative 3.05 0.08 Disorganization 0.08 0.77 Paranoid 0.17 0.67
Interaction F
Interaction P
0.65 0.83 2.56 0.86
0.52 0.43 0.08 0.42
0.81 0.96 0.39 0.81
0.44 0.38 0.67 0.44
0.59 4.48 0.96 0.12
0.54 0.01 0.38 0.88
SigniWcant results at the level of <0.05 are marked with bold characters
Saccade frequency Finally the general linear model analysis was used to study the eVect of psychometric scores on saccade frequency in the total sample. In the Wrst analysis we used as independent variables (predictors) the SPQ total score, the PAS score and the SCL90-R anxiety and depression scores and as the repeated measures dependent variables, the saccade frequencies at the three diVerent speeds. Part C of Table 2 presents the results of the general linear model analysis. It can be seen that none of the psychometric variables had a signiWcant main eVect on saccade frequency and there was no signiWcant interaction of the eVect of these variables and target speed. Part C of Table 3 presents the results of the second analysis that used the four factors of SPQ as independent variables. It can be seen that none of the
SPQ factors had a signiWcant main eVect on saccade frequency and there was no signiWcant interaction between these variables and target speed except for the negative factor. The univariate analysis showed that there was no signiWcant eVect of the negative SPQ factor on saccade frequency at 10 deg/s (F1,1080 = 0.6, P > 0.4) nor at 20 deg/s (F1,1080 = 1.33, P > 0.2) but only at 30 deg/s (F1,1080 = 7.13, P < 0.05). We then used linear regression with negative SPQ factor scores as the independent variable and saccade frequency at 30 deg/s as the dependent variable to investigate this signiWcant eVect of the negative SPQ factor scores on saccade frequency only at the target speed of 30 deg/s. The regression conWrmed a positive relation, thus suggesting an increase in saccade frequency with increasing negative schizotypy in the total sample. The regression r2 though was 0.005, which means that the variance in
123
404
saccade frequency explained by the variation in the negative factor of schizotypy was 0.5%. In other words this eVect of increasing negative schizotypy on saccade frequency, although statistically signiWcant, was extremely small. DiVerence in pursuit performance between predeWned high psychometric score groups and the total sample Root-mean-square error In this analysis we used a set of repeated measures ANOVAs to compare the root-mean-square error (repeated measures dependent variable) of groups with scores >2 SD in PAS, SPQ total score, SPQ factor scores, SCL90-R anxiety and depression with the root-mean-square error for the total sample (see Methods section). None of these ANOVA analyses showed a signiWcant diVerence in root-mean-square error between the high psychometric score groups and the total sample with one exception. There was a signiWcant increase of root-mean-square error in the high PAS group compared to the total sample (F1,1085 = 3.87, P < 0.05). Moreover, the nonsigniWcant interaction eVect of group versus target speed (F2, 2170 = 1.02, P > 0.3) conWrmed that this increase in rootmean-square error in the high PAS group was present for all target speeds as seen in Fig. 2. Pursuit gain In this analysis we used a set of repeated measures ANOVAs to compare the pursuit gain (repeated measures dependent variable) of groups with scores >2 SD in PAS, SPQ total score, SPQ factor scores, SCL90-R anxiety and depression with the gain for the total sample (see Methods section). None of these ANOVA analyses showed a signiWcant diVerence in pursuit gain between the high psychometric score groups and the total sample with one exception. There was a signiWcant decrease of pursuit gain in the high SPQ disorganization factor group compared to the total sample (F1,1083 = 5.66, P < 0.02). Moreover, the nonsigniWcant interaction eVect of group versus target speed (F2,2166 = 0.95, P > 0.3) conWrmed that this decrease in pursuit gain in the high disorganization group was present for all target speeds as seen in Fig. 2. Saccade frequency In this analysis we used a set of repeated measures ANOVAs to compare the saccade frequency (repeated measures dependent variable) of groups with scores
123
Exp Brain Res (2007) 179:397–408
>2 SD in PAS, SPQ total score, SPQ factor scores, SCL90-R anxiety and depression with the saccade frequency for the total sample (see Methods section). None of these ANOVA analyses showed a signiWcant diVerence in pursuit gain between the high psychometric score groups and the total sample with one exception. There was a signiWcant increase in saccade frequency in the high SPQ disorganization factor group compared to the total sample (F1,1083 = 5.26, P < 0.03). Moreover, the nonsigniWcant interaction eVect of group versus target speed (F2,2166 = 0.82, P > 0.4) conWrmed that this increase in saccade frequency in the high disorganization group was present for all target speeds as seen in Fig. 3.
Discussion Pursuit performance in a large sample of young men In this report we present the data from the analysis of pursuit records in a large sample of young adults. In previous reports (Smyrnis et al. 2003, 2004) we presented the analysis on the antisaccade and eye-Wxation performance of the same sample. All this data are derived from the oculomotor database of the ASPIS study. The Wnal aim for this project is the follow-up on these individuals at regular intervals in the coming years for the development of psychiatric symptoms. Our sample of young men is by deWnition not representative of the general population; however, it is generally representative of young Greek males since military service is obligatory in Greece and thus all males from all areas must participate barring disabilities. As such, the military provides not only a large pool of subjects, but also one which facilitates evaluation of psychosis in a longitudinal study. The pursuit performance data provided in this report could be of importance in the large literature that uses smooth eye pursuit as a tool for investigating dysfunction in schizophrenia. So far all indications of a dysfunction in this task come from group comparisons between a control group and a patient group. It would be then of importance to have large sample data on this task although the issue remains that the speciWc pursuit task used varies from study to study and the deWnition of measures of pursuit performance also diVer from study to study (Levy et al. 1993), thus limiting any attempt of generalization of our derived mean values of pursuit performance to normative values. Our sample included young adults (18–25 years of age). It has been shown that pursuit performance reaches adult levels at the age of 17–18 and then
Exp Brain Res (2007) 179:397–408
remains stable until the age of 65 (Katsanis et al. 1998). Younger children show worse pursuit performance than adolescents and adults (Katsanis et al. 1998), while older adults (older than 65 years) also show a deterioration of pursuit performance (Kaufman and Abel 1986). Thus, our sample is a representative estimate of performance within the adult range. Two other confounding factors are education and gender. We found that the level of education did not have a signiWcant eVect on any of the pursuit indices measured in our study. Finally, to our knowledge, the issue of gender diVerences in the pursuit performance of healthy adults has not been systematically addressed in the relevant literature although in one study diVerences of pursuit performance between men and women did not reach statistical signiWcance (Simons and Katkin 1985). Pursuit quality and schizotypy In this study root-mean-square error was used to assess the pursuit quality in a quantitative way. This measure is considered analogous to the qualitative assessment of pursuit records that has been widely used in earlier studies (Levy et al. 1993). There was no relation of root-mean-square error and psychometric variable scores in the total sample, thus refuting the hypothesis of a phenotypic continuum of ETD and schizotypy as psychosis proneness predictors in the population (see Introduction). Furthermore, as predicted by the schizotaxia hypothesis, only a small group of individuals with very high scores in PAS showed a signiWcant increase of root-mean-square error for all target speeds, thus showing ETD. It should be emphasized here that our results should not be seen as an “acid test” to reject one or the other of the hypotheses of a phenotypic continuum and of schizotaxia. What we claim is that our data indeed are compatible with the schizotaxia hypothesis and favor the existence of a schizotypal group with ETD. In this respect our data conWrm previous reports on eye-tracking abnormalities in the individuals with very high scores in schizotypy measured with PAS (O’Drsicoll et al. 1998; Gooding et al. 2000) and extend these Wndings to conWrm the absence of signs of ETD in the majority of individuals that do not have a very high score on PAS. In a previous report (Smyrnis et al. 2003) we showed that the same high PAS group had a higher rate of antisaccade errors and a higher variability in the latency of antisaccade eye movements while again there was no relation of antisaccade performance indices and schizotypy in the total sample. In a recent study Holahan and O’Driscoll (2005) found that individuals with high scores in PAS had a signiWcantly higher antisaccade error rate and
405
ETD and suggested that a group with predominantly positive symptoms of schizotypy presented with a combination of antisaccade and smooth pursuit deWcits. The converging evidence from these studies is that a phenotypic group that shares positive psychotic-like experiences and eye movement abnormalities in both the saccadic and smooth pursuit systems might be distinct from the population of healthy individuals. In this line of reasoning it is important to point that the PAS scale assesses a qualitative latent entity that is found at the highest 5–10% of the score distribution, thus identifying schizotypy as a category (Lenzenweger 1994). In contrast the SPQ scale has been decomposed into three factors and it has been used to assess diVerent dimensions of schizotypy in the population favoring the completely dimensional view of psychopathology (Reynolds et al. 2000). Thus, PAS is by design a better instrument to detect a phenotypic distinct group. Pursuit gain, saccade frequency and schizotypy In addition to the measurement of global pursuit quality using the root-mean-square error, we measured speciWc indices of pursuit performance, namely the gain and the saccade frequency. For these measures we used only the middle portion of the pursuit record that corresponds to the eye crossing the primary position. We chose this window because it is considered as the optimal window where the pursuit system should function perfectly (Leigh and Zee 1991). Any deviances on these measures are indicative of a speciWc deWcit in the pursuit eye movement system. In the relevant literature it has been discussed that speciWc measures of pursuit performance are not as good indicators of ETD in schizophrenia as the more global measures (Levy et al. 1993). The two studies that used speciWc measures of pursuit performance in schizotypy, such as gain and saccade frequency, report contradicting results. Siever et al. (1994) found no diVerence in pursuit gain and saccade frequency for individuals with schizotypal personality disorder. Gooding et al. (2000) found that individuals with high scores in self-reporting schizotypy scales had signiWcantly lower pursuit gain than controls and no diVerence in saccade frequency. We found no relation of gain or saccade frequency with the psychometric variables except for an interaction eVect of saccade frequency and target speed for the negative factor of SPQ. There was an increase of saccade frequency with an increase in negative schizotypy and this eVect was observed only at the highest speed of 30 deg/s. The magnitude of this eVect though was extremely small (the common variance explained was less than 1%).
123
406
Using the high score groups resulted in a signiWcant eVect only for the high SPQ disorganization factor group. This group had lower pursuit gain and higher saccade frequency at the primary position compared to the total sample for all target speeds. The dysfunctions in this group are in speciWc areas of cognition. Interestingly, a signiWcant correlation of the disorganization factor of SPQ and Wxation instability was found in our previous study (Smyrnis et al. 2004). It could be argued then that another high-risk group, partially distinct from the high PAS group (the two groups overlapped for nine individuals), is related to a speciWc instability in the eye Wxation and pursuit system. In accordance with this view Holahan and O’Driscoll (2005) found that ETD but not antisaccade performance deWcits were present in a group with high scores in the negative symptoms of schizotypy measured with the physical Anhedonia scale. Individuals with very high scores in this scale have cognitive deWcits that are also observed in schizophrenia. Thus a speciWc deWcit in smooth eye pursuit could be associated with the proWle of cognitive dysfunction found in the disorganization cluster of schizophrenia symptoms. If ETD is related to cognitive dysfunction and disorganization symptoms in schizophrenia spectrum disorders then it is of importance to know the neural substrate of ETD in schizophrenia. Although there is a very large literature on smooth pursuit abnormalities in schizophrenia and the schizophrenia spectrum disorders, there are very few data on the possible neural substrate of ETD dysfunction in schizophrenia. It is known from neuroimaging studies that smooth eye pursuit performance activates an extended network of cortical and subcortical areas including the frontal eye Welds, supplementary eye Welds, intraparietal sulcus, precuneous, extrastriate areas (medial temporal cortex and medial superior temporal cortex) and the cingulate cortex (Berman et al. 1999; O’Driscoll et al. 2000). O’Driscoll et al. (1999) used PET in a group of relatives of patients with schizophrenia and showed that those relatives with ETD had signiWcantly less activation of the frontal eye Welds compared to relatives with normal pursuit. Tregellas et al. (2004) used fMRI and reported that medicated patients with schizophrenia compared to controls showed increased activation in the posterior hippocampi and the right fusiform gyrous in smooth eye pursuit. In a region of interest analysis of areas known to be activated during smooth eye pursuit, they observed decreased activation in the frontal eye Weld, cingulate gyrous and medial occipital cortex. In another study Hong et al. (2005) examined the neural substrate in predictive smooth eye pursuit in medicated patients with schizophrenia and normal controls and
123
Exp Brain Res (2007) 179:397–408
showed that in this case, where subjects do not rely on retinal motion signals for pursuit, the patients had decreased activation in the frontal and supplementary eye Welds, medial superior temporal cortex and cingulated gyrous. In yet another study Lencer et al. (2005) examined MT and MST in smooth eye pursuit and showed reduced activity in medicated patients with schizophrenia. Finally in a recent study comparing Wrst episode never-medicated patients with schizophrenia and controls, Keedy et al. (2006) found reduced activity in all cortical areas involved in smooth eye pursuit control and suggested a system level dysfunction. All these studies point to a diVuse dysfunction of cortical areas involved in pursuit in schizophrenia. There are yet no studies of the neural substrate of ETD in schizotypy. In conclusion there is no clear evidence of speciWc cortical dysfunction related to ETD in schizophrenia and the question of cortical dysfunction related to ETD in schizotypy has not yet been investigated. Pursuit performance and depression–anxiety The analysis of pursuit performance conWrmed that there was no eVect of the levels of current state anxiety or depression on pursuit performance in the total sample. This was true both for the root-mean-square error measuring global pursuit quality and speciWc measures such as gain and saccade frequency. Furthermore there was no diVerence in any of the pursuit indices of performance in the high anxiety and high depression groups compared to the total sample. Since anxiety and depression symptoms are often present in individuals with schizotypal personality characteristics, the lack of relation of these symptoms with pursuit performance is further evidence for the speciWcity of the relation of ETD and high schizotypy.
Conclusions Smooth eye pursuit performance was assessed in a large sample of young men. Pursuit performance deteriorated with increasing target speed, as expected. The level of education and current state psychopathology (anxiety-depression) had no eVect on pursuit performance in this population. Increasing schizotypy was not related to pursuit performance in the total sample. SpeciWc subgroups though with very high schizotypy had some indication of an ETD compared to the total sample favoring the hypothesis of schizotaxia. The results from this study, in combination with our previous Wndings for antisaccade and Wxation performance deWcits, favor the hypothesis that psychometrically
Exp Brain Res (2007) 179:397–408
deWned subpopulations with speciWc eye movement function deWcits within the general population, might present high-risk groups for the development of psychosis and oVer the possibility to study candidate genes in schizophrenia in these groups. Acknowledgments This work was supported by the grant “EKBAN 97” to Professor C.N. Stefanis from the General Secretariat of Research and Technology of the Greek Ministry of Development. “Intrasoft Co” provided the technical support for this project. We would like to thank the following colleagues, in alphabetical order, that helped in data acquisition and preprocessing: Katerina Eustratiadi, Ioannis Giouzelis, Georgios Kastrinakis, Catherine Paximadis, Christos Theleritis.
References Berman RA, Colby CL, Genovese CR, Voyovodic JD, Luna B, Thulborn KR, Sweeney JA (1999) cortical networks subserving pursuit and saccadic eye movements in humans: an fMRI study. Hum Brain Map 8:209–225 Derogatis LR, Lipman RS, Rickels K, Uhlenhuth EH, Covi L (1974) The Hopkins symptom checklist (HSCL): a selfreport symptom inventory. Behav Sci 19:1–15 Chapman LJ, Chapman JP, Raulin ML (1978) Body image aberration in schizophrenia. J Abnorm Psychol 87:399–407 Chapman LJ, Chapman JP, Kwapil TR, Zinser MC (1994) Putatively psychosis prone subjects 10 years later. J Abnorm Psychol 103:171–183 Claridge G (1994) Single indicator of risk for schizophrenia: probable fact or likely myth? Schizophr Bull 20:151–168 Cloninger CR, Svrakic DM, Przybeck TR (1993) A psychobiological model of temperament and character. Arch Gene Psychiatr 50:975–990 Eysenck HJ, Eysenck SBG (1976) Psychoticism as a dimension of personality. Hodder & Stoughton, London Gooding DC, Miller MD, Kwapil TR (2000) Smooth pursuit eye tracking and visual Wxation in psychosis-prone individuals. Psychiatr Res 93:41–54 Holahan AV, O’Driscoll GA (2005) Antissacade and smooth pursuit performance in positive- and negative-symptom schizotypy. Schizophr Res 76:43–54 Holzman PS, Levy DL (1977) Smooth pursuit eye movements and functional psychoses: a review. Schizophr Bull 3:15–27 Holzman PS, Matthysse S (1990) The genetics of schizophrenia: a review. Psychol Sci 1:279–286 Holzman PS, Proctor LR, Hughes DW (1973) Eye-tracking patterns in schizophrenia. Science 181:179–181 Holzman PS, Proctor LR, Levy DL, Yasillo NJ, Meltzer HY, Hurt SW (1974) Eye-tracking dysfunctions in schizophrenic patients and their relatives. Arch Gen Psychiatr 31:143–151 Hong LE, Tagamets M, Avila M, Wonodi I, Holcomb H, Thaker GK (2005) SpeciWc motion processing pathway deWcit during eye tracking in schizophrenia: a performance-matched functional magnetic resonance imaging study. Biol Psychiatr 57:726–732 Katsanis J, Iacono WG, Harris M (1998) Development of oculomotor functioning in preadolescence, adolescence, and adulthood. Psychophysiology 35:64–72 Kaufman SR, Abel LA (1986) The eVects of distraction on smooth pursuit in normal subjects. Acta Otolaryngol 102:57–64 Keedy SK, Ebens CL, Keshavan MS, Sweeney JA (2006) Functional magnetic resonance imaging studies of eye movements
407 in Wrst episode schizophrenia: Smooth pursuit, visually guided saccades and the oculomotor delayed response task. Epub Leigh JR, Zee DS (1991) The neurology of eye movements, 2nd edn. F.A. Davis Company, Philadelphia Lencer R, Nagel M, Sprenger A, Heide W, Binkofski F (2005) Reduced neuronal activity in the V5 complex underlies smooth-pursuit deWcit in schizophrenia: evidence from an fMRI study. Neuroimage 24:1256–1259 Lencz T, Raine A, Scerbo A, Redmon M, Brodish S, Holt L, Bird L (1993) Impaired eye tracking in undergraduates with schizotypal personality disorder. Am J Psychiatr 150:152– 154 Lenzenweger MF (1994) Psychometric high-risk paradigm, perceptual aberrations and schizotypy: an update. Schizophr Bull 20:121–135 Levy DL, Holzman PS, Matthysse S, Mendell N (1993) Eyetracking dysfunction and schizophrenia: a critical perspective. Schizophr Bull 19:461–536 Matthysse S, Holzman PS, Lange K (1986) The genetic transmission of schizophrenia: Application of mendelian latent structure analysis to eye tracking dysfunctions in schizophrenia and aVective disorder. J Psychiatr Res 20:57–65 Meehl PE (1989) Schizotaxia revisited. Arch Gen Psychiatr 46:935–944 Ntonias S, Karastergiou A, Manos N (1990) Standardization of the symptom checklist 90-R rating scale in a Greek population. Psychiatriki 2:42–48 O’Driscoll GA, Lenzenweger MF, Holzman PS (1998) Antisaccades and smooth pursuit eye tracking and schizotypy. Arch Gen Psychiatr 55:837–843 O’Driscoll GA, Benkelfat C, Florencio PS, WolV AL, Joober R, Lal S, Evans AC (1999) Neural correlates of eye tracking deWcits in Wrst-degree relatives of schizophrenic patients: a positron emission tomography study. Arch Gen Psychiatr 56:1127–1134 O’Driscoll GA, WolV AL, Benkelfat C, Florencio PS, Lal S, Evans AC (2000) Functional neuroanatomy of smooth pursuit and predictive saccades. Neuroreport 11:1335–1340 Raine A (1991) The SPQ: a scale for the assessment of schizotypal personality in a non-clinical sample-the role of task demand. Schizophr Bull 17:555–564 Reynolds CA, Raine A, Mellingen K, Venables PH, Mednick SA (2000) Three-factor model of schizotypal personality: Invariance across culture, gender, religious aYliation, family adversity, and psychopathology. Schizophr Bull 26:603– 618 Siever LJ, Coursey RD, Alterman IA, Buchsbaum MS, Murphy DL (1984) Impaired smooth pursuit eye movement: vulnerability marker for schizotypal personality disorder in a normal volunteer population. Am J Psychiatr 141:1560–1566 Siever LJ, Keefe R, Bernstein DP, Coccaro EF, Klar HM, Zemishlany Z, Peterson AE, Davidson M, Mahon T, Hovarth T, Mohs R (1990) Eye tracking impairment in clinically identiWed patients with schizotypal personality disorder. Am J Psychiatr 147:740–745 Siever LJ, Friedman L, Moscowitz J, Mitropoulou V, Keefe R, Roitman SL, Merhige D, Trestman R, Silverman J, Mohs R (1994) Eye movement impairment and schizotypal psychopathology. Am J Psychiatr 151:1209–1215 Simons RF, Katkin W (1985) Smooth pursuit eye movements in subjects reporting phsycial nhedonia and perceptual aberrations. Psychiatr Res 14:275–289 Smyrnis N, Evdokimidis I, Stefanis NC, Avramopoulos D, Costantinidis TS, Stavropoulos A, Stefanis CN (2003) Antisaccade performance of 1273 men: eVects of schizotypy, anxiety, and depression. J Abnorm Psychol 112:403–414
123
408 Smyrnis N, Kattoulas E, Evdokimidis I, Stefanis NC, Avramopoulos D, Pantes G, Theleritis C, Stefanis CN (2004) Active eye Wxation performance in 940 young men: eVects of IQ, schizotypy, anxiety and depression. Exp Brain Res 156:1–10 Stefanis NC, Smyrnis N, Avramopoulos D, Evdokimidis I, Tzoufras I, Stefanis CN (2004) Factorial composition of self rated schizotypal traits amongst young males undergoing military training: The ASPIS. Schizophr Bull 30:335–350
123
Exp Brain Res (2007) 179:397–408 Thaker GK, Cassady S, Adami H, Moran M, Ross DE (1996) Eye movements in spectrum personality disorders: comparison of community subjects and relatives of schizophrenic patients. Am J Psychiatr 153:362–368 Tregellas JR, Tanabe JL, Miller DE, Ross RG, Olincy A, Freedman R. (2004) Neurobiology of smooth pursuit eye movement deWcits in schizophrenia: an fMRI study. Am J Psychiatr 161:315–321