IMA Journal of Mathematics Applied in Medicine & Biology (1992) 9, 67-106
Some results for an SEIR epidemic model with density dependence in the death rate DAVID GREENHALGH
Department of Statistics and Modelling Science, University of Strathclyde, Livingstone Tower, 26 Richmond Street, Glasgow, Gl 1XH, Scotland [Received 30 May 1991 and in revised form 3 December 1991] This paper deals with an SEIR epidemic model for an infectious disease where the death rate depends on the number of individuals in the population. It is also assumed that there is an additional death rate suffered by infected individuals. It is found that there are three steady-state values: one where the population is extinct, one where the population maintains itself at a constant level and the disease is extinct, and one where there is a unique equilibrium with disease present. An interesting and unusual feature is that it is possible for this third equilibrium to exist and be locally unstable. Numerical work and simulation show that we can have cycles of disease incidence with increasing amplitude, a constant amplitude, and a decreasing amplitude, depending on the parameter values of the model. Keywords: density dependence; SEIR epidemic model; equilibrium and stability analyses; threshold values; numerical simulation.
1. Introduction
This paper deals with an epidemic model for infectious diseases such as measles in developing countries or yellow fever in monkey populations. We are interested in looking at models where the model parameters which describe the transmission of the disease and the death rate of individuals depend on the population density (which means the number of individuals in the population). Mollison (1985) discusses the dependence of the transmission coefficient on population density, as do Dietz & Schenzle (1985), but in this paper we shall discuss the situation where the per capita death rate depends on population density. We discuss the results first where the death rate is a constant and second for a model where the death rate depends on population density. This second situation is more likely to apply to animal and insect populations than human populations as density dependence has a greater influence on mortality for nonhuman hosts. The classical logistic equation for population growth, first discussed by Verhulst (1838), takes account of the fact that a population cannot grow indefinitely. This model assumes that the death rate per individual increases in direct proportion to the number of individuals in the population. A similar assumption is made in the classical Lotka-Volterra predator-prey model (Nisbet & Gurney, 1982). These assumptions mean that there is competition amongst individuals for scarce resources and so the death rate increases as the population size increases. Our model also assumes that infected individuals die at an increased rate because they have the 67 © Oxford University Press 1992
68
DAVID GREENHALGH
disease. A similar model for viral disease in a population of laboratory mice is discussed by Anderson (1979). McLean & Anderson (1988a,b) discuss a model which also incorporates this feature. McLean & Anderson's model is an age-structured model for measles in developing countries such as India where measles is a significant cause of mortality. We have studied similar models for infectious disease previously. In Greenhalgh (1990a) we examined an SIR model with density dependence in the death rate. In an SIR model an individual starts off susceptible, at some stage catches the disease, and after a short infectious period becomes permanently immune to it. In a later paper (Greenhalgh, 1992a) we looked at how these results applied to an SIS model. In such a model an individual starts off susceptible, at some stage catches the disease, but then becomes susceptible again. Such models are sometimes used for sexually transmitted diseases such as gonorrhoea (Nold, 1980). Another paper examines the extension of some of these results to a model with vaccination (Greenhalgh, 1992b). All of these papers prove similar results which can be summarized as follows. There are three possible equilibrium situations. In thefirst,which is always possible, the population is extinct. In the second, which is possible when the birth rate exceeds the minimum death rate, the population size maintains itself at a constant steady level and the disease is extinct. For the third case, possible only when a certain threshold value is exceeded, disease can persist and regulate the population size at a finite level. Exactly one of these equilibria is locally stable to small perturbations; any others that exist are locally unstable. Simulation suggests that these local stability results are in fact global stability results. For certain parameter values a further possibility is that the population size may increase without limit. The SIR model described above is a simplified model for real diseases. Diseases such as measles and rubella usually have an incubation period, a time immediately after an individual catches a disease during which he will not spread it. Usually this modification is easy to include and does not change the qualitative behaviour of the model, although it may change the value of some of the critical parameters such as the threshold value. Hoppensteadt (1975) outlines equilibrium and global stability results for the SIR model with a constant death rate and Rinaldi (1990) proves similar results for the same model with an exposed or incubating class added. Greenhalgh (1987) outlines equilibrium and local stability results for an age-structured SIR model and then modifies these to include an incubation period. In a later paper (Greenhalgh, 1992a) he looks at similar results for an SIS model with a density-dependent death rate and then modifies these to include an incubation period. Both sets of results have a similar quantitative form whether or not an incubation period is included. In this paper we look at the SIR model with density dependence in the death rate. Thus the model is similar to the one studied by Rinaldi except that the death rate depends on the population density. We modify this model by the inclusion of an incubation period. We find that although the equilibrium results have the same qualitative form the local stability results are different from those for the SIR model described by Greenhalgh (1990a) and also different from the results obtained by Rinaldi. More specifically we shall show that it is possible that the equilibrium with disease present can exist and be locally unstable, so a situation can arise where all three equilibria are locally unstable. This raises the question of behaviour such as
SEIR EPIDEMIC MODEL WITH DENSITY-DEPENDENT DEATH RATE
69
limit cycles which need to be examined. It is surprising that the introduction of an incubation period produces a qualitative change in the behaviour of the system such as this. The analytical results are confirmed and examined further by numerical studies and simulation. The paper is organized as follows. In the next section we outline the basic model under consideration where the death rate is constant. Then we present the results of an equilibrium analysis for this model. Next we examine the local stability of these solutions and give a biological interpretation of these results. Then we give a summary of how these results are modified if the death rate is an increasing continuous function of the population density and illustrate this with the case of the logistic death rate. Next we study which parameter values of the model should be expected to produce stable and unstable cyclic behaviour. Then numerical simulations are presented which confirm our analytical results. Finally, we briefly summarize the results of the paper. 2. Basic model
We modify the model with a density-dependent death rate discussed by Greenhalgh (1990a, 1992b) to take account of (i) vaccination of susceptible individuals and (ii) the introduction of a class of individuals who are incubating the disease. In the model, r denotes the birth rate per head of the population, a the additional death rate suffered by infected individuals, a'1 the average duration of the incubation period, and y""1 the average infectious period in the absence of a death rate. We assume that individuals transfer from the incubating to the infectious class at constant rate a and that individuals transfer from the infectious to the immune class at constant rate y. The quantities X(t), H{i), Y{i), and Z{t) are respectively the numbers of susceptible, incubating, infected, and immune individuals, and N(t) is the total number of individuals, at time t. We suppose that the transmission coefficient for the disease is a constant p. We use the term 'transmission coefficient' in the sense used by Anderson & May (1983) and Berger (1976). This means that new cases of the disease occur at rate fIXY. This implies that the number of contacts of a single individual per unit time is /W, proportional to the number of individuals in the population. An alternative assumption, particularly for sexually transmitted diseases, is that the number of contacts of a single individual per unit time is a constant, /?. This corresponds to the new cases of disease occurring at rate f}X Y/N. We assume that susceptible individuals are vaccinated at a per capita rate p, so that in a small time interval [t,t + At] the number of susceptible individuals who are vaccinated is pX At + o(At). We suppose that the death rate is f(N) which is a continuous strictly monotone increasing function of N. This form for the death rate is discussed by Greenhalgh (1990a) and is suitable for the situation where there is competition amongst individuals for scarce resources. Such an assumption is commonly made, for example, in the logistic model for population growth (Verhulst, 1838) and in models for predator-prey systems (Nisbet & Gurney, 1982). Some examples of such death rates would be: (a) /(iV) = KN, logistic death rate; (b) f(N) = /i + KN, combination of constant and logistic death rate;
70
DAVID GREENHALGH
(c) f(N) = Ky/N, intermediate between a constant death rate and a logistic death rate. The differential equations which describe the spread of the disease become dX -— at
f(N)]X,
at dY at
(2.1)
dZ — = yY + dt dt
PX-f(N)Z,
^ = [r dt with suitable initial conditions. In the next section we shall look at equilibrium solutions of these differential equations. 3. Equilibrium analysis Setting the time derivatives to zero in equations (2.1), we deduce that the following equilibrium solutions are possible. The first step is to examine the possible equilibrium solutions to these equations. First of all, we shall suppose that /(oo) = lim^^, f(N) > r, so that if the population size is large enough the death rate exceeds the birth rate. 3.1 Let X, H, Y, and Z denote respectively the equilibrium numbers of susceptible, incubating, infected, and immune individuals, and let N denote the total equilibrium number of individuals. (a) There is always an equilibrium where the population is extinct: THEOREM
X =H = Y=Z = N = 0. (b) Provided that r > /(0), there is an additional unique equilibrium where the population is maintained at a steady level but the disease is extinct: Z = (c) Provided that P ,-1, a
acr
there is an additional unique equilibrium with disease present and regulating the population size.
71
SEIR EPIDEMIC MODEL WITH DENSITY-DEPENDENT DEATH RATE
The equilibrium numbers of susceptible, incubating, infected, and immune individuals, and the total equilibrium number of individuals, are given by
+7+
X=• H=
[a + y + /(JV)][r a
(3-1)
/(JV)][a + y + /(JV)] aar - [
a
Proo/ This theorem is proved along similar lines to the corresponding results for related models in Greenhalgh (1990a, 1992a,b). Setting the time derivatives to zero in equations (2.1)2j3, we deduce that PXY = [f{N) +
= {f(N)/[f(N)
Z =
= Y = 0.
This is an equilibrium solution for any value of N.
(b)X = {U(N) + olUifi) + y + «]}//»* From (2.1)!, rfi - (f(N) + p)X
+P
arN
U(N) +
+ y + a]
From (2.1)5,
Equating these values for Y gives an equation for N which we can solve to give Pti
=
CP + /(JV)][ff + /(/V)][a + y + /(JV)]
=
a a(7r - [a + /(N)][a + y + /(iV)][r - / ( N ) ] ' It is then straightforward to show that [a + y + /(N)][r - /(N)] . • JV and Z = N -X -H-Y. /f = OUT
72
DAVID GREENHALGH
Thus the equilibrium values X, H, Y, Z, and N must satisfy the values given in (a), (b), or (c) of Theorem 3.1. The first equilibrium (a) is always well defined. The second equilibrium (b) is well defined if and only if /(0) < r < /(oo). The third equilibrium (c) exists if and only if r-1( , > (P + r)(ff + r)(g + y + r) Par when it is unique and well defined using Lemma 3.1. LEMMA
•
3.1 The equation PN a
aar
[p + /(JV)][> + /(#)][> + y + _ [CT + /(JV)][a + y + /(N)][r - /(AT)]
has a unique positive root for N if and only if /(oo) ^ fc, where b is the unique positive root of Q{£,) = 0. Here (ff + $)(« + y + f)(r - OThis value of N satisfies r > /(JV), ensuring Y is positive if and only if f- i(r\ > (P + Ofr + r)(« + 7 + r) par Proof. The proof is given in the Appendix. Hence we deduce that the equilibrium results for the SEIR model with a density-dependent death rate are similar to the equilibrium results for the SIR model with a density-dependent death rate (Greenhalgh, 1990a). There are three possible equilibrium values: one where the population is regulated at a steady level, and one where disease is present. Arguing in a similar manner to the proof of Theorem 3.1, we deduce the following result for the situation where the death rate f(N) = n is a constant independent of population density. 3.2 Let X, H, Y, and Z denote respectively the equilibrium numbers of susceptible, incubating, infected, and immune individuals, and let N denote the total equilibrium number of individuals. (a) If r < n, then there is just one equilibrium where the population is extinct: THEOREM
(b) If r = n, then any solution where no disease is present X = \jt/(n + PW,
Z = lp/Ui + pftN,
H= Y= 0
is a possible equilibrium solution. (c) If r > ft, then there are two possible equilibrium solutions. One is where the population is extinct,
SEIR EPIDEMIC MODEL WITH DENSITY-DEPENDENT DEATH RATE
73
which is always possible, and one with disease present where the population size is regulated by the disease. The equilibrium numbers of susceptible, incubating, infected, and immune individuals, and the total equilibrium number of individuals, are given by X = g
(a
(a + y + ji){r (3.2)
Z = N-X-H-Y, pN
(p + n){a + n)(
a
This second equilibrium is possible if and only if (tar > (
(3.3)
when it is unique. Discussion. Equation (3.3) provides a limit on r, the intrinsic growth rate of the population: + /i)(a + y + n)l[(p + p)(a + y + n) - acr] > r.
(3.4)
If r exceeds this value, then from equations (3.1) we conjecture that the population size grows without limit and that the limiting number of susceptibles and the respective limiting fractions of incubating, infected, and immune individuals tend to the following values: Nit) -> oo, Xit)
(ff + /^)(a + y + n)
P*
Hit) Nit)
(« + y + n)ir - y)
Yit) Nit)
r — /i
Zit) Nit)
(3.5)
eta
a
a
\
a
)
It is straightforward to show that if r > n and (3.4) holds then the limiting expressions in (3.5)3_5 lie between zero and one. These conjectures are borne out by the results
74
DAVID GREENHALGH
of our simulations. In the next section we shall look at the local stability properties of these equilibrium values subject to small perturbations. 4. Stability analysis
For simplicity of presentation we first consider the case where the death rate f(N) is a constant /z independent of the population size. THEOREM 4.1
(a) If r < fi, then the equilibrium where the population is extinct, is locally stable to small perturbations. (b) If r = /z, consider the equilibrium where disease is extinct H=Y=0. p +n p +n The linearized system is locally stable but not asymptotically stable to small perturbations if ff
)(a + 7 + A*)
otherwise both the linear and nonlinear systems are locally unstable to small perturbations, (c) If r > n, the equilibrium where the population is extinct, X = H = Y=Z = N = 0, is locally unstable to small perturbations. For the unique equilibrium with disease present, suppose that the equilibrium number of susceptibles, incubating individuals, infecteds, and immunes are respectively X, H, Y, and Z. Then this equilibrium is locally stable to small perturbations if and only if S i ^ i > £?*i +
(4-1)
where rii=(a + y + o + 2fi)(n + $Y) - (r - n)(a + y + a + 3/i + $Y) ^ 0, 0! = cp2XY-
(r - /£)(« + y + a + 2fi)(n + fiY) > 0,
4ix = {a + n)(a + y + n){r - n)p. > 0. Proof. The proof is lengthy and therefore given in the Appendix. 4.1 Condition (4.1) is not vacuous. There are parameters for the model where the equilibrium with disease present exists and is locally unstable to small perturbations. In this situation all three equilibria are locally unstable to small perturbations, unlike the model with no incubation period. COROLLARY
Proof. The proof is also given in the Appendix.
SETR EPIDEMIC MODEL WITH DENSITY-DEPENDENT DEATH RATE
75
5. Model with a density-dependent death rate
In this section we discuss how these results can be modified if the death rate depends on the number of individuals in the population. The next theorem discusses the stability of these equilibrium values to small perturbations. THEOREM 5.1
(a) Suppose that r s% /(0), so that the birth rate is always less than the death rate. Then the only possible equilibrium is an equilibrium where the population is extinct that is locally stable to small perturbations. (b) Suppose that /(oo) > r > /(0) and ,-,
(p + r)(a + r)(oi + y + r) Penso that there are two possible equilibria. The first where the population is extinct is locally unstable to small perturbations. The second where the disease is extinct and the population size is JV = f~l(r) is locally stable to small perturbations. (c) Suppose that /(oo) > r > /(0) and n <
,-iM
(p + r)(g + r)(g + y + r) Penso that there are three possible equilibria. The equilibrium where the population is extinct and the equilibrium where the disease is extinct and the population is steady at level f~l(r) are both locally stable to small perturbations. The unique equilibrium where disease is possible is locally stable to small perturbations if and only if « i + *Wfoi + xniMi + *
2) > (i + *i)2 + tfi + *£2)20Ai + x*2). (5.1) This is implied by £ i f i 0 i > * i + £fyi, (5-2) where Z1=a ni
+y+
tr
+ PY+ 4/(JV) +
= [a + y + a + 2f(NmpY
p-r,
+ 2f(N) + p - r] - \_pY + f(N) + p][r -
f(N)l,
4>! = PYLo + /(#)][« + y - [a + y + a + 2/(JV)][/jf + 2/(JV) + p - r][r ^i = [ff + /(N)][« + V + /(iV)][r - /(N)][p + /(JV)], x = /'(N) Froo/ The proof of this theorem is straightforward but lengthy and therefore given in the Appendix. 5.1 Condition (5.1) is not vacuous. There are parameters for the model where the equilibrium with disease present exists and is locally unstable to small perturbations. COROLLARY
Proof. See Appendix.
76
DAVID GREENHALGH
The case r > /(oo) The above analysis is valid provided that /(oo) > r, so that, at least at large values of N, the birth rate exceeds the death rate. We now present a mixture of results and conjectures for the situation where r ^ /(oo) so that the birth rate always exceeds the background death rate. The rationale behind these results and conjectures is similar to the rationale behind the corresponding results and conjectures for the SIR model given in Greenhalgh (1990a). The heuristic nature of the argument means that the conjectures must be treated with caution. Recall that b is the unique positive root of the equation Q(l) = 0 (Lemma 3.1). 5.2 For the situation where r ^ /(oo) there are two possibilities. (a) /(oo) > b. In this case there are two possible equilibria. The first is where the population is extinct. This is now locally unstable to small perturbations. The second is one where the population is regulated at a finite level N given by the unique positive root of equation (5.3). This is locally stable to small perturbations. (b) /(oo) ^ b. Here there is only one possible equilibrium where the population is extinct and this is locally unstable to small perturbations. THEOREM
We also make the following conjectures for this situation. CONJECTURE 5.1
We conjecture that provided there is at least one individual then the population size will increase without limit. The limiting behaviour of the numbers of susceptibles, incubating individuals, infecteds, and immunes, and the total number of individuals, depends on their respective initial values Xo, Ho, Yo, ZQ, and No as follows: (i) x0 = Ho = Yo = Zo = No = 0 implies X(t) = H(t) = Y(t) = Z(t) = 0 for all t; (ii)
Ho = Yo = 0 and No > 0 implies N(t)
X(t) oo,
r p +r
Z(t) N(t)
p p+ r
(iii) No > 0 and either Ho > 0 or Yo > 0 implies N(t) -* oo X(t)
[a + /(oo)][a + y + /(oo)] pa
Hit) N(t)
[a + y + /(oo)][r - /(oo)]
Y(t) N(t)
r - /(oo)
Z(t) N(t)
j _ [r - /(co)] / a \
(5.3)
+
a + y + /(oo)\ a )'
Similarly to the discussion of the model with a constant death rate it is straightforward to show that the proposed limiting fractions of incubating, infected, and immune individuals always lie between zero and one.
SEIR EPIDEMIC MODEL WITH DENSITY-DEPENDENT DEATH RATE
77
6. Biological interpretation
Consider the threshold value (p + r)(o + r)(« + y + r) The disease will take off if Ro exceeds one and will die out if Ro is less than one. Consider the expected number of secondary cases produced by a single individual who has just caught the disease entering a completely susceptible population at equilibrium. When no disease is present, the equilibrium population size is f~l(r), so the background death rate suffered by a single individual is r. During the incubating phase the individual leaves the incubating class at rate a and suffers a death rate r. Hence the probability that he or she survives to enter the incubating class is o/(<7 + r). In the infectious class he or she becomes immune at rate y and suffers a death rate a + r, hence his or her expected time in the incubating class is T0 = l/(a + y + r). The expected number of susceptibles at equilibrium is r i r f~ ( )/(P + r)> s o the expected number of secondary cases produced by a single individual who has just caught the disease is 1 o Rrf-\r) P—7 7-— 7-' p + r a. + y + ra + r which is the same as the threshold value Ro. A similar result was proved for the SIR model (Greenhalgh, 1990a). From equations (3.2) it is straightforward to show that, for the model where the death rate is constant, vaccination increases the equilibrium population size and increases the equilibrium number of susceptibles, incubating, infected, and immune individuals in the same proportion. The situation with the density-dependent death rate is more complex. From equations (3.1) it is clear that vaccination increases the total equilibrium number of individuals and also increases the equilibrium number of susceptible individuals. It is unclear how vaccination affects the equilibrium number of incubating, infected, and immune individuals. The major difference between these models and the earlier models considered by Greenhalgh (1990a, 1992a,b) is that the introduction of an incubation period into the SIR model allows the equilibrium with disease present to exist and be locally unstable. This is not true for the introduction of an incubation period into the corresponding SIS model (Greenhalgh, 1992a). The present model allows for three equilibria to exist each being locally unstable to small perturbations. 7. Special cases
We shall next discuss how the results of this section apply to some specific models with density dependence in the death rate. First of all, we discuss the logistic model where the per capita death rate is f(N) = kN. This is commonly used in modelling biological populations. The threshold value is P
78
DAVID GREENHALGH
If this value is less than one, then there is just one equilibrium possible where the disease is extinct and the population is maintained at a steady level. If Ro exceeds one, then there is an additional equilibrium possible where disease persists and regulates the population size. The equilibrium population size is N = £//c, where £, is the unique positive root of the equation
ft ak
(P
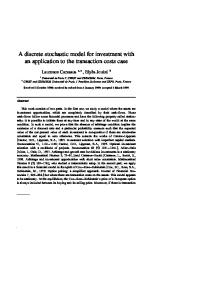
which when multiplied up gives a quartic. Second, suppose that the per capita death rate is f(N) = \i + kN. The threshold value is k(p + r){a + r)(a + y + r) If r < /i, then there is just one equilibrium where the population is extinct. If r > \i but Ro < 1, then in addition there is an equilibrium where the disease is extinct but the population maintains itself at a constant steady level. If r > /z and Ro > 1, then there is an additional equilibrium where disease persists with N again given as the unique positive root of a quartic equation. 8. Numerical results For the model with a constant death rate the condition for local stability of the equilibrium with disease present is inequality (4.1). In this section we look at numerical evaluation of this inequality for different ranges of the parameters, and in the following section we shall look at numerical solution of these equations for different parameter values. We used the computer algebra package MATHEMATICA to produce these graphs. We were interested in what ranges of parameter values produced local instability and in particular whether this could happen for realistic parameter values. To make the graphs easier to interpret, we have used a log10 scale for the intrinsic population growth rate r in the absence of a death rate. The results are shown in Fig. 1. The graphs show plots of r = ft, F = 0 where F
=
£ l f 101 — 'sl'/'l — 4*1'
(8-1)
and r = A where A = /X(CT + n)(a + y + n)l[_{p + /i)(a + V + AO — <*o~\- Recall that if r < n then we expect the population to die out (region II), whereas if r ^ A we expect the population to increase without limit (region I). The condition F ^ 0 is a necessary and sufficient condition for local stability of the equilibrium where disease is present. In region HI (F < 0) there is an equilibrium where disease is present which is locally unstable, whereas in region IV (F > 0) this equilibrium exists and is locally stable. The situation shown in Fig. l(a) illustrates the counterexample used in Corollary 4.1. This situation has a = 0.1, a = 0.001, \i = 1 x 10~7, and fi = 1 x 10"". Both y and /i are very small. This counterexample shows that the equilibrium with disease present can be locally unstable, but the parameter values are not very realistic. Figure l(b) shows that this instability can still occur for more realistic parameter
SESR EPIDEMIC MODEL WITH DENSITY-DEPENDENT DEATH RATE
79
values. This situation has a = 0.1, a = 0.1, and P = 1 x 10" 11 . The background death rate fi is 0.00004/day which corresponds to an average lifetime of 68 years. This is in a realistic range for some human populations. The incubation period is 10 days, which is also reasonable. On the other hand the range of values of y, at which instability occurs are in the range of 200 days, which is rather long compared with the infectious periods of most diseases. (However, there are some diseases for which the period of infectiousness is at least this long, for example hepatitis B and AIDS.) It should be emphasized that these two counterexamples are atypical and for most parameter values the equilibrium with disease present is locally stable when it exists. Figures l(c, d) show graphs of log! 0 r against a and log10 r against a which are rather more typical in that no such instability occurs: Fig. l(c) has parameter values a = 0.1, 8 y = 0.1, n = 0.00004, and /? = 1 x 10~ ; Fig. l(d) has a = 0.004, y = 0.2, \i = 0.00004, 8 and 0 = 1 x 10~ . We performed a similar analysis for the model with a density-dependent death rate but the accuracy of the results obtained was less reliable, so they are not presented here. In the next section we shall further illustrate this phenomenon by looking at numerical solutions to the differential equations which we have studied. 9. Simulations We now discuss the results of some numerical simulations which support these analytical results. The differential equations were integrated using the NAG routine D02BBF. This routine uses a Runge-Kutta method to integrate the equations. The program was written in FORTRAN and the results were comprehensively verified using output from a number of runs. We first discuss the results for the model with a constant death rate. 9.1 Results for model with a constant death rate All of the simulations discussed in this section relate to the parameter values applying to Fig. l(b). We shall illustrate all the possible types of behaviour starting off with a situation where the equilibrium with disease present is locally unstable. Here, a = 0.1, a = 0.1, ix = 0.00004, 0 = 1 x 10"8, y = 0.0025, and r = 0.0001. This point lies within region HI of Fig. l(b), so we expect the equilibrium with disease present to be locally unstable. As discussed previously, the values of a and n are realistic for diseases in human populations and the value of y? is in the same range as transmission coefficients used for measles in England and Wales (Greenhalgh, 1990b). The equilibrium values predicted for this model are X = 1.02581 x 10⁷, H = 6565.37, Y = 6402.72, Z = 400172, and N = 1.06712 x 10⁷. To start off the simulation, this equilibrium is subject to a small perturbation X = l.OlJ^ and Z = 0.95Z. Figures 2(a-e) show the numbers of individuals susceptible, incubating, infected, and immune, and the total number of individuals, against time for the first 120 years. Close examination of these figures reveals that X, H, Y, Z, and N show regular oscillations of gradually increasing amplitude about the equilibrium values. The number of people immune, Z, starts further off from its equilibrium value and has to climb to reach it. However, once there, it again shows regular oscillations of gradually increasing
80
DAVID GREENHALGH
(a) -3-
-6-
-9J
0
1
2
3
4
3
4
y O-i
5 x10" 6
(b)
-1
-2
-5-
-6J 1
2 y
5 x10
FIG. 1. Local stability of the equilibrium where disease is present for different parameter values.
SEIR EPIDEMIC MODEL WITH DENSITY-DEPENDENT DEATH RATE
(c)
-A.2-
IV
-4.4-
0
2
4
6
8
-4.38 -,
10 v-1 (\~^
(X
(d)
-4.39-
IV
-4.40J 0
2
4
6 a
FIG. 1. {Continued).
8
10
81
82
DAVID GREENHALGH x10 3
x1Cf 106
(b)
6-
100
40
80
120
C)
40
Time (yrs)
80
120
80
120
Time (yrs)
xiO 3
x10 4 (C)
45 n (d)
6-
40-
35
40
80
120
40 Time (yrs)
Time (yrs) x10 6 45 n
C)
N 6-
40-
35
40
80 Time (yrs)
120
160
320
480
Time (yrs)
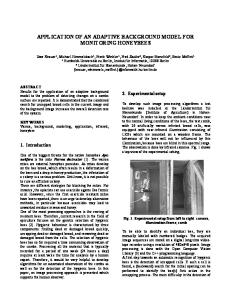
FIG. 2. Numbers susceptible, incubating, infected, and immune, and total number, against time and phase plots.
amplitude about these values. Figure 2(f) shows the number of immune individuals plotted over 480 years. Figures 2(g, h) give the phase plots of N vs. Y and Y vs. X. Both show spirals outward from the equilibrium point. These simulations confirm that in this case the equilibrium with disease present is an unstable spiral point. The second simulation lies on the boundary between regions III and IV in Fig. l(b), so we expect that the equilibrium is locally neutrally stable. We take the same values of a, a, /?, and (i as previously, with r = 1 x 10~4 and y = 0.0071.
83
SEIR EPIDEMIC MODEL WITH DENSITY-DEPENDENT DEATH RATE
iO8.o n
(g)
N
106.5-
105.0 10 *10
3
104.0 x10
5
FIG. 2. (Continued).
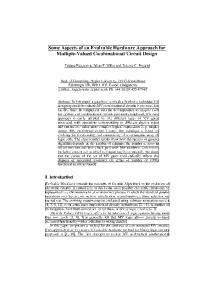
The equilibrium values predicted for these parameters are X = 1.07183 x 10⁷, H = 7722.15, Y = 7207.53, Z = 1.27934 x 10⁶, and JV = 1.20126 x 10⁷. The equilibrium was subjected to the same perturbation as previously. Figures 3(a-e) show the numbers of individuals susceptible, incubating, infected, and immune, and the total number of individuals, for the first 480 years with initial perturbation X = 1.01* and Z = 0.95Z. In all cases, the steady-state solutions show regular oscillations about the equilibrium levels except that the number of immune individuals and the total number of individuals start some way off their equilibrium values and exhibit initial transient behaviour before settling down to their steady-state values. We also examined the effects of different-size starting perturbations. Figures 3(f-k) show the number of infected individuals against time and the total number of individuals against time for initial perturbations (i) X = 1.02* and Z = 0.9Z, (ii) X = 1.01* and Z = O.95Z, and (hi) X = 1.001* and Z = 0.995Z. These sets of graphs for different starting perturbations show similar behaviour except that the amplitude of the final oscillations is different for different initial perturbations. Thus the long-term limiting behaviour of this equilibrium appears more like a centre or neutrally stable equilibrium than limit cycles or chaotic behaviour. This is confirmed by Figs. 3Q-q), which show the phase plots of Y vs. X and N vs. Y for different-size initial perturbations. Note that the size of the final phase plane trajectory depends on the size of the initial perturbation. The third situation has parameter values a = 0.1, a = 0.1, /z = 0.00004, /? = 1 x 10"8, r = 1 x 10"*, and y = 0.03. This point lies in region IV of Fig. l(b), so we expect the equilibrium with disease present to be stable. The equilibrium values are X = 1.30092 x 10⁷, H = 18501.5, Y = 14227.6, Z = 1.06707 x 10⁷, and N = 2.37126 x 10⁷. Again we start off the simulation with a small perturbation X = 1.01* and Z = 0.95Z. Figures 4(a-e) show graphs of X, H, Y, Z, and N against time for the first 120 years. Figures 4(f,g) show the graphs of Z and N against time for the first 480 years. These simulations show the behaviour of a locally stable spiral with the solutions tending to the equilibrium values in a manner which appears oscillatory (ignoring transient effects). This impression is confirmed by the phase plots of N vs. X, N vs. Y, and Y vs. X (Figs. 4Ch-j)), all of which show trajectories approaching the equilibrium point.
84
DAVID GREENHALGH
x10 J
110.0
12-,
(b)
107 5
105.0 160
320
160
Time (yrs)
480
320
480
320
480
x1O 3
x10° 12-, (c.
13-.
160 320 Time (yrs)
(d)
160 Time (yrs) x10 J
x1O 13-,
320 Time (yrs)
(e)
11 160 Time i\/rc.\
FIG. 3. Numbers susceptible, incubating, infected, and immune, and total number, against time and phase plots for different initial perturbations.
as
SEIR EPIDEMIC MODEL WITH DENSITY-DEPENDENT DEATH RATE
x10J 12 -i (g)
x10 J 12-,
(h)
6-
160
320
480
0
160
Time (yrs)
320
480
320
480
Time (yrs)
x10
x10° (j)
N 12-
160
320
480
110
160 Time (yrs)
Time (yrs) x10
X10" 13-,
14.0-,
(k)
(I)
8.5-
12-
3.0-
160
320
480
105.0
Time (yrs) FIG. 3. (Continued)
107.5 X
110.0 x10 5
86
DAVID GREENHALGH
xiO 3
X10 3
14.0-1 (m)
14.0 -,
8.5
8.5-
3.0
3.0 105.0
107.5 X
x10
110.0 x10⁵
b
105.0 x10
(o)
8.5
, 14.0
Y
x10 3
x10 5
o
117. 3.0
8.5 Y
x10 123-, (q)
N 120-
117 3.0
110.0
(p)
120-
117
107.5 X
5
123
120
3.0
(n)
8.5 Y FK3. 3. (Continued).
14.0 xiO 3
14.0 x10 3
87
SEIR EPIDEMIC MODEL WITH DENSITY-DEPENDENT DEATH RATE 04
x1
(b)
1-
125 40
80
120
40
Time(yra) x10a 105.0-,
x10
2-,
(C)
120
80
120
320
•480
(d)
102.5
1-
0
80 Time (yrs)
40
80
—, 120
100.0 40
0
Time (yrs)
Time (yrs) x105
x106
(f)
24 T (e)
N 23-
105-
22
100 40
80 Time (yrs)
120
160 Time (yrs)
Fro. 4. Numbers susceptible, incubating infected, and immune, and total number, against time and phase plots.
The fourth simulation which we shall discuss has a - 0.1, a = 0.1, n - 0.00004, fi = 1 x 10" 8 , r = 1 x 10~3, and y = 0.01. This point lies in region II of Fig. l(b), so we expect the population to increase without limit, and the limiting number of suscepfibles and the limiting fractions ofinfected, incubating, and immune individuals tend to constant limits given by equations (3.5) whatever the starting values. Figures 5(a-e) confirm that this is indeed the case. We chose to start the simulation at the same starting values as in the second set of simulations described in Figs. 3(a-e) with initial perturbation X - 1.01X and Z = 0.95Z.
DAVID GREENHALGH
24 -, (g)
x10 238!
23-
234-
N
22
160 320 Time (yrs) x10
, 480
b
238-,
230. 128
130 X
132 x10 5
x10 J (i)
(j)
N
234-
14
230
11
14 Y
17 x10
11 128
3
130
132 x10 5
Fici. 4. (Continued)
The final situation which we shall consider in this section has parameter values a = 0.1, a = 0.1, fi = 0.00004, P = 1 x 10~8, r = 2 x 10"5, and y = 0.01. Here, we have r < n and the parameters lie in region I in Fig. l(b), so we expect the population size to tend to zero. This is confirmed by simulation as shown in Fig. 6. Thus, for the model where the death rate has a constant value, the global stability behaviour of the equilibrium with disease present appears rather like its local stability behaviour. Our simulations suggest the following global stability results. If r < n, the disease will die out. If (3.3) is not satisfied, then the population size will increase without limit and the total number of susceptibles and the fraction of the population respectively incubating, infected, and immune will tend to the values given in equations (3.5). If r > n, (3.3) holds and there are initially some individuals but no infected individuals, then the population size will increase without limit. If r > /i, (3.3) holds and there are initially infected people, then there is global behaviour corresponding to a multidimensional exponential spiral away from the equilibrium point, a spiral around the equilibrium point, or a multidimensional spiral towards the equilibrium point according as to whether the quantity F defined by equation (8.1) is negative, zero, or positive.
SEIR EPIDEMIC MODEL WITH DENSITY-DEPENDENT DEATH RATE
89
0.00 80
160
240
40
0
80
120
80
120
Time (yrs) 5.0 n
5.0-|
(c)
HIN
(d)
YIN
2.5-
2.5-
0.0
0.0 0
40
80
120
0
40
Time (yrs)
10-,
Time (yrs)
(e)
TIN
40
80
120
Time (yrs)
FIG. 5. Total number, number susceptible, and fractions incubating, infected, and immune against time.
9.2 Results for model with a density-dependent death rate Similar types of behaviour were observed when we performed similar simulations for a model with a density-dependent death rate. We chose to work with a linear death rate f(N) = 0.00004 + 0.0000000000IN and other parameter values a = 0.1, a = 0.1, and P = 1 x 10"8. We obtained a rough sketch of the areas where one, two, and three equilibria were possible and of the stability properties as in Fig. 1, and we used this to help to choose the parameter values for simulation. The first situation which we chose to simulate had parameter values y = 0.001 and r = 0.001. This has equilibrium values X = 1.01191 x 10⁷, H = 94024, Y= 93056.4,
90
DAVID GREENHALGH
2.50-,
N 1.25-
0.00 160
320 Time (yrs)
480
FIG. 6. Total number against time.
Z = 622863, and N = 1.09401 x 10⁷. For this situation, r > /(0) and Ro = 9.32 > 1, so an equilibrium with disease present is possible. We chose a small starting perturbation X = \.0iX and Z = 0.95Z. This produced results qualitatively similar to those described for the first simulation in Section 9.1. The values of X, H, Y, Z, and N show regular oscillations of increasing amplitude about the equilibrium values after transient effects have been ignored. This behaviour corresponds to an unstable spiral away from the equilibrium point. The second situation which we chose to simulate had parameter values y = 0.00169 and r = 0.001. This has equilibrium values X = 1.01887 x 10⁷, H = 98519.3, Y = 96843.9. Z = 1.05901 x 10⁶, and N = 1.14547 x 10⁷. For this situation, r > /(0) and Ro = 9.26 > 1, so we expect an equilibrium with disease present. This produced results qualitatively similar to those described for the second simulation in Section 9.1. The values of X, H, Y, Z, and N show periodic oscillations about their equilibrium values after transient effects have been ignored. We again considered three starting situations: the first with X = 1.02X and Z = 0.9Z, the second with X = 1.01 X and Z = O.95Z, and the third with X = 1.00IX and Z = 0.995Z. The only difference between these results and the corresponding results in Section 9.1 (Fig. 3) was that there was a greater difference in the amplitudes of the resulting oscillations. Figure 7 shows the behaviour of the number of infected individuals for different starting values. The third situation has parameter values y = 0.005 and r = 0.001. This implies equilibrium values X = 1.05229 x 10⁷,tf = 120302, Y = 114530, Z = 3.18842 x 10⁶, and N = 1.39603 x 10⁷. Again r > /(0) and Ro = 8.97 > 1, so there is an equilibrium with disease present. We chose to start the simulation with a small perturbation X = 1.0 IX and Z = 0.95Z. The results show the same type of behaviour as in the third type of simulation described in Section 9.1 and X, H, Y, Z, and N all tend to their equilibrium values. The graphs of the number of susceptible, incubating, and infected individuals against time show damped oscillatory behaviour. The graphs of the number of immunes and of the total number of individuals start some way off their equilibrium values, so there is an underlying rise to the equilibrium value with an oscillatory trend superimposed on top of this. The phase plots confirm this
91
SEIR EPIDEMIC MODEL WITH DENSITY-DEPENDENT DEATH RATE
0
40
80
120
0
Time (yrs)
x10* 12 n
40
80
120
Time (yrs)
(c)
10-
40
80
120
Time (yrs)
FIG. 7. Number infected against time for different initial perturbations.
behaviour similar to a stable multidimensional spiral towards the equilibrium values. Recall that the first simulations discussed in Section 9.2 had parameter values y = 0.001 and r = 0.001 and showed instability. Our rough calculations suggest that the region of instability is bounded and occurs for both y and r relatively small. To check this, we performed another set of simulations with the same value of y and r = 0.01. Here, r > /(0) and Ro = 81.57. The equilibrium values of X, H, Y, Z, and N are X = 1.01312 x 10⁷, H = 2.2545 x 10⁶, Y= 2.2313 x 10⁶, Z = 8.28539 x 10⁶, and N = 2.29305 x 10⁷. We started off the simulation with a small perturbation X = 1.01.Y and Z = 0.95Z. This situation produced similar results to the simulations described in the immediately preceding paragraph showing a stable multidimensional spiral towards the equilibrium values. The next situation took r = 0.0002 and y = 0.1. This implies that r > /(0) but Ro = 0.798 < 1. Hence we expect that there should be two equilibria: one where the population has died out and one where the population remains at a steady level but the disease has died out. Provided that there are initially some people present, then the number of susceptible and the total number of individuals should tend to the unique equilibrium value which is the solution to the equation r = f(N). This was verified by the simulations. We took the starting point to be the same as the
92
DAVID GREENHALGH x10 2.50,
x10' 2-, (a)
(b)
1.25-
1-
40
—, 120
80
0.00 0
40
Tlme(yrs)
80
120
Time (yrs)
x10 7 2.50 -, (c)
N 1.25-
0.00 40
80
120
Time (yrs) FIG. 8. Numbers susceptible and infected, and total number, against time.
simulations discussed immediately above and the expected behaviour was observed This is illustrated in Fig. 8 which shows the numbers of susceptibles and infecteds and the total number of individuals against time for the first 120 years. The final situation took r = 0.00002 and y = 0.1. Since r < /(0), we expect the population to die out. This was confirmed by simulation. We took the same starting values as for the two immediately preceding simulations. Figure 9 shows the numbers of susceptibles and infecteds and the total number of individuals against time for the first 480 years. Thus the results for a model with a linear density-dependent death rate are much as expected, and it again appears possible to predict the global stability behaviour of the system from its local stability behaviour. We shall briefly summarize the apparent implications of the results of our simulations on our conjectures for the global stability of the model with a density-dependent death rate. The simulations suggest that if r < /(0) then the population will die out. If /(oo) > r > /(0) and there are initially some individuals but no infected individuals or Ro ^ 1, then the population tends to its unique equilibrium level with no disease present. If /(oo) > r > /(0) and Ro > 1 and there are initially some infected individuals, then the numbers of susceptible, incubating, infected, and immune individuals, and the total number of individuals, either oscillate in an exponentially increasing manner away from their equilibrium values, display
SEIR EPIDEMIC MODEL WITH DENSITY-DEPENDENT DEATH RATE B
x10' 2.50-, (a)
x10
1.25-
1.25-
0.000
2.50 T
160
320
—, 480
93
(b)
0.00 0
Time (yrs)
160 320 Time (yrs)
480
0.00 160 320 Time (yrs)
480
FIG. 9. Numbers susceptible and infected, and total number, against time.
periodic oscillations of constant amplitude about these equilibrium values, or tend to these values in a damped oscillatory fashion. Which of these types of behaviour occurs depends on inequality (5.1). Our simulations do not cover the case where r > /(oo), but then we conjecture that, provided there are some infected individuals initially, the population increases without limit and the number of susceptibles and the limiting fractions of incubating, infected, and immune individuals tend to constant limits given by equations (5.3). If r > /(oo) and there are some individuals but no infected individuals then the population increases without limit. 10. Summary and conclusions
In this paper we have examined an SEIR model with density dependence in the death rate. We found an interesting and unusual result. There are three possible equilibrium situations. In the first the population is extinct. This is always possible and is locally stable precisely when the birth rate is less than the minimum death rate. The second is where the population size maintains itself at a constant steady level and the disease is extinct. This is possible if /(oo) > r > /(0). This equilibrium is locally stable provided a certain threshold is not exceeded and locally unstable if this threshold is exceeded. The third equilibrium is an equilibrium where disease is possible and
94
DAVID GREENHALGH
regulates the population size. This equilibrium exists if the threshold value is exceeded and may be either locally stable or locally unstable. This is an interesting and unusual result which is different from the results obtained for simpler but similar epidemic models (Greenhalgh 1990a; 1992a, b). It opens the way for the possibility of epidemic cycles for parameter values where the equilibrium is locally unstable. This is confirmed by the results of our numerical simulations for both types of death rate. When the equilibrium with disease present exists, there can be long-term steady-state behaviour about this equilibrium value of oscillations of steadily increasing amplitude, regular, steady oscillations about the equilibrium value, or oscillations about this equilibrium value of steadily exponentially decreasing amplitude tending to the equilibrium value. In the phase plane these trajectories can show an unstable multidimensional spiral away from the equilibrium point, a multidimensional spiral around the equilibrium point, or a stable multidimensional spiral towards this point. These simulations also suggest that the global stability behaviour of the system is similar to its local stability behaviour. Appendix
Proof of Lemma 3.1 Consider the equation PN
[/(N) + p]U(N) + &}[f{N) + a + y]
a
aar - |>
Make the transformation £ = f(N): a
aar - (a + 0(a + y + 0(r - ()
Consider ff)« + a + y) nar —
Here g(£) has roots at £ = — p, -a, and — (a + y). The asymptotes are the roots of = 0, where It is straightforward to show that (?(£) = 0 has three real roots, one less than min{—a, — (a + y)}, one between max{ — a, — (a + y)} and zero, and a unique positive root, b say. The function /"'( b (Lemma A.1). Hence equation (A.I),
-/- 1 (O =
SEIR EPIDEMIC MODEL WITH DENSITY-DEPENDENT DEATH RATE
95
has a unique positive root for £ if and only if /(oo) > b. Otherwise, if /(oo) < b, this equation has no positive roots for £,. If /(oo) > b, denote the unique root for ^ by
-/-'W-aW^o. a It is straightforward to show that this condition is equivalent to
This completes the proof of Lemma 3.1. LEMMA A. 1
Let b denote the unique positive root of (2(0 = zar - (a + £)(a + y + £)
For £ > b, aar - (a + ^)(a + y + £)(r is monotone decreasing in 6. Now,
Therefore we need to show that PQ < PQ' or P'/P < Q'/Q, that is, 1 Z+p
1 Z+ e
1 i +
(£ + g)(£ + « + y) + (^ ~ r)(Z + « + y) + (^ - r)(g + °) aar — (a +
96
DAVID GREENHALGH
As the right-hand side is independent of p and the left-hand side is maximized by choosing p = 0, it is sufficient to prove the result for p = 0. Write S = £, + a and G = i, + a + y. We need to show that SG + £S + £G
SG + {£,- r)G + {£ - r)S
£,SG
SGr
or
(SG + £S + £G)(aar - SGr + £GS) < {SGISG + (f - r)G + (£ - r)S], multiplying up as £ ^ b. Multiplying out and cancelling terms, we find that this inequality reduces to S2G2 > (a + y)a(£G + {S + SG).
(A.2)
Write a = a + y. Inequality (A.2) becomes ({ + 0. Expanding in powers of £,, we obtain Z* + Z3(a + a) + Z\a2 + a2 + aa) > 0, which is clearly true as
dt ~
—i
d>-_ ah - & dt
+
.
+
dz yy — /iz + px, dt~ dn rn - ay - /xn. d£~
SEIR EPIDEMIC MODEL WITH DENSITY-DEPENDENT DEATH RATE
97
Trying x = xew, h = h e0*, y = y e0*, and n = ne™, we deduce that (ox = rn — fix — px, coh = — (CT + n)h, coy = ah - (y + con = rn — ay — fin.
The solutions to these equations are co = — (a + n), —/z, —(p + pi), —(a + y + fi), and r — n. Hence the linearized equilibrium is locally stable to small perturbations if r < fi and locally unstable if r > \L Sanchez (1968) shows that this implies that the nonlinear system is locally stable if r < /x and locally unstable if r > /x. (2) Equilibrium where disease is extinct and population steady This equilibrium is possible if and only if r = /x when the equilibrium values are X = N and H — Y = Z = 0. Try a small perturbation about these equilibrium values X = X + x, H = h, Y= y,Z = z, and N = N + n. Substituting into the differential equations which describe the spread of the disease and working to the first order in small quantities, we get — = nn - pXy - nx, dt dh
n)h,
d7"
dy — = ah - (/x + y + a)y, dt dn — = — ay. dt Write x = (x, h, y, n). These differential equations can be expressed in matrix form as ~ = Ax, dt where the stability matrix A is defined by (n + p)
0
-PN 0
A =
o
a
0
0
—(n + y~^ -a
0 0J
The characteristic equation of A is co\ -^CTN] = 0, P + co)[(cr + u + co)(a + v+ +n u++co)with roots co = 0, co = — (n + p), and the roots of co2 + [a + a + y + 2/z]co + [_(a + n)(a + y + /x) - floN] = 0.
98
DAVID GREENHALGH
This linearized equilibrium is a centre (Sanchez, 1968) and locally stable but not asymptotically stable to small perturbations if 0aN s£ (
H){OL
+ y + n).
In this case, if the equilibrium is perturbed, it will not return to the same position but will settle at another. We cannot deduce anything about the stability of the nonlinear system in this case (Sanchez, 1968). The nonlinear system is locally unstable if {a + n)(tx + y + n). (3) Equilibrium with disease present The equilibrium with disease present is ~ _ (a + /i)(a + y
P (a + y + n){r - n) ~ OUT
(y(r ^ N H\ a
pa
and N is the unique positive root of pN a
(pixar — (a + n){a + y + y){r - fi)
Consider a small perturbation about the equilibrium values: X = X(l + x), H = H(l + h), Y = f(l + y), 2 = 2(1 + z), and N = JV(1 + n). Substituting into the differential equations which describe the progress of the disease and working to the first order in small quantities, we deduce that ^ = nr*(l + n) - pY{\ + x + y) - (p + p)(l + x), at ^ dt
+ x + y) - (a + tf(l + fc), /i
^l = a {\ + h)-{y dt
/
— = yp*(l +y)dt
fi(l + z) + pq*(l + x),
SEIR EPIDEMIC MODEL WITH DENSITY-DEPENDENT DEATH RATE
99
where 7i* = N/X,
p* = Y/Z,
q* =
X/Z.
Subtracting off the equilibrium solutions, after some working we deduce that the stability matrix is
-/?f
0
O 0
0
0
0
-//
0
•AO
0
(<* + y
pq*
0
0
0
yp*
rn* 1
0
r-L
Expanding about the diagonal term —/i, we deduce that the roots of the characteristic equation are a> = — /i and the roots of the quartic equation ct)4 + ^ w 3 + tiico2 + (j)^ + ^ i = 0,
(A.3)
where
p)-(S =
pSGY-(S
+ G)(r - fi) -
p)(r -
ii + p){r - n),
Here, S = a + fi and G = a + y + /i. To prove that the characteristic equation (A.3) has only roots with negative real parts, we need to show that the Routh-Hurwitz conditions are satisfied (Sanchez, 1968): ii>1u4>i, 0
and
(^f/i - i)«/>i > ^"Ai-
(i) To show (?! > 0. Note N Ss X, so (rN/X) ^ r. But {0 fSY + fi + p~^ r, and therefore ^ > 0. (ii) To show t]l > 0. p)-(S
fj, = (S +
+ \i + p ) ^ = rN. Hence
+ G)(r - /x) - (/?? + ji + p)(r - //).
Now, til
+ U + P = -TX- =
X
SG
where 4 = aar — SG(r — /x). Thus, nv
aar (p + n) - (S + G)(r - //). = (S + G + y. - r) —A
We need to prove that (S + G + n-
r)aar(p + n) - (S + G)(r - /i)4 > 0.
100
DAVID GREENHALGH
T h i s is l i n e a r in p. It is sufficient t o p r o v e ( a ) S + G + pi> r a n d (b) (S + G + \i - r)a.orn > (S + G)(r - fi)A. (a) S + G + n-r = ix + y + o+3fi-r. Now A > 0, so aar + SGn > SGr. Hence r < SGfi/(SG — ao). It is sufficient to prove that
5G-a
< a + y + a + 3/i,
which is equivalent to a1 a + cur/ + eta2 + ?>aon < aa(a + y) + a/i(a + y + a) + (jy(ct + y) + y/i(a + y + a) + a2(a + y) + a\i{a + y + a) + 2/i a 2 a + 0(07 + air2 + 3aa^
as required,
(b) We require to prove (S + G)aorn > (r - /i)aor/i + (S + G)A(r - /*), or aor H(S + G)
> aarfi + (S + G)A.
r- n Note A = aar — SG(r — p) > 0, so aar/(r — /i) > SG. It is sufficient to prove fiSG(S + G) > a aor/z + (S + G)a(rr, or (S + G){SG - ao) > But (S + G)(SG - aa) = (S = (a + y + a + 2^)(/i2 + a/i + y// + ay + > atr/i Hence ^ > 0.
as required.
SEIR EPIDEMIC MODEL WITH DENSITY-DEPENDENT DEATH RATE
101
(iii) To show 0.
n + p)(r - n) a
- (S + G)(pY+n + p)(r - p)
SGjft + p)SG
=
(S + GKii + p)a
Hence we need to prove S2G2 — (S + G)aar > 0. Since SGfi/(SG — aa) > r, it is sufficient to prove that S2G2 (S + G)aa SG — aa' which is equivalent to SG(SG — aa) > aan(S + G). Substituting for S and G, we obtain (a + /i)(a + y + n){ay + a\i + a\i + y/x + /i 2 ) > aa/i(a + y + a + 2/i), which on expanding gives ac2cr/i + airyp + ac 2 // + 2aafi2 Hence 4>x > 0. (iv) To show tj/l > 0. Recall that ^ = SG(r - fi)(rn* - pY). rN - PXY=(H + p)X > 0. Hence i/^ > 0.
which is clearly true.
Now rn* - 0
= (rN/X) - i?f.
But
Hence we have shown that £u t\u u and i/^ are positive. The remaining condition for stability is Z^^i > (j>\ + ^lt(/l as stated in Theorem 4.1. Proof of Corollary 4.1 Choose p = 0 and y = 0. This corresponds to a model with no vaccination and a very long infectious period. Suppose that /i is fixed and let r = p + e where e is small. If e is small enough, then e) > (a + /i)(a + /i)e, and an equilibrium with disease present is possible. From equation (3.2)5, (/i + 6) - (a (g + //)(a +
P aan — /x(a + a + /x)e
102
DAVID GREENHALGH
From equation (3.2)4, eN Y = — =
(a + u)(a + u)
EU
P CLOU — vfa + ff +
Working only to the first order in e, we obtain
a + 3, + e({C
+
+
^
* - l ) + 0(8),
y + a + 2^)(/i + f$Y) — (r — /i)(a + y + a (a + n)(o +
= (a + a + 2n)
acr
eta Arguing similarly, we can show that ao Thus we can write <£i = a 0 + a,e + o(e), rjl = b0 + b^e + o(e), <£x = Cje + o(e), and if/1 = dx£ + o(e), where a = a +
« =
(ff + /x)(a +
-1, (A.4)
2,0, a) 2
Ka
+ a + 2 )
\
d
=
(ff +
)(a +
}_
Condition (4.1) for local stability becomes £1>;1^i > Zfyi + l- This reduces to aoboCi£ + o(e) > a^d^s + o{e). So, provided 6 is positive and sufficiently small, Condition (4.1) for local stability reduces to aobocl > a%du or boc^ > aodi as a0 > 0. Substituting the values of a0, b0, au bx, cu and dv back in from equations (A.4) yields
)
/(
V
our The result follows from Lemma 4.1.
(a + a
SEIR EPIDEMIC MODEL WITH DENSITY-DEPENDENT DEATH RATE LEMMA
4.1
103
There exists fi0 > 0 such that if fi e ( 0 , /i 0 ] then
(a + a + 3/z)(a + n)(a + /i) > (a + a + 2 Proo/ Both sides are polynomials in (i and hence if fi is small their behaviour is dominated by the first terms in their expansion in powers of \i. Write
f{n) = (a + a + 3n)(a + /i)(a + /z), = (a + a + 2 / i ) ( ^ ± ^ ^ ± ^ - ^a + a + 2/i)\ = a
where e t = /'(0) - g'(0) > 0- Therefore if y. is sufficiently small /(/i) > g{n). This completes the proof of Lemma 4.1.
Proof of Theorem 5.1 The proof of Theorem 5.1 is very similar, and proved along the lines of the corresponding results in Greenhalgh (1990a, 1992a, b). For the equilibrium with disease present, the characteristic equation is 3 2 co* + axco + a2co + a3co + a4 = 0,
where ax = ^+ f'(NW2. Here,
f'(N)Z2,
^ = fi + f'(N)ri2,
a3 = l + f'(N)4>2,
ij! = (S + G)[/?f + /(JV) + p] - (S + G)[r - /(N)] - lPY+f(N)
and a 4 =
+ p][r
r\2 = N[S + G + /?? + 2/(iV) + p - r], 0X = pSGY - (S + G)[/?y + /(JV) + p][r - /(N)], 2f(N) + p - r] - [r - /(JV)][^f + /(tf) + p]}, - r] - (S + G)[r - /(N)][/?f + /(JV) + p]}.
104
DAVID GREENHALGH
The proofs of the Routh-Hurwitz conditions al > 0, a2 > 0, a3 > 0, and a4 > 0 are similar to those given in the proof of Theorem 4.1. The final Routh-Hurwitz condition ala2a3 > a\ + ala^ is equivalent to + *02) > (0i + *0 2 ) 2 + Ki + x^'OAi + x* 2 ), (A.5) or alternatively
> (4>i + & M + (20:02 + 2 ^ 2 ^ , + It is sufficient but not necessary to prove: (I) (II) (HI) £ 2 f/ 2 0 2 > ^ 1 . We shall show that conditions (II), (III), and (IV) hold if (I) holds, and hence that this set of conditions is equivalent to condition (I). Condition (II): ^ ^ i 0 2 + £i0i>h + ^ ^ i >
2
+ ^2
Since £2 = N, »/2 = M^, and 2 = JV^j, this is equivalent to Clearly N(pt < \\i2, so {?(N0i) > ^i/^, and assuming the result of (I) is true fi0i > {1^1- We deduce that £,j\\ > rj1 ti*l>i- Therefore £,^1 + r]1 2Zli//1, and so Condition (II) follows. Condition (III): ^2tii
or Nrj2 + Wfi0i Note ^ ^ t > (/>! by Condition (I). Now, using the inequality N ip2, we have
> tf£,0, > Moreover N ^ ^ ! = ^[i^ 2 + ^V(r - /)SG], where S = a + f and G = a Since a + f > r and £, > f + p (where / = /(JV)), we deduce that ^ i 0 i > titi + N(r = ^102 + Condition (IN) follows.
-f)(f
SEIR EPIDEMIC MODEL WITH DENSITY-DEPENDENT DEATH RATE
105
Condition (IV): ^2t]2
This condition is equivalent to r\2<$>2 > tp2£2 or N^Nrji > N\J/2. But by Condition (I) and Ntp! = ip2 + A?[r — /(A?)]SG. Hence A / ^ J / J > A/^j > \fi2. Condition (IV) follows. Proof of Corollary 5.1
Consider the counterexample in Corollary 4.1. By Theorem 5.1 a necessary and sufficient condition for the equilibrium with disease present to be locally stable is Condition (5.1). Choose the same parameters for our model and also choose the function / so that f'(N) is small in the neighbourhood of r and the curves Pf~ i(£)/a and ^(0 intersect at £ just less than r, so that r = /(A?) + e where e is small. Then the argument given in Corollary 4.1 shows that the equilibrium with disease present is again locally unstable. Acknowledgement I am grateful to the referees for their comments. REFERENCES ANDERSON, R. M. 1979 The persistence of direct life cycle infectious diseases within populations of hosts. Lectures on Mathematics in the Life Sciences 12, pp. 1-67. Providence, RI: AMS. Anderson, R. M., & May, R. M. 1983. Vaccination against rubella and measles: Quantitative investigations of different policies. J. Hyg. Comb. 90, 259-325. BERGER, J. 1976 Models of rabies control. Proc. Workshop on Mathematical Models in Medicine, Mainz, Lecture Notes in Biomathematics II (J. Berger, W. Buhler, R. Repges, & P. Tautu, eds.), pp. 74-88. Berlin: Springer. DIETZ, K., & SCHENZLE, D. 1985 Proportionate mixing for age-dependent infection transmission. J. Math. Biol. 22, 117-20. GREENHALGH, D. 1987 Analytical results on the stability of age-structured epidemic models. IMA J. Math. Appl. Med. Biol. 4, 109-44. GREENHALGH, D. 1990a An epidemic model with a density-dependent death rate. IMA J. Math. Appl. Med. Biol. 7, 1-26. GREENHALGH, D. 1990b Deterministic models for common childhood diseases. Int. J. Syst. Sci. 21, 1-20. GREENHALGH, D. 1992a Some threshold and stability results for epidemic models with a density-dependent death rate. Theor. Pop. Biol., to appear. GREENHALGH, D. 1992b Vaccination in density-dependent epidemic models. Bull. Math. Biol, to appear. HOPPENSTEADT, F. C. 1975 Mathematical theories of populations: Demographics, genetics and epidemics. SIAM Regional Conf. Ser. Applied Mathematics. Philadelphia, PA: SIAM. MCLEAN, A. R., & ANDERSON, R. M. 1988a Measles in developing countries. Part I: Epidemiological parameters and patterns. Epidemiol. Infection 100, 111-33. MCLEAN, A. R., & ANDERSON, R. M. 1988b Measles in developing countries. Part II: The predicted impact of mass vaccination. Epidemiol. Infection 100, 419—42. MOLLISON, D. 1985 Sensitivity analysis of simple epidemic models. In: Population Dynamics of Rabies in Wildlife (P. J. Bacon, ed.), pp. 223-34. London: Academic Press. NISBET, R. M., & GURNEY, W. S. C. 1982 Modelling Fluctuating Populations. New York: Wiley.
106
DAVID GREENHALGH
NOLD, A. 1980 Heterogeneity in disease transmission modelling. Math. Biosci. 52, 227—40. RINALDI, F. 1990 Global stability results for epidemic models with latent period. IMA J. Math. Appl. Med. Biol. 7, 69-75. SANCHEZ, D. A. 1968 Ordinary Differential Equations and Stability Theory: An Introduction. San Francisco: Freeman. VERHULST, P. F. 1838 Notice sur la loi que la population suit dans son accroissement. Correspondence Mathimatique et Physique 10, 113-21.