Margaret Chase Smith Policy Center
5784 York Complex Bldg. #4 Orono, Maine 04469-5784 Fax: 207-581-1266 mcspolicycenter.umaine.edu
March 7, 2016 To: Fr: Cc:
Janet Mills, Attorney General Marcella Sorg, PhD Mark Flomenbaum, MD Margaret Greenwald, MD Clare Bryce, MD
Re:
Drug deaths January-December 2015 statewide brief update
A “drug death” is identified when one or more drugs are mentioned on the death certificate as a cause or contributing factor. Most drug deaths in Maine during the last decade are caused by two or more drugs. In this analysis, deaths known to be due to pharmaceutical fentanyl and pharmaceutical morphine have been excluded from totals for illicit fentanyl and heroin. Heroin very often cannot be discriminated from morphine in toxicology, so many death certificates mention heroin/morphine as the cause, although we know most of these are probably heroin deaths, based on other evidence. In this analysis, after known pharmaceutical morphine deaths were removed, “heroin” and “heroin/morphine” deaths were combined in one “heroin” total.
In 2015 there were 272 drug-induced deaths statewide, 31% more than in 2014, which had 208. The increase in drug deaths during 2015 continues a multi-year rise in deaths due to heroin and non-pharmaceutical fentanyl, sometimes in combination with each other. During the second half of the year there were 20% more deaths due to non-pharmaceutical fentanyl and acetyl fentanyl than in the first half of the year, and 5% more deaths due to heroin in the second half compared to the first half.
157 (58%) of the 272 total drug deaths were due either to heroin (107 deaths, 39% of all drug deaths) and/or non-pharmaceutical fentanyl or acetyl fentanyl (87 deaths, 32% of all drug deaths) with a wide variety of co-intoxicant combinations with other drugs or alcohol. Of the 87 deaths due to fentanyl and/or acetyl fentanyl, 74 were due to fentanyl and 32 to acetyl fentanyl (19 of these deaths were due to a combination of fentanyl and acetyl fentanyl).
111 (41%) of the 272 deaths were due to pharmaceutical opioids (drugs used medically for pain control), usually in combination with other drugs. The number of these deaths is up slightly from 101 in 2014.
DEMOGRAPHICS Of the 272 deaths, 182 (67%) were male, and 33% female, continuing the same pattern as previous years.
The ages of the decedents ranged from 18-89, mostly under 60. The average age was 42, slightly older than in previous years. Of the 272 decedents, 5% were 1824, 13% 25-29, 15% 30-34, 14% 35-39, 10% 40-44, 11% 45-49, 14% 50-54, 9% 55-59, and 6% 60 and over.
GEOGRAPHIC DISTRIBUTION Counties with 10 or more deaths o Androscoggin, 27 deaths, 10% of statewide deaths) o Cumberland, 86 deaths, 32% of statewide deaths o Kennebec, 33 deaths, 12% of statewide deaths o Penobscot, 26 deaths, 10% of statewide deaths o York, 38 deaths, 14% of statewide deaths o All other counties had between 1 and 9 deaths in 2015. Towns/Cities with 10 or more deaths o Bangor: 13 deaths (5%) o Lewiston: 15 deaths (6%) o Portland 46 deaths (17%) HEROIN DEATHS (N=107) 94 (88%) of the 107 deaths due to heroin included at least one other drug or alcohol mentioned on the death certificate as a cause 24 (22%) included a pharmaceutical opiate 36 (34%) included non-pharmaceutical fentanyl or acetyl fentanyl 30 (28%) included alcohol 28 (26%) included a benzodiazepine 23 (22%) included cocaine NON-PHARMACEUTICAL FENTANYL AND ACETYL FENTANYL DEATHS (N=87) Of the 87 deaths due to either non-pharmaceutical fentanyl or acetyl fentanyl, o 78% of fentanyl/acetyl fentanyl deaths included at least one other drug or alcohol 36 (42%) included heroin 19 (22%) included both fentanyl and acetyl fentanyl 11 (13%) included a pharmaceutical opiate 17 (20%) included a benzodiazepine 20 (23%) included alcohol 13 (15%) included cocaine
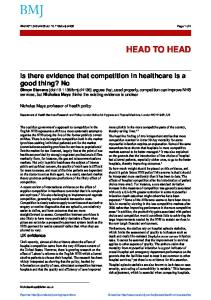
Total Number of Maine Deaths due to Pharmaceutical Opioids, Illicit Drugs, and Total Drug Deaths, Alone or in Combination 300
250
200
150
100
50
0
1997 1998 1999 2000 2001 2002 2003 2004 2005 2006 2007 2008 2009 2010 2011 2012 2013 2014 2015 Total 34 54 66 60 90 165 153 162 176 167 154 164 179 167 155 163 176 208 272 Pharm Opioid 16 31 34 39 49 124 116 114 113 105 111 115 121 124 108 96 107 104 111 Illicit 8 18 13 15 31 35 47 50 61 59 49 30 22 17 20 43 40 75 163
Number of Deaths due to Key Pharmaceuticals Alone or in Combination 90 80 70 60
50 40 30
20 10 0 Oxycodone Methadone Benzodiazepines
2009 50 48 56
2010 48 50 57
2011 34 41 39
2012 42 31 47
2013 32 37 63
2014 42 30 70
2015 37 38 77
Number of Heroin & Non-Pharmaceutical Fentanyl Deaths 2015 by Age and Sex 200 180 160 140 120 100 80 60 40 20 0
182
90 67
53 4 Sex
14
4
Age 18-24 Male
Age 25-44 Female
10 Age 45+
Number of Deaths due to Key Illicit Drugs Alone or in Combination 120 100 80 60 40 20 0
Heroin ** Non-Pharm. Fentanyl, Acetyl Fentanyl Cocaine
2009 13
2010 7
2011 7
2012 29
2013 34
2014 58
2015 107
5
6
10
8
9
42
87
9
10
13
13
10
24
34
** Heroin very often cannot be discriminated from morphine by toxicology, so many death certificates mention heroin/morphine as the cause, although most are probably heroin deaths, based on other evidence. In this analysis, after known pharmaceutical morphine deaths were removed, “heroin” and “heroin/morphine” deaths were combined in one “heroin” total.
Number of Drug Deaths in Five Largest Counties 100 90 80 70 60 50 40 30 20 10 0
2009 2010 2011 2012 2013 2014 2015
Androscoggin 17 15 12 17 14 26 27
Cumberland 45 39 29 49 46 43 86
**Kennebec had fewer than 10 deaths in 2009.
Kennebec** 0 23 18 12 26 20 33
Penobscot 25 19 21 18 21 20 26
York 32 24 19 22 21 37 38
Heroin and Non-Pharmaceutical Fentanyl County Death Rates for 2013-2015 Age-Adjusted Rate per 100,000 Cumberland
10.69
York
9.47
Androscoggin
9.08
Kennebec
7.08
Penobscot
5.81 0
2
4
6
8
10
12