Communications in Physics, Supplement, pp.40 (2004)
STATISTICS OF COULOMB - BLOCKADE SPACING IN A DISORDERED QUANTUM DOT NGUYEN VIET HUNG and NGUYEN VAN DUC Institute of Physics and Electronics, VAST, P. O. Box 429 Bo Ho, Hanoi 10000, Vietnam Abstract. Using the exact diagonalization method we calculate the distribution of conductance peak spacings for disordered square quantum dots in the Coulomb blockade regime in the presence of an external magnetic field for both the spinless and spin system. We show that: 1) the e− − e− interaction leads the distribution to a Gaussian-like form, 2) in the presence of a magnetic field the distribution becomes not only close to the Gaussian form but also more symmetric, and 3) for the spin system our results qualitatively agree with experimental data when considering the role of the magnetic field on the form of the distribution.
I. INTRODUCTION Advanced nano-fabrication techniques have made it possible to confine small numbers of electrons electrostatically within the two-dimensional electron gas (2DEG) of a semiconductor hetero-structure [1,2]. Both the electric charge and energy of such ”quantum dots” are quantized and hence such structures are sometimes referred to as ”artificial atoms” [3,4]. In transport measurements the charging of these electron islands with single electrons leads to the observation of periodic conductance oscillations in the Coulombblockade (CB) regime [1]. These reflect the electrostatic coupling of the quantum dot to its environment, and additionally they contain information about the eigenenergies and eigenfunctions of the electrons in the dot. For sufficiently low temperatures T and small dot capacitances C, quantum dots isolated from reservoir of the 2DEG via tunnel barriers can exhibit CB phenomena. When EC = e2 /C >> kB T , transport through the quantum dot is blocked. A finite conductance only occurs when the total energy of the quantum dot with N electrons is close to the energy of the dot occupied by N + 1 electrons. This is the case when F (N + 1) − F (N ) = µ, where F (N ) denotes the free energy of the quantum dot with N electrons and µ is the chemical potential of the leads. If this happens, then a single electron can tunnel from the reservoir into the dot [1]. This can be achieved by tuning the dot’s potential with a center gate. A sweep in the center gate voltage Vg results in the well-known conductance oscillations in the Coulomb- blockade regime. In the constant interaction (CI) approximation, the free energy of the dot populated by N electrons is the sum of the ground state energy E(N ) and the electrostatic energy U (N ). Here, U (N ) = e2 N 2 /2C − N eαVg , P PN ↑ PN ↓ and E(N ) = N i=1 εi for the spin-less electrons system, while E(N ) = i=1 εi + i=1 εi
2
NGUYEN VIET HUNG and NGUYEN VAN DUC
for the spin degenerate system. εi is the single-particle energy, N ↑ (N ↓) is the number of electrons for which the spin is in the up (down) state and α is the ratio between the dotto-gate capacitance and the total capacitance of the dot. The change ∆2 in the chemical potential needed to add a particle can be measured as ∆2 = eα∆Vg , with ∆Vg is the difference between gate voltages at which two adjacent peaks occur in the conductance - gate voltage curve. From considerations above, one finds that ∆2 = e2 /C + ∆εN for the case of the spin-less system, where ∆εN = εN − εN −1 , while for the case of the spin degenerate system ∆2 = e2 /C (N even) and e2 /C +∆ε(N +1)/2 (N odd). Thus, in principle, one should be able to extract the energy level spacings ∆εN from the so-called ”addition spectrum” obtained in Coulomb-blockade measurements. From the addition spectrum, one can calculate the nearest-neighbor spacing (NNS) distribution P (s), which can be compared to the predictions of Random Matrix Theory (RMT). P (s) is the distribution of the spacings s between adjacent levels of an energy spectrum, where the spacings are normalized to a mean value of unity. The results for P (s) within the framework of RMT are very well approximated ¡ by2 the ¢ Wigner surmise [5]. In the case of the spin-less system PW D (s) = ¡ (π/2)¢exp ¡−πs /4 ¢ in the absence a magnetic field B = 0 (GOE case) and PW D (s) = 32/π 2 exp −4s2 /π for B 6= 0 (GUE case), while in the case of the spin degenerate system P (s) = (1/2) [δ (s) + PW D (s)] where s = (∆2 − e2 /C)/ < ∆2 − e2 /C > (< ... > denotes an average over realizations). The CI + RMT model describes very well the distribution of CB heights in quantum dots [6]. However, in refs. [7-12], the authors showed the failure of the CI + RMT in describing the distribution of CB peak spacings in quantum dots. In ref. [7], Sivan et al. presented the experimental results in which the fluctuations are up to a factor of five larger than the predicted value and the histogram of ∆2 reveals different distributions of the experimental data from the Wigner-Dyson distribution. They also showed that the distributions of experimental data are wider and more symmetric than the Wigner-Dyson statistics and this can be explained by the role of electron-electron interaction. Refs. [8,10] showed the absence of any sign of a bimodal structure, which seems to contradict the predictions of the CI + RMT model. Avraham Cohen et al. [11] considered the effect of e− − e− interaction on the conductance peak spacing distribution by the Hartree - Fock approximation method. They showed that the distribution is Gaussian with large fluctuations that exceed the mean spacing of non - interacting systems. In ref. [12], the absence of spin degeneracy has been interpreted as the consequence of strong interactions. A more recent experimental conducting in quantum dots with reduced interactions seems to support this prediction, as their data can be well approximated by a modified bimodal Wigner surmise where the interactions beyond the constant interaction model are considered [13]. In this paper, our current research is limited in the region where the electronelectron interaction is important. We, therefore, use an exact diagonalization method to investigate the role of e− − e− interaction and magnetic field on the form of the spacing distribution. Although paying the price for handling only small systems, we avoid uncertainty of approximations and fully include the effects of electron correlations. Because of the chaotic nature of dots we do not expect such a dependence on the electron numbers
STATISTICS OF COULOMB - BLOCKADE SPACING IN ...
3
to play an important role and hence the study of a small number of electrons is still useful in understanding the properties of dots. Our results for both spin and spin-less systems were compared to previous results. II. THE SYSTEM OF SPIN-LESS ELECTRONS Our model of a quantum dot is a system of N interacting spinless electrons in a square lattice of M sites. The Hamiltonian of the system is composed of the tight-binding ~ is applied Anderson Hamiltonian and long range Coulomb interactions. A magnetic field B perpendicularly to the lattice plane. The Hamiltonian expression is given as follows: H=
X i,j
ηi,j a+ i,j ai,j
+U
+ X a+ i,j ai,j al,p al,p i,j6=l,p
|ri,j − rl,p |
−t
X
+ (ei2π(φ/φo ) a+ i,j+1 ai,j + ai+1,j ai,j + h.c)
i,j
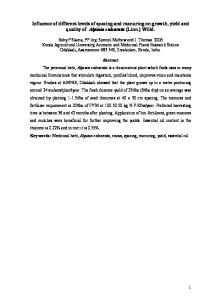
where ηi,j is the energy of site (i, j), chosen randomly between −W/2 and W/2 with uniform probability, a+ i,j (ai,j ) is the creation (annihilation) particle operator on site (i, j), t is the constant hopping matrix element, φo is the quantum flux unit, φo = h/e = 4.14 mT µm2 , φ is the quantum flux, φ = Ba2 , in which a is the lattice constant, and U is a constant that characterizes the Coulomb interaction. We consider a 4×4 square lattice of 16 sites and N = 6 electrons. The size of M = 8008. The m × m Hamiltonian matrix is the many-body Hilbert space is m = CN numerically diagonalized and eigen-vectors ψN are obtained. The strength of electronelectron interactions, U , is varied, in units of t, between 0 − 4, while the disorder strength is set to W = 2t in order to assure RMT behavior for non-interacting case. For each value of U , the results for each value of N are averaged over 1000 different realizations of √ disorder. Parameters of a quantum dot is characterized by a constant, rs = 1/ πnaB , the ratio between the average inter-particle Coulomb interaction and the Fermi energy p (n is the electron density and aB is the Bohr radius). For N = 6 and M = 16, rs = π/2(U/4t), and for all experimental setups rs ∼ 1 [7,12], resulting in U/t ∼ 4. The case of non-interacting is showed in Fig.1(a). In general, the results are consistent with predictions of RMT in both cases of GOE and GUE (in inset of Fig.1(a)). In particular, for the case of B = 0, the numerical result describes accurately the prediction of RMT: the spacing distribution is very close to that of GOE. However, when a magnetic field is applied, the distribution function seems to be a little wider than the prediction of RMT. The same observations have been reported in ref. [7]. In accordance with ref.[7], as the interaction becomes stronger, the distribution shifts from RMT’s prediction to a Gaussian-like statistics. In Fig.2, we present cases of different values of the Coulomb interaction constant. It is clearly shown that, in the case of U/t = 4(rs ∼ 1), the fluctuations are up to a factor of five larger than RMT’s prediction (compare Fig.1(b, c, d) with Fig.1(a)). Fig.1 also shows that as the strength of interactions increases, there is a crossover from an RMT-statistics to Gaussian-statistics with non-Gaussian tails. These results agree with those published by Sivan et al. [7]. However, an unclear problem is that the widths of the peak spacing distribution σ(∆2 ) do not agree with experiments [14]. Sivan et al. [7] and Simmel et al. [8] found σ(∆2 ) ≈
4
NGUYEN VIET HUNG and NGUYEN VAN DUC
2.0
a) U = 0.0
5
2.0
P(s)
1.5
P(s)
1.5 1.0
3
0.5
1.0
b) U = 1.0
4
0.0 0
1
2
3
s
0.5
4
2 1
1.6
P(s)
2.0
3.0
0 4.0 0.0 0.5 5 d) U = 4.0 4
3
3
2
2
1 0 0.0
1.0
1.5
2.0
1.4
σ(∆ 2 )
0.0 0.0 1.0 5 c) U = 2.0 4
1.2
1
0.5
1.0
s
1.5
0 2.0 0.0
0.5
1.0
s
1.5
2.0
1.0 0.0
1.0
2.0
3.0
4.0
U/t
Figure 1: Peak-spacing distribution for the Figure 2: Width of the distribution funcspin-less system in the absence of a mag- tion, σ(∆2 ), vs U/t, while W = 2t and netic field except the inset (a). (a) the case B = 0.0. of non-interacting electrons, B = 0, compared to the Wigner surmise (GOE), the inset shows the distribution function for the case B 6= 0 (GUE). For the cases of interacting system: (b) U = 1t, (c) U = 2t and (d) U = 4t. W = 2t for all cases. (0.10 − 0.15)e2 /C ∼ (2 − 3)∆, ∆ =< εi − εi−1 >. In the extensive experiments, Patel et al. found a smaller fluctuation σ(∆2 ) ≈ (0.05)e2 /C ∼ ∆ [10]. Fig.2 shows the variation of σ(∆2 ) as the strength of electron-electron interaction increases. These results agree with ref. [10] as U/t ∼ 4. It is also shown that the interaction makes the deviation from CI+RMT model in the CB peak spacing distribution. In refs. [10,13], the authors have observed that a magnetic field causes the narrowing of the distribution function. The ratio of the distribution widths between the cases of B = 0 and B 6= 0 is σB=0 /σB6=0 ∼ 1.2 − 1.3 [10]. Fig.3 shows the influence of a magnetic field on the form of the distribution. The results show that the magnetic field makes the distribution more symmetric and the distribution widths fluctuate around that in the case of B = 0. In the presence of a magnetic field, the hopping terms multiply a phase coefficient which is proportional to B. It is possible that only the oscillation of the phase coefficient with B causes fluctuations of the distribution function. We suggest that in the presence of a magnetic field, the interaction between spins of the system and the magnetic field makes the distribution function narrower as shown in refs. [10,13]. To check this in the next section, we consider a model of the spin degenerate system and study the effect of a magnetic field on the peak spacing distribution. III. THE SPIN DEGENERATE SYSTEM
5
STATISTICS OF COULOMB - BLOCKADE SPACING IN ...
4
a) 2πφ/φo = 0.0
b) 2πφ/φo = 0.5
c) 2πφ/φo = 1.0
d) 2πφ/φo = 2.0
P(s)
3
2
1
0
4
2
1
0 0.0
a)
b)
3
P(s)
P(s)
3
2
1
0.5
1.5
1.0
s
0.0
0.5
1.0
s
1.5
0 0.0
2.0
Figure 3: Peak-spacing distribution for the case of the spin-less system for different values of the magnetic field B: (a) φ = 0, (b) 2πφ/φo = 0.5, (c) 2πφ/φo = 1, and (d) 2πφ/φo = 2. With W = 2t and U = 2t.
0.5
1.0
s
1.5
0.0
0.5
1.0
s
1.5
2.0
Figure 4: Peak-spacing distribution for the case of the spin degenerate system: (a) in the absence of a magnetic field and (b) in the presence of a magnetic field with 2πφ/φo = 1.0. W/t = 2 and U/t = 2 for both two cases.
We start with a model of the quantum dot that is a spin system of N electrons on a lattice of M sites. In this case, the Hamiltonian of the system is given by the sum of the tight binding Anderson Hamiltonian and the e− − e− interactions, where the latter includes the long range Coulomb interactions and the on - site interactions. The Hamiltonian expression is X X + H = ηi,j,σ a+ (ei2π(φ/φo ) a+ i,j,σ ai,j,σ − t i,j+1,σ ai,j,σ + ai+1,j,σ ai,j,σ + h.c) i,j,σ
+ U
X i,j6=k,l;σ,σ 0
i,j,σ + 0 ai,j,σ ai,j,σ a+ k,l,σ 0 ak,l,σ
|~ri,j − ~rk,l |
+V
X
+ a+ i,j,↑ ai,j,↑ ai,j,↓ ai,j,↓ .
i,j
Here σ =↑, ↓ is the spin of electron, V is the on-site interaction constant and U is the longrange component of the Coulomb interaction constant. For the calculations, we choose W/t = 2, U/t = 2 and consider the effects of a magnetic field on the distribution function. An on-site coupling V = (10/3)U was chosen, corresponding to the Hubbard’s calculation of the ratio between V and U for weakly overlapping hydrogen-like wave functions [15]. In ref. [10], the authors have announced that the distributions both in the absence and in the presence of the magnetic field are symmetric and Gaussian, and the distribution is systematically wider at B = 0 by a factor of ∼ 1.2 ± 0.1. For the case of the spin-less system, the magnetic field only makes the distribution becoming more symmetric. In the present study, we consider the case of a system of 5 electrons on a lattice of 12 sites and study the role of a magnetic field on the distribution form. In fig. 3, we present results for the case of the absence of the magnetic field and the case of the presence of the magnetic
6
NGUYEN VIET HUNG and NGUYEN VAN DUC
field with 2πφ/φo = 1.0. In the absence of the magnetic field, the distribution of the spin system agrees well with that of the spin-less system in shape. However, when the magnetic field is applied, the distribution function becomes narrower and more symmetric. The ratio between the width of the distributions in the absence and in the presence of the magnetic field is σ(B = 0)/σ(B 6= 0) ∼ 1.1. This agrees well with the experimental data [10]. IV. CONCLUSIONS We have used successfully the exact diagonalization method to calculate the conductance peak spacing distribution for disordered quantum dots in the Coulomb-blockade region. Our results show correctly the effects of electron-electron interactions as well as the magnetic field on the form of the distribution. Our results agree with experimental data and previous findings. They affirm the failure of RMT in describing the fluctuation of peak spacings. ACKNOWLEDGMENT The authors thank Prof. N. V. Lien for useful directions. This work was supported by the research fund from VAST’s Research program on ”Modeling and design of electronic nano-devices” Laboratory of Modeling and Computational. REFERENCES 1. H. van Houten, C. W. J. Beenakker and A. A. M. Staring, in Single Charge Tunneling, edited by H. Grabert, J. M. Martinis and M. H. Devoret (Plenum, New York) 1991. 2. U. Meirav and E. B. Foxman, Semicond. Sci. Technol., 10 (1995) 255 and references therein. 3. M. A. Kastner, Physics Today, 46 (1993) 24. 4. R. C. Ashoori, Nature, 379 (1996) 413. 5. F. Haake, Quantum Sigatures of Chaos (Springer-Verlag, Berlin) 1990. 6. A. M. Chang, H. U. Baranger, L. N. Pfeiffer, K. W. West , and T. Y. Chang, Phys. Rev. Lett., 76 (1996) 1695. 7. U. Sivan, R. Berkovits, Y. Aloni, A. Auerbach , and G. Ben-Yoseph, Phys. Rev. Lett., 77 (1996) 1123. 8. F. Simmel, T. Heinzel, and D. A. Wharam, Europhys. Lett., 38 (1997) 123. 9. F. Simmel, D. Abusch-Magder, D. A. Wharam, M. A. Kastner, and J. P. Kotthaus, Phys. Rev. B, 59 (1998) R10441. 10. S. R. Patel, S. M. Cronewett, D. R. Stewart, A. G. Huibers, C. M. Marcus, C. I. Duru¨ oz, L. S. Harris, Jr., K. Campman, and A. C. Gossard, Phys. Rev. Lett., 80 (1998) 4522. 11. A. Cohen, K. Richter, and R. Berkovits, cond-mat/9902342 12. R. Berkovits, Phys. Rev. Lett., 81 (1998) 2128. 13. S. L¨ uscher, T. Heinzel, K. Ensslin, W. Wegscheider, and M. Bichler, Phys. Rev. Lett., 86 (2001) 2118. 14. Y. Alhassid, Rev. Mod. Phys., 72 (2000) 895. 15. J. Hubbard, Proc. R. Soc. London A, 276 (1963) 238.