Copeia 104, No. 2, 2016, 570–576
Stream and Riparian Habitat Use by Anurans along a Forested Gradient in Western Georgia, USA Kyle Barrett1,2, Craig Guyer1, Stephen T. Samoray1,3, and Yoichiro Kanno2 Urban development is known to alter the structure, chemistry, and biota associated with stream systems; however, little is known about the dynamics of anurans that breed in and around streams. We used automated devices to record breeding anurans for one year across a forested gradient in an effort to identify species-specific sensitivities to urbanization. Six of 13 total species found during the study were present in surveyed streams that were representative of a gradient ranging from heavily urbanized to largely forested, and maximum species richness occurred in watersheds with rapid urban development but low values of impervious surfaces such as pavement and roof tops. The best landscape-scale predictor of assemblage metrics such as species richness, total species activity, and species diversity was generally percent forest cover at the watershed scale (or in very large buffers around the sample point). We used Bayesian inference to estimate detection probability and occupancy for 11 species. While detection probability varied across sampling occasions, there was no evidence that occupancy was a function of forest loss for any species. Urban streams and riparian areas are often severely altered when compared to similar habitats in forested areas. Anuran richness and diversity from urban areas was not altered to the same extent as caudates, which have been sampled from these same streams in previous studies. Increased vagility of anurans, coupled with different breeding strategies, may help to explain this discrepancy.
U
RBAN development can alter ecological systems and affect wildlife through loss of habitat (McKinney, 2006, 2008). The influence of urbanization on aquatic systems has been particularly well documented (Walsh et al., 2005). These habitats can undergo extreme shifts in character through a number of mechanisms such as siltation, channelization, forest cover loss, and hydrologic regime changes (Paul and Meyer, 2001; Burcher et al., 2007), and such habitat transformations have quantifiable ramifications on wildlife. Helms et al. (2005) found that fish assemblage composition shifts and fish health decreases with urbanization, and Hamer and McDonnell (2008) suggested that urban development contributes to the global decline of amphibian populations by threatening one-third of the world’s species. Anuran responses to urbanization have been examined primarily within lentic systems. Much of the research has focused on correlates of species richness or species presence at urban breeding sites. For example, Parris (2006) provided evidence that larger, more connected ponds increase species richness of anuran assemblages in the greater Melbourne area of Australia, and a study in the National Capital Region of Canada found that anuran abundance is usually negatively correlated with age of urban area (Gagn´e and Fahrig, 2007). Few studies have examined species-specific responses of frogs to urbanization; however, Hamer and McDonnell (2010) reviewed a large database of amphibian records near Melbourne, Australia and noted a lower probability of persistence for some species relative to others in urbanized regions. In addition, Canessa and Parris (2013) recently identified a strong and interacting influence of both road density and aquatic vegetation on a stream-dwelling anuran assemblage in Australia. Specifically, their data suggest areas of high local habitat quality may not be colonized by species if road density is sufficient to deny individuals access to the habitat from other occupied areas. Finally, Gibbs (1998) evaluated the percent occurrence of Spring Peepers (Pseudac-
1
ris crucifer) and Wood Frogs (Lithobates sylvaticus) along a gradient of decreasing urbanization. Spring Peepers showed little sensitivity to fragmentation, but Wood Frogs exhibited a threshold-type response where they were nearly absent in the most fragmented habitats. Overall, there is little evidence regarding how anurans within stream and riparian habitats respond to watershed development and virtually no information on this topic from North America. This information gap coupled with increasing urban development, prompted us to establish an intensive one-year sampling protocol to examine breeding anurans across a forested gradient. As many others have done (Bridges and Dorcas, 2000; Dorcas et al., 2009; Steen et al., 2013), we used auditory surveys to document the calling assemblage across sampling sites. Our goal was to describe patterns of male anuran breeding advertisements across forested, developing, and urbanized watersheds, both in the context of anuran species richness and the calling frequency of individual species. We also evaluated the scale at which land cover best predicts characteristics of the assemblage. MATERIALS AND METHODS Study sites.—We recorded anuran breeding calls at nine separate watersheds within western Georgia, USA (Fig. 1; Table 1). These sites were part of a large, interdisciplinary study on the effects of urbanization (Lockaby et al., 2005). The watersheds were located within three Georgia counties (Muskogee, Harris, and Meriwether), and each watershed was drained by either a 2nd- or 3rd-order stream. These streams were embedded within riparian zones that contained a mix of native hardwoods, and, in the urbanized areas, some invasive species such as Chinese privet (Ligustrum sinense) and oleaster (Elaeagnus spp.) were present. The sampled reaches of streams ranged in base-flow wetted width from 285 to 739 cm and in depth from 20 to 43 cm. All streams contained a combination of moderately flowing riffles or
Department of Biological Sciences, 331 Funchess Hall, Auburn University, Auburn, Alabama 36849. Present address: Department of Forestry and Environmental Conservation, 261 Lehotsky Hall, Clemson University, Clemson, South Carolina 29634; Email: (KB)
[email protected]. Send reprint requests to KB. 3 Present address: Copperhead Consulting, Inc., 11641 Richmond Road, Paint Lick, Kentucky 40461. Submitted: 22 July 2015. Accepted: 21 December 2015. Associate Editor: J. W. Snodgrass. DOI: 10.1643/CE-15-318 Published online: 28 June 2016 Ó 2016 by the American Society of Ichthyologists and Herpetologists 2
Barrett et al.—Frog response to urbanization
571 Table 1. Watershed land cover descriptions and sample sizes for the nine frog call survey locations in western Georgia, USA. Values in bold represent mean values for land cover and sums for sample size.
Site Urban averages BU1 (Lindsey Creek) BU2 (Cooper Creek) RB (Roaring Branch) Developing averages SB1 (Schley Creek) SB2 (Standing Boy Creek) SB4 (Standing Boy Trib.) Forested averages BLN (Blanton Creek) MO (Cline’s Branch) MU3 (Turntime Branch)
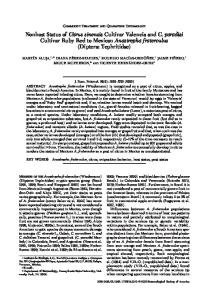
Fig. 1. Location of study sites used to monitor anuran calling activity. The white counties on the inset map of Georgia represent the region depicted in the main map. Local stream names, accompanying the stream codes provided here, are given in Table 1.
runs interspersed with deeper pools, which may have provided breeding habitat for at least some of our recorded species. During sampling for a separate study (Barrett et al., 2010a), we confirmed Fowler’s Toad (Anaxyrus fowleri) larvae in at least three of the nine streams and captured hylid and ranid larvae; however, we were unable to confirm species identity for these captures in the field. None of the sites had known permanent or semi-permanent lentic habitats near the sampling area. In previous studies (Barrett and Guyer, 2008; Barrett et al., 2010a), these watersheds were categorized based on predominate land use in each. We followed this classification scheme by identifying categories typified by forested, urban, and developing land uses (n ¼ 3 for each category). Forested watersheds were those with .75% total forest cover and ,3% land cover as impervious surface. Urban watersheds were those with .25% land cover identified as impervious surface. The developing watersheds had relatively low impervious surface (3–5%) and moderate forest cover (64– 73%) in the watershed, but these sites are located in Harris County, which was one of the fastest growing counties in the United States during our surveys (Lockaby et al., 2005). Harris County experienced a 33% increase in population growth between the 1990 and 2000 U.S. census (Lockaby et al., 2005), so the construction of individual housing units and apartment complexes was frequently observed in these watersheds during our study. We used this classification scheme to assess whether or not there were generalizable trends among watersheds with similar land use composition.
% Impervious Months Minutes % surface sampled recorded Forest 0.25 0.23 0.25 0.27 0.31 0.73
0.32 0.40 0.25 0.30 0.03 0.02
9.7 12 6 11 8.3 6
1246 1504 587 1647 1067 632
0.73
0.03
8
939
0.64 0.33 0.76 0.81
0.03 0.01 0.01 0.02
11 11.3 10 12
1629 1391 1002 1928
0.78
0.02
12
1242
Formal ordination analysis on the land use of each site in a previous study illustrates the extent to which these land use types differ among groups (Barrett and Guyer, 2008). The close proximity of sites within a given category means that ecological inference must come with the caveat that differences may simply be a result of geography. We recognize this constraint, but note that it is not an uncommon occurrence in ecological studies of urbanization (Alig et al., 2004). Frog call surveys.—From 1 March 2007–28 February 2008, we deployed an automated recording system (ARS) at each of the study sites within 5 m of the stream bank. Because we have no way of knowing that all recorded species actually bred within the stream habitats, we view the recordings as generally representative of the diversity present within a stream and its hydrologically connected riparian area. The ARS recorded at set intervals, typically for two weeks before the batteries expired, at which point the units were returned to the lab so new batteries could be installed and the recorded data could be downloaded. We returned the units to the field within three to seven days after this process except when periodic failures required system repairs. All sites were sampled at least six months out of the year, and all land cover categories were sampled in all months throughout the study period (Table 1). Each ARS was set to record for one minute at the beginning of each hour from 1800 to 0300 h during 1 September–15 June, and, to adjust for later sunset, from 1900 to 0400 h 16 June–31 August. The ARS were built by Luis J. Villanueva-Rivera and were composed of a Sony omnidirectional ECM-MS908C Electret Condenser Microphone, a Sony Hi-MD MZ-RH10 digital portable recorder, and a solid-state timer with a microcontroller (Acevedo and Villanueva-Rivera, 2006). Data were recorded to a 1 gigabyte minidisc and saved to .wav file format for processing. When deployed, the recorder and microcontroller were stored in a weather-proof case (Pelican 1450 Case), and the microphone was inverted and suspended approximately 2 m above the ground. To protect the microphone during inclement weather, we encased all but the receiving end of the device in a ~10 cm PVC pipe. We
572
Copeia 104, No. 2, 2016
Table 2. Chao estimated Shannon diversity index (Row 1) and species richness (Row 2) from incidence data (Chao et al., 2014; Hsieh et al., 2015). Subsequent rows provide the number of recordings with a species’ call from each watershed type. Species with parenthetical four-letter codes were used in the occupancy analysis.
Chao est. of Shannon diversity (6SE) Chao est. of species richness (6SE) Anaxyrus americanus Anaxyrus fowleri (anfo) Acris sp. (acsp) Hyla avivoca (hyav) Hyla chrysoscelis (hych) Hyla cinerea (hyci) Hyla gratiosa (hygr) Pseudacris crucifer (hycr) Pseudacris feriarum (psfe) Lithobates catesbeianus (lica) Lithobates clamitans (licl) Lithobates sphenocephalus (lisp) Gastrophryne carolinensis
Forested
Developing
Urban
0.89 (0.05) 10.00 (2.26) — 60 — — 3 — 2 6 1 9 348 15 —
1.69 (0.27) 11.25 (0.73) 2 104 2 1 94 — 11 120 165 22 366 — 19
0.98 (0.05) 8.00 (2.24) — 236 — — 1 2 — 8 — 66 26 10 —
deployed one unit at each site within 4 m of the stream bank. The ARS we used are capable of detecting and recording a 96 dB frog call (approximately the known decibel level for many species in our study; Gerhardt, 1975) from approximately 150 m (K. Barrett, unpubl. data). Data analysis.—One of four different trained observers listened to each digital file in the laboratory and noted the species of frog calling. From these data, we described general patterns of species richness, Shannon diversity, and percent calling activity. Species richness and Shannon diversity were calculated from incidence data, and comparisons across sites were generated from sample-based rarefaction using methods described by Chao et al. (2014) and analyzed using the iNEXT package (Hsieh et al., 2015) in Program R (R Core Team, 2015). Percent calling activity was calculated as the total number of minutes with a species detected, summed across all species, divided by the total number of minutes recorded at a site. We used linear regression to determine if species richness and percent calling activity patterns were related to forest cover. Specifically, we regressed these response variables to percent forest cover in the entire watershed (Lockaby et al., 2005), and percent forest within smaller scale land use buffers around our ARS monitoring stations. We generated these buffers based on radii of one, two, and four km using ArcGIS 10.1 (ESRI) and extracted land cover data from 30 m2 2006 National Land Cover Database (US Geological Survey; http://www.mrlc.gov/nlcd2006.php). We then used R2 values to determine which buffer size best explained variance in the response variables, so that we could refine hypotheses regarding the spatial scale at which streamassociated anurans responded to changes in forest cover. Response variables followed a normal distribution. We used percent forest cover in our buffer analysis because this category more closely approximated a Normal distribution than percent urban cover (Barrett et al., 2010a); however, percent forest cover was still significantly different from a Normal distribution (a , 0.05; Anderson-Darling test for Normality). We examined percent calling activity of frogs as a way to assess response to forest loss across watersheds. Data were recorded during three sampling periods used by the North American Amphibian Monitoring Protocol (NAAMP) in this
region of Georgia (15 January–28 February, 15 March–30 April, and 15 May–30 June). NAAMP is a national program of standardized routes that are visited three times per year by trained volunteers, who record all frog calls heard during a five-minute observation period (Weir and Mossman, 2005). Following the NAAMP sampling protocol, we only focused on the first five minutes of data from nightly recordings for this portion of the analysis. However, we recognize that some species do have heightened activity patterns in the hours after 2200 (Bridges and Dorcas, 2000). We estimated the probability of detecting any of the species known to breed during these windows on an average call survey night at each site. Detection rate was estimated directly from the data (# of detections/days of sampling) for all species because of the high number of sampling occasions we had for most sites during each period (mean nights ¼ 15.8, range ¼ 8–32). Eleven species (Table 2) were detected at more than one site and were used in a single-season, multi-species occupancy modeling framework (Zipkin et al., 2010) to determine if the probability of species presence was a function of forest cover or land use category. For each site we randomly selected 30 days of recordings (or used all days for two developing sites that had 22 and 19 days of recordings). Because the true occupancy state of a site is not known with certainty, we used the repeated days of recordings to generate a formal distinction between species true absence and non-detection (i.e., false negatives). This distinction is created through a model of the observed data. We examined the influence of site, daily precipitation (present or absent during recording), mean daily temperature, and Julian date on detection probability, while assuming occupancy probability to vary among species (i.e., no covariates on occupancy). Models were compared using the Deviance Information Criterion (DIC; Spiegelhalter et al., 2002). All models with a DDIC value , 2 were considered equally competitive. Once the best model for detection was identified, we then incorporated those detection covariates into a suite of models and compared the fit of a model where occupancy probability was assumed to vary by species to models using additional covariates that might influence occupancy. These covariates were % forest cover in the watershed, % forest cover at three buffer distances (1, 2, and 4 km), and land use (defined categorically as urban, developing, and forested as detailed
Barrett et al.—Frog response to urbanization
Fig. 2. Rarefaction curves and associated standard errors for (left) species richness and (right) Shannon’s index as calculated from frog call sampling across three land use categories (n ¼ 3 streams for each category) in western Georgia, USA.
above). Species were treated as random effects. Intercepts and slopes of occupancy and observation models were drawn from a common distribution but were allowed to vary among species. This model specification enabled us to include those species with sparse data by sharing information across species. Single-season, multi-species occupancy models were built and analyzed using the Bayesian framework in Program JAGS (Plummer, 2003) called from Program R (R Core Team, 2015) with the ‘rjags’ package (Plummer, 2011). Models were fitted to the data using Markov chain Monte Carlo (MCMC) simulation with 20,000 iterations of 3 chains after 10,000 burn-in iterations and a thinning rate of 20. Uninformative priors were used for all parameter estimates. Covariates on occupancy or detection probabilities were declared statistically significant when the 95% credible interval (CI) of its effect size (i.e. regression coefficient) did not overlap with a value of zero. Model convergence was assumed by ensuring that plots of the MCMC chains are well mixed and the R-hat statistic was ,1.1 for all model parameters (Gelman and Hill, 2007). RESULTS We recorded 13 frog species across all sites (Table 2). Developing sites had the highest observed species richness and the highest mean Shannon diversity index, followed by forested, then urban sites. These differences were present even when sites were compared using sample-based rarefaction techniques that adjust for the number of available samples (Fig. 2). Among the six species recorded in all three watershed land cover categories, only American Bullfrogs (Lithobates catesbeianus) and Fowler’s Toads were heard more frequently at urban sites than in other land cover categories (Table 2). Green Treefrogs (Hyla cinerea) were heard only in urban habitats and were only recorded twice (Table 2). The amount of forested land showed the strongest positive correlation with percent calling activity (R2 ¼ 0.34, P ¼ 0.10) and species diversity (R2 ¼ 0.13, P ¼ 0.34) when assessed at the watershed scale; however, these relationships were still relatively modest and not statistically significant. For each of these response variables, the percentage of forested area within the watershed explained at least 8% more variance than buffers defined by any other distance from the sampling point. For species richness, the correlation was most
573
Fig. 3. Estimated mean occupancy and detection probabilities (with associated 95% confidence intervals) for the 11 species used in multispecies occupancy models. Species are ordered by increasing width of 95% CI around occupancy probability. Four species, Bird-voiced Treefrogs (Hyla avivoca), Upland Chorus Frogs (Pseudacris feriarum), Barking Treefrogs (Hyla gratiosa), and Cricket Frogs (Acris sp.), did not have sufficient data to estimate occupancy probability. Species codes are defined in Table 2.
pronounced when using the 4 km buffer (R2 ¼ 0.23). The correlation was marginally better than a buffer defined by a 1 km radius (R2 ¼ 0.17). For each of the species included in candidate models (Table 2), we first evaluated eight competing models with a combination of factors influencing detection probability. A model in which species and site was treated as a random effect and temperature and Julian date influenced detection probability had the most support. Detection probability was low across species (mean ¼ 0.06, 95% CI ¼ 0.01–0.16); however, variation did exist among species (Fig. 3). Detection probability for Fowler’s Toads and Southern Leopard Frogs increased significantly with increasing temperature, but detection of the remaining nine species was not affected by temperature. Detection of Fowler’s Toads, Southern Leopard Frogs, and Spring Peepers was significantly higher during the earlier part of the sampling period. For all 11 species, all models evaluating occupancy were constructed with detection probability set as a function of Julian date, temperature, and site and species random effects. Five of the occupancy models constructed contained a site-specific covariate (% forest cover at 1 km, 2 km, 4 km, and within the watershed and land cover category), and another modeled occupancy without any covariates. Because these covariates were highly correlated (minimum r ¼ 0.97), we did not evaluate model structures with more than one covariate. The model that best fit the data was one in which occupancy varied among species only, but not as a function of any land cover covariates. The next best model was one in which occupancy varied as a function of % forest within the watershed; however, this model was not strongly competitive (DDIC ¼ 6.3). In all models with either % forest cover or land cover category as a covariate, 95% CI for slope coefficients overlapped zero, leading us to conclude these variables did not offer a significant predictor of occupancy states. Four of the 11 species we evaluated did not appear to have sufficient information to evaluate posterior parameters, as their 95% CI for occupancy probability nearly covered a range from 0 to 1, which was identical to our vague prior (Fig. 3). DISCUSSION While some anuran species appear to be sensitive to urbanization, in the stream and riparian habitats we sampled in western Georgia, those species only went undetected in
574
the most heavily urbanized sites. In fact, in the three rapidly developing survey sites, we detected the highest species richness and had increased detections overall. Given the low number of total sites sampled in each land cover category (n ¼ 3), it is entirely possible that the high species richness in developing sites is simply a function of chance. Nevertheless, there are reasons to suspect that our findings have a mechanistic basis. First, in developing habitats land cover is being changed rapidly by housing development, but those changes were fairly recent at the time of sampling. It is plausible that the undeveloped land immediately surrounding stream systems offered some of the best breeding habitat in an otherwise developed landscape. It is also possible that breeding habitats were poor; however, males were in the area because loss of upland forest forced them into undeveloped riparian corridors for feeding or shelter. Regardless of the cause, any of these mechanisms would have increased opportunities for detection by our near-stream sampling approach. Nevertheless, the benefits of escaping recent development may be short-lived, as Gagn´e and Fahrig (2010) showed that time since development of a watershed is negatively correlated with anuran abundance for most species they assessed. Evolutionary history may provide an additional explanation for the high anuran species richness we found in developing sites. Specifically, our developing sites maintain some habitat features of our forested sites (i.e., narrow stream channels and forested riparian areas) but also have slightly altered hydrological patterns, which cause stream channelization and some areas of deeper, slow-flow water (Barrett et al., 2010a). These habitats may favor small hylids such as Spring Peepers and Upland Chorus Frogs but also provide habitat suitable for larger ranids that would normally breed in streams impounded by beaver dams or in other, more permanent, water bodies (Metts et al., 2001). For those species that are sensitive to urban development, it is important to understand the spatial scale of development to which the species are responding (Simon et al., 2009). In general, we found that the largest buffer sizes offered greatest correlations with observed measures of frog richness, diversity, and activity. This finding is consistent with those of Willson and Dorcas (2003) who used a similar analytical approach to investigate the effects of land cover on salamanders in the Piedmont of North Carolina. In contrast to these findings, a study on landscape-scale drivers of species richness that included several anurans noted stronger predictive power of land cover at scales of approximately 500 m (Simon et al., 2009). Anurans tend to be more vagile than caudates (Semlitsch and Bodie, 2003; Crawford and Semlitsch, 2007). Such increased capacity for movemnt may help decrease the sensitivity of anurans to urban development if species can more easily locate suitable sites within an unsuitable matrix. Alternatively, there is some evidence that highly vagile species such as Northern Leopard Frogs (Lithobates pipiens) have lower site occupancy probabilities as a result of their increased encounters with vehicular traffic (Carr and Fahrig, 2001). These studies and others detailing amphibian responses to land cover change (Price et al., 2006; Barrett et al., 2010a; Canessa and Parris, 2013; Barrett and Price, 2014) help to further articulate the importance of understanding species sensitivities and scale of inference for specific stressors before embarking on anuran sampling and monitoring efforts. Detection rate at sites with known presence varied greatly. The two species with the highest average detection rate were
Copeia 104, No. 2, 2016
generally detected at all sites at some point during the study. Specifically, Fowler’s Toads and Green Frogs were each detected at eight of the nine sites (both went undetected from forested site BLN). At our sample streams, these species and the other nine evaluated within an occupancy framework did not offer strong indicators of stream assemblage change with urbanization. Results from the occupancy analysis indicated models with a measure of development had little support relative to a model where occupancy simply varied among sites. In Barrett and Guyer (2008), Fowler’s Toads were found more frequently at the same urban sites that were surveyed in this study. In contrast, Green Frogs were detected rarely at the three urban sites but were quite common at the developing and forested sites. Interestingly, most detections of Green Frogs at urban sites were heard earlier in the breeding season (March–April) than those breeding in other land cover categories. It is possible that this relatively early breeding activity results from increased temperatures in urban habitats (Roetzer et al., 2000; Kaushal et al., 2010); however, given the small sample size present in this study, much more evidence is needed before such a hypothesis can be considered to have strong support. Amphibians have been proposed as indicators of environmental stressors (Welsh and Ollivier, 1998; Welsh and Droege, 2001; Muenz et al., 2003); however, some authors have pointed out the importance of validating the group’s sensitivity to specific stressors (Blaustein, 1994; Kerby et al., 2009). Sufficient evidence exists to indicate many anurans decrease in diversity and/or abundance in ponds surrounded by urban development (Knutson et al., 1999; Rubbo and Kiesecker, 2005; Pillsbury and Miller, 2008). There is far less evidence regarding the composition of anuran assemblages in stream and riparian environments surrounded by urban or suburban development. We detected fewer species and fewer minutes with calling activity in the most developed and the most forested sites, while sites in developing watersheds had relatively higher species richness and percent calling activity. Our data support those who have cautioned against a blanket assumption that amphibians are uniformly sensitive to environmental stressors. In fact, species such as Fowler’s Toads appear to do well even in the most developed watersheds, though larvae are known to have slower initial growth in experimental conditions mimicking urban water quality (Barrett et al., 2010b). While wetlands are undoubtedly the predominant breeding habitat for many (but not all) of the species we detected, we believe this study provides valuable data on some general assemblage-level patterns that can be used to further investigate the importance of stream and riparian habitats to breeding frogs. Urban streams are severely altered in character from the pre-development condition (Paul and Meyer, 2001; Davis et al., 2003); however, in some cases, such alterations can increase regional or beta diversity for amphibians and reptiles by mimicking habitat not normally associated with 2nd- or 3rd-order streams, such as deeper waters with less canopy cover (Barrett and Guyer, 2008). Such habitats may allow for the persistence of some anuran species in urban and suburban environments. On the other hand, long-term urbanization can alter the hydrology and, eventually, the shape of streams in such a way as to disconnect them from riparian habitats (Paul and Meyer, 2001). In cases such as these, small depressions in the riparian corridor may fill less frequently and decrease in suitability for anurans. Additional work is needed to identify exactly where the anuran species we detected are breeding. Research that
Barrett et al.—Frog response to urbanization
quantifies population size and growth would also provide key insights beyond those offered in this preliminary study. ACKNOWLEDGMENTS We would like to thank R. Applegate, C. Smith, and A. Muller for assisting with data collection, and W. Sutton and J. Crawford for improving a previous version of the manuscript. The Center for Forest Sustainability provided generous funding to support K. Barrett on a research assistantship and provided for the purchase of the automatic recording systems. LITERATURE CITED Acevedo, M. A., and L. J. Villanueva-Rivera. 2006. Using automated digital recording systems as effective tools for the monitoring of birds and amphibians. Wildlife Society Bulletin 34:211–214. Alig, R. J., J. D. Kline, and M. Lichtenstein. 2004. Urbanization on the US landscape: looking ahead in the 21st century. Landscape and Urban Planning 69:219–234. Barrett, K., and C. Guyer. 2008. Differential responses of amphibians and reptiles in riparian and stream habitats to land use disturbances in western georgia, USA. Biological Conservation 141:2290–2300. Barrett, K., C. Guyer, and D. Watson. 2010b. Water from urban streams slows growth and speeds metamorphosis in Fowler’s toad (Bufo fowleri) larvae. Journal of Herpetology 44:297–300. Barrett, K., B. S. Helms, C. Guyer, and J. E. Schoonover. 2010a. Linking process to pattern: causes of streambreeding amphibian decline in urbanized watersheds. Biological Conservation 143:1998–2005. Barrett, K., and S. J. Price. 2014. Urbanization and stream salamanders: a review, conservation options, and research needs. Freshwater Science 33:927–940. Blaustein, A. R. 1994. Chicken Little or Nero’s fiddle? A perspective on declining amphibian populations. Herpetologica 50:85–97. Bridges, A. S., and M. E. Dorcas. 2000. Temporal variation in anuran calling behavior: implications for surveys and monitoring programs. Copeia 2000:587–592. Burcher, C. L., H. M. Valett, and E. F. Benfield. 2007. The land-cover cascade: relationships coupling land and water. Ecology 88:228–242. Canessa, S., and K. M. Parris. 2013. Multi-scale, direct and indirect effects of the urban stream syndrome on amphibian communities in streams. PLOS ONE 8:e70262. Carr, L. W., and L. Fahrig. 2001. Effect of road traffic on two amphibian species of differing vagility. Conservation Biology 15:1071–1078. Chao, A., N. J. Gotelli, T. C. Hsieh, E. L. Sander, K. H. Ma, R. K. Colwell, and A. M. Ellison. 2014. Rarefaction and extrapolation with Hill numbers: a framework for sampling and estimation in species diversity studies. Ecological Monographs 84:45–67. Crawford, J. A., and R. D. Semlitsch. 2007. Estimation of core terrestrial habitat for stream-breeding salamanders and delineation of riparian buffers for protection of biodiversity. Conservation Biology 21:152–158. Davis, N. M., V. Weaver, K. Parks, and M. J. Lydy. 2003. An assessment of water quality, physical habitat, and biological integrity of an urban stream in wichita, kansas, prior to
575
restoration improvements (Phase I). Archives of Environmental Contamination and Toxicology 44:351–359. Dorcas, M. E., S. J. Price, S. C. Walls, and W. J. Barichivich. 2009. Auditory monitoring of anuran populations, p. 278– 292. In: Amphibian Ecology and Conservation—A Handbook of Techniques. C. K. Dodd (ed.). Oxford University Press, U.K. Gagn´e, S. A., and L. Fahrig. 2007. Effect of landscape context on anuran communities in breeding ponds in the National Capital Region, Canada. Landscape Ecology 22: 205–215. Gagn´e, S. A., and L. Fahrig. 2010. Effects of time since urbanization on anuran community composition in remnant urban ponds. Environmental Conservation 37: 128–135. Gelman, A., and J. Hill. 2007. Data Analysis Using Regression and Multilevel/hierarchical Models. Cambridge University Press, New York. Gerhardt, H. C. 1975. Sound pressure levels and radiation patterns of the vocalizations of some North American frogs and toads. Journal of Comparative Physiology A: Neuroethology, Sensory, Neural, and Behavioral Physiology 102: 1–12. Gibbs, J. P. 1998. Distribution of woodland amphibians along a forest fragmentation gradient. Landscape Ecology 13:263–268. Hamer, A. J., and M. J. McDonnell. 2008. Amphibian ecology and conservation in the urbanising world: a review. Biological Conservation 141:2432–2449. Hamer, A. J., and M. J. McDonnell. 2010. The response of herpetofauna to urbanization: inferring patterns of persistence from wildlife databases. Austral Ecology 35:568–580. Helms, B. S., J. W. Feminella, and S. Pan. 2005. Detection of biotic responses to urbanization using fish assemblages from small streams of western Georgia, USA. Urban Ecosystems 8:23–38. Hsieh, T. C., K. H. Ma, and A. Chao. 2015. iNEXT online: interpolation and extrapolation (Version 1.3.0). https:// github.com/JohnsonHsieh/iNEXT. Accessed: 2015-06-04. Kaushal, S. S., G. E. Likens, N. A. Jaworski, M. L. Pace, A. M. Sides, D. Seekell, K. T. Belt, D. H. Secor, and R. L. Wingate. 2010. Rising stream and river temperatures in the united states. Frontiers in Ecology and the Environment 8:461–466. Kerby, J., K. Richards-Hrdlicka, A. Storfer, and D. Skelly. 2009. An examination of amphibian sensitivity to environmental contaminants: Are amphibians poor canaries? Ecology Letters 13:60–67. Knutson, M. G., J. R. Sauer, D. A. Olsen, M. J. Mossman, L. M. Hemesath, and M. J. Lannoo. 1999. Effects of landscape composition and wetland fragmentation on frog and toad abundance and species richness in Iowa and Wisconsin, USA. Conservation Biology 13:1437–1446. Lockaby, B., D. Zhang, J. McDaniel, H. Tian, and S. Pan. 2005. Interdisciplinary research at the urban-rural interface: the west GA project. Urban Ecosystems 8:7–21. McKinney, M. L. 2006. Urbanization as a major cause of biotic homogenization. Biological Conservation 127:247– 260. McKinney, M. L. 2008. Effects of urbanization on species richness: a review of plants and animals. Urban Ecosystems 11:161–176. Metts, B. S., J. D. Lanham, and K. R. Russell. 2001. Evaluations of herpetofaunal communities on upland streams and beaver-impounded streams in the upper
576
piedmont of South Carolina. American Midland Naturalist 145:54–65. Muenz, T. K., S. W. Golladay, G. Vellidis, and L. L. Smith. 2003. Stream macroinvertebrates and amphibians as indicators of ecosystem stress: a case study from the coastal plain, GA. In: Proceedings of the 2003 Georgia Water Resources Conference. Institute of Ecology, The University of Gerogia, Athens, Georgia. Parris, K. M. 2006. Urban amphibian assemblages as metacommunities. Journal of Animal Ecology 75:757–764. Paul, M. J., and J. L. Meyer. 2001. Streams in the urban landscape. Annual Review of Ecology and Systematics 32: 333–365. Pillsbury, F. C., and J. R. Miller. 2008. Habitat and landscape characteristics underlying anuran community structure along an urban-rural gradient. Ecological Applications 18: 1107–1118. Plummer, M. 2003. JAGS: a program for analysis of Bayesian graphical models using Gibbs sampling. Proceedings of the third International Workshop on Distributed Statistical Computing (DSC 2003). March 20–22, Vienna, Austria. Plummer, M. 2011. rjags: Bayesian graphical models using MCMC. R package version 4–4. https://cran.r-project.org/ web/packages/rjags/ Price, S. J., M. E. Dorcas, A. L. Gallant, R. W. Klaver, and J. D. Willson. 2006. Three decades of urbanization: estimating the impact of land-cover change on stream salamander populations. Biological Conservation 133:436–441. R Core Team. 2015. R: A language and environment for statistical computing. R Foundation for Statistical Computing. Vienna, Austria. https://www.R-project.org Roetzer, T., M. Wittenzeller, H. Haeckel, and J. Nekovar. 2000. Phenology in central Europe—differences and trends of spring phenophases in urban and rural areas. International Journal of Biometeorology 44:60–66. Rubbo, M. J., and J. M. Kiesecker. 2005. Amphibian breeding distribution in an urbanized landscape. Conservation Biology 19:504–511. Semlitsch, R. D., and J. R. Bodie. 2003. Biological criteria for buffer zones around wetlands and riparian habitats for
Copeia 104, No. 2, 2016
amphibians and reptiles. Conservation Biology 17:1219– 1228. Simon, J. A., J. W. Snodgrass, R. E. Casey, and D. W. Sparling. 2009. Spatial correlates of amphibian use of constructed wetlands in an urban landscape. Landscape Ecology 24:361–373. Spiegelhalter, D. J., N. G. Best, B. P. Carlin, and A. van der Linde. 2002. Bayesian measures of model complexity and fit. Journal of the Royal Statistical Society B 36:44–47. Steen, D. A., C. J. W. McClure, and S. P. Graham. 2013. Relative influence of weather and season on anuran calling activity. Canadian Journal of Zoology 91:462–467. Walsh, C. J., A. H. Roy, J. W. Feminella, P. D. Cottingham, P. M. Groffman, and R. P. Morgan. 2005. The urban stream syndrome: current knowledge and the search for a cure. Journal of the North American Benthological Society 24:706–723. Weir, L. A., and M. J. Mossman. 2005. North American Amphibian Monitoring Program (NAAMP), p. 30–313. In: Amphibian Declines: Conservation Status of United States Amphibians. M. Lannoo (ed.). University of California Press, Berkeley. Welsh, H. H., and S. Droege. 2001. A case for using plethodontid salamanders for monitoring biodiversity and ecosystem integrity of north american forests. Conservation Biology 15:558–569. Welsh, H. H., and L. M. Ollivier. 1998. Stream amphibians as indicators of ecosystem stress: a case study from California’s redwoods. Ecological Applications 8:1118– 1132. Willson, J. D., and M. E. Dorcas. 2003. Effects of habitat disturbance on stream salamanders: implications for buffer zones and watershed management. Conservation Biology 17:763–771. Zipkin, E. F., J. A. Royle, D. K. Dawson, and S. Bates. 2010. Multi-species occurrence models to evaluate the effects of conservation and management actions. Biological Conservation 143:479–484.