PRL 96, 033003 (2006)
PHYSICAL REVIEW LETTERS
week ending 27 JANUARY 2006
Systematic Study of the 87 Sr Clock Transition in an Optical Lattice Andrew D. Ludlow, Martin M. Boyd, Tanya Zelevinsky, Seth M. Foreman, Sebastian Blatt, Mark Notcutt, Tetsuya Ido, and Jun Ye JILA and Department of Physics, National Institute of Standards and Technology and University of Colorado, Boulder, Colorado 80309-0440, USA (Received 5 August 2005; revised manuscript received 12 January 2006; published 26 January 2006) With ultracold 87 Sr confined in a magic wavelength optical lattice, we present the most precise study (2.8 Hz statistical uncertainty) to date of the 1 S0 -3 P0 optical clock transition with a detailed analysis of systematic shifts (19 Hz uncertainty) in the absolute frequency measurement of 429 228 004 229 869 Hz. The high resolution permits an investigation of the optical lattice motional sideband structure. The local oscillator for this optical atomic clock is a stable diode laser with its hertz-level linewidth characterized by an octave-spanning femtosecond frequency comb. DOI: 10.1103/PhysRevLett.96.033003
PACS numbers: 32.80.Qk, 42.62.Eh, 42.62.Fi
Recently, optical atomic clocks have become increasingly competitive in performance with their microwave counterparts. The overall accuracy of single trapped ion based optical standards closely approaches that of the state-of-the-art cesium fountain standards [1,2]. Large ensembles of ultracold alkaline earth atoms have provided impressive clock stability for short averaging times, surpassing that of single-ion based systems. So far, interrogation of neutral atom based optical standards has been carried out primarily in free space, unavoidably including atomic motional effects that typically limit the overall system accuracy [3–5]. An alternative approach is to explore the ultranarrow optical transitions of atoms held in an optical lattice [6 –8]. The atoms are tightly localized so that Doppler and photon-recoil related effects on the transition frequency are eliminated [9]. Meanwhile, the trapping potential is created by laser light at a carefully chosen wavelength (�magic ) such that it has essentially no effect on the internal clock transition frequency. The increased atom-probe laser interaction time enabled by the lattice confinement permits a full utilization of the narrow natural linewidth. This optical lattice approach using neutral atoms may provide the best possible combination of clock stability and accuracy. Such a proposal has been under intensive investigation in the case of the doubly forbidden 1 S0 -3 P0 transition in the fermionic Sr isotope, 87 Sr [6,10]. Similar work in Yb is also in progress [11,12]. The first high precision absolute frequency measurement was recently reported for the 87 Sr 1 S0 -3 P0 clock transition using a global positioning system (GPS)-based frequency reference [6]. However, establishing a new standard demands that different groups study potential systematic errors. In this Letter, we present the most precise study to date of this ultranarrow clock transition in a magic wavelength optical lattice, with a direct reference to the NIST F1 Cs fountain clock. We have investigated systematic frequency shifts arising from atomic density, wavelength and intensity of the optical lattice, residual 0031-9007=06=96(3)=033003(4)$23.00
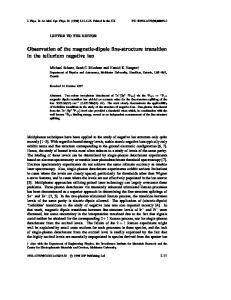
magnetic field, and probing laser intensity. We determined the absolute frequency of the 87 Sr clock transition to be �429 228 004 229 869 � 19�sys� � 2:8�stat�� Hz. We also apply this optical clock resolution towards a study of ultracold atomic motion in an anharmonic optical potential. To exploit the long coherence time provided by the ultranarrow 1 S0 -3 P0 clock transition (linewidth � � 10 mHz [7,8]), we have developed a cavity stabilized diode laser at 698 nm. The laser is locked to an isolated, passive reference cavity with finesse of �250 000 and cavity linewidth of �20 kHz. This reference cavity is mounted vertically and supported symmetrically to minimize the length sensitivity to environmental vibrations [13]. To characterize this laser, we compare it to a highly stabilized Nd:YAG cw laser which has consistently demonstrated a sub-Hz linewidth. This comparison was made possible with a stabilized femtosecond frequency comb [14]. The repetition rate (100 MHz) of the octave spanning, self-referenced Ti:Sapphire fs comb was tightly phase locked to the cavity stabilized 698 nm diode laser, coherently transferring the diode laser stability to each of the �106 modes of the fs frequency comb. A heterodyne beat signal between the sub-Hz Nd:YAG reference laser and a corresponding fs comb mode at 1064 nm, shown in Fig. 1, revealed a linewidth of less than 5 Hz for the 698 nm diode laser and demonstrates optical coherence transfer at the 10�14 level between remotely located lasers of different colors. Additionally, the final stability of the 698 nm laser system was confirmed to be limited by thermal-mechanical noise of the mirror substrates in the Zerodur reference cavity [15] and will be improved with new mirrors. The frequency drift caused by the material creep of the cavity spacer was carefully compensated via measurement of the optical frequency relative to a Cs fountain-calibrated hydrogen maser using the same fs comb. Preceding the 1 S0 -3 P0 spectroscopy, 87 Sr atoms undergo 600 ms of two-stage laser cooling (using the 1 S0 -1 P1 and then the 1 S0 -3 P1 transitions—see Fig. 2) to prepare >105
033003-1
© 2006 The American Physical Society
PHYSICAL REVIEW LETTERS
Reference cavity 1
18 m noise-cancelled fiber
Beat width: 3 Hz 20 Hz
Sr laser 698 nm
Power [dB]
-10
Reference cavity 2
Femtosecond comb heterodyne beat
Reference laser 1064 nm
Linear scale (a.u.)
PRL 96, 033003 (2006)
1146
-20 698
813
-30 573
1064
-40
600
800
1000
1200
Wavelength [nm]
20 m noise-cancelled fiber
FIG. 1 (color online). Measurement of probe laser (698 nm) linewidth by comparison to a reference laser at 1064 nm using an octave spanning (573–1146 nm) fs laser. Linewidth of the heterodyne beat at 1064 nm is 3 Hz.
atoms at �K temperatures [16 –18]. Loading of atoms from the magneto-optic trap (MOT) to a 1D optical lattice operating at �magic 813 nm allows simultaneous cooling and trapping on the 1 S0 -3 P1 transition so that spatial mode matching between the MOT and lattice is not critical. Ten percent of the atoms (>104 ) are loaded from the red MOT to the lattice, which has a lifetime of 1 s. Inside the lattice, the axial trap oscillation frequency is � 2� � 80 kHz, corresponding to a Lamb-Dicke pap�������������������� rameter of � kp @=�2m�� 0:23. Here kp 2�=�p , �p is the probe wavelength, 2�@ is Planck’s constant, and m is the atomic mass. In this regime, spectroscopy of the clock transition can be performed nearly free of any Doppler or photon-recoil shifts. To avoid residual transverse Doppler effects (transverse oscillation frequency is 220 Hz), the probing laser is aligned nearly vertically to
PMT
813 nm
gravity
P DM
698 nm 3S
1P
1
461 nm (32 MHz) 1S 0
679 nm 1 (1.4 MHz) 689 nm (7.5 kHz)
3P 3P 3P
2 1
/2
E
0
698 nm Clock transition ( 10 mHz)
698 nm
lattice
FIG. 2 (color online). Partial diagram of 87 Sr energy levels and the schematic of the optical layout delivering the probe and lattice laser to the atoms. P: polarizer, DM: dichroic mirror, PMT: photo-multiplier tube. The strong longitudinal and weak transverse confinement of the 1D lattice creates 2D trapping regions. The lattice and probe lasers share an identical polarization. Branching ratios from the 3 S1 to the 3 P states are 5=9�J
2�, 3=9�J 1�, and 1=9�J 0�.
week ending 27 JANUARY 2006
copropagate with the lattice laser (within 5 mrad, Fig. 2), with both lasers focused to a �65 �m beam radius at the trap. The probing laser is operated with optical powers near 5 nW. Spectroscopy typically consists of a probing time of 10 – 40 ms followed by a 2 ms illumination of the atoms by 679 nm light, which pumps the excited state 3 P0 population to the 3 S1 state for shelving to 3 P2 (Fig. 2). Because of spatial inhomogeneity in the Rabi excitation frequency, we repeat the iteration of probe and pump pulses multiple times to enhance the signal size. Finally, we detect the ground state 1 S0 population by exciting the strong 1 S0 -1 P1 transition and counting fluorescence. The resolution of lattice spectroscopy enables us to investigate the longitudinal motional states of the 1D lattice. A deep lattice potential (where the populated motional quantum states are well below the energy barrier between adjacent sites) can be well approximated by harmonic confinement leading to equally spaced motional states. These motional states allow inelastic excitations which are red and blue detuned from the elastic, purely electronic 1 S0 -3 P0 excitation, with amplitudes suppressed by �2 =4 in the Lamb-Dicke regime. A measure of the amplitudes of the red and blue sidebands directly gives the relative population of the ground and first excited motional state in 1 S0 and thus the atomic ensemble temperature [19,20]. As shown in Fig. 3(a), this yields an atomic temperature of 5 �K, in good agreement with time of flight temperature measurements. Since the lattice trap depth is only �20 �K, the harmonic approximation deteriorates for excited motional states (n 1, where n is the motional quantum number). Hence, the energy spacing decreases with increasing n, spreading the inelastic sidebands into the individual n ! n 1 transitions. This anharmonic spreading partly explains the broad sidebands shown in Fig. 3(a). By knowing the trap depth, we solve for the exact eigenenergies of the cos2 �kz� dependent longitudinal lattice potential [21], where k is the lattice wave vector. The resulting eigenenergies, in units of lattice photon-recoil energy, are shown in Fig. 3(b) as the lattice band structure. Knowing the relative frequency of each n ! n 1 transition, we fit the blue sideband of Fig. 3(a) with multiple Lorentzians to yield the amplitudes (assumed to be Boltzmann-distributed) and the widths of these transitions. The relative amplitudes among the various n ! n 1 blue sidebands offer a more accurate measure of the atomic population of various longitudinal motional states and hence the sample temperature. This result, also 5 �K, is consistent with measurements based on the relative blue and red sideband amplitudes. The individual n ! n 1 transition linewidths are very broad compared to the elastic n ! n carrier transition. Although some intrinsic broadening is introduced by the band structure of the motional eigenstates (<1 Hz for lower states, � kHz for upper states), major linewidth contributions arise from radial variations of � and in small part from externally induced dissipations among motional states. Possible external dis-
033003-2
PHYSICAL REVIEW LETTERS
PRL 96, 033003 (2006)
Lattice Band Structure
4000
160
3000
2000
Red SB
Ω/2π ~ 80 kHz
Carrier 1000
(a)
E/Erecoil @ 813 nm
Photon counts
Blue SB
Background counts
0 -120
-80
-40
0
40
80
120
140
Etrap ~20 µK
120 100
(b)
80
3 2 1 0
60 40 20 0
(n)
698nm probe frequency (kHz)
Signal amplitude (a.u.)
Data Multiple Lorentzian fit Decomposed fit
(c)
1
2800
2
0
1
Photon counts
2400
2000 1600 Linewidth:
200 (30) Hz 1200
0.6 n
0.7 0.8 0.9 1.0 1.1 n + 1 transition frequency 1 ) (normalized against 0
(d)
-0.9 -0.6 -0.3 0.0 0.3 0.6
698 nm probe frequency (kHz)
FIG. 3 (color online). (a) Spectroscopic trace of saturated, elastic 1 S0 -3 P0 electronic transition and the inelastic motional sidebands at 80 kHz detuning from the center transition. (b) Lattice band structure derived from exact solution of cos2 �kz� dependent longitudinal lattice potential. (c) Fit to the blue sideband of (a) where the sideband is composed of multiple n ! n 1 transitions. Here the trap depth is �20 �K while the atomic sample temperature is 5 �K. The short vertical bars (blue online) denote the position of each n ! n 1 transition from (b). (d) Narrow 1 S0 -3 P0 elastic carrier spectrum. Typical scan time for each spectrum is �100 s.
sipation includes motional transitions induced by lattice phase and intensity noise, two-body atomic collisions, and blackbody radiation. Spectroscopy of the 1 S0 -3 P0 elastic carrier transition of 87 Sr in an optical lattice has the potential to yield one of the highest optical resolutions ever measured [22]. A number of potential relaxation mechanisms can limit the achievable coherence time. A narrow spectrum of the carrier transition is shown in Fig. 3(d). The � 200 Hz full width at half maximum linewidth allows for relatively rapid averaging of multiple spectra to achieve statistical uncertainties of the transition frequency below the 10 Hz level (individual spectra exhibit 20 Hz transition frequency uncertainties), limited by the stability of the hydrogen maser used for frequency counting. Our efforts to reduce the broadening mechanisms were made in several different areas. To eliminate linewidth broadening (�100 Hz) of the fiber-optic-transferred probe laser caused by optical path phase noise, we implemented noise cancellation to sub-Hz precision over the optical path up to the retroreflecting lattice mirror [23]. Lack of perfect overlap between the probe and lattice lasers can introduce Doppler broadening along the weakly confined transverse axes of the 1D lattice. For this reason, we ensured that the well
week ending 27 JANUARY 2006
overlapped lattice and probe lasers had strong back coupling into both fibers from the retroreflecting lattice mirror. Additionally, the finite size of the probe beam creates a Heisenberg limited spread of k~p which samples some of the transverse motion. This effect is below 50 Hz. In future work, these broadening mechanisms will be circumvented by implementation of a 3D optical lattice. State preparation of the atomic population in ground state mF sublevels was not attempted, making inhomogeneous Zeeman broadening possible because of the differential shift of �100 Hz=G � mF between 1 S0 and 3 P0 states due to the latter’s hyperfine mixing [24]. We used Helmholtz coil pairs to minimize residual magnetic fields. If not operated at �magic , the lattice laser can introduce large inhomogeneous ac Stark broadening. By varying the lattice power and wavelength around �magic , we ensured linewidth contributions were below 30 Hz. Also, dissipation processes can cause some broadening in the elastic n ! n transition. To date, we have not observed any effect of atomic density in the lattice on the measured linewidth. Figure 4 summarizes the measurement of the 1 S0 -3 P0 transition frequency within a three-month period. Limited by a final statistical uncertainty of 2.8 Hz, we have performed a detailed study of systematic shifts and their corresponding uncertainties (Table I). The most basic systematic error associated with spectroscopy in an optical lattice is the ac Stark shift of the clock transition due to the confining optical potential. To experimentally determine the magnitude and uncertainty of this shift, we varied the lattice intensity around the typical operating value of I0
10 kW=cm2 at wavelengths below, above, and near �magic . At our typical operating wavelength of 813.437 nm, Fig. 4(a) shows the frequency shift as a function of intensity. The slope of this shift yields an overall correction of �17�8:3� Hz at the typical lattice intensity of I0 . We have also found that at I0 , the induced frequency shift is 90 Hz for a lattice frequency deviation of 0.1 nm from the magic wavelength (2 mHz clock shift/1 MHz lattice deviation). Combining this with the measured lattice ac Stark shift of 17 Hz at 813.437 nm yields �magic 813:418�10� nm, in agreement with Ref. [6]. With potentially high atomic densities in an optical lattice, characterization of density shifts is important. We have �80 lattice sites with typically �140 atoms per site, yielding densities of �2 � 1011 atoms=cm3 . Varying the atomic density by a factor of 50 [Fig. 4(b)], we find the density shift at our typical operating density of 2 � 1011 atoms=cm3 to be 2(12) Hz. Asymmetric population distributions among 1 S0 ground state mF sublevels can lead to Zeeman shifts of the transition frequency. We measured a shift of 32 Hz=G [Fig. 4(c)]. By keeping the magnetic field <400 mG during spectroscopy, the Zeeman shift uncertainty is 12 Hz. The probe beam itself can induce a frequency shift through two different physical mechanisms. The first is the ac Stark shift of the 1 S0 and 3 P0 levels due to their couplings to other states by the probe
033003-3
PHYSICAL REVIEW LETTERS
-10 -20 -30
νsr - 429228004229900 [Hz]
-40
0.2
0.4
0.6
0.8
1.0
1.2
Density shift 11 -3 1 (6) Hz / (10 cm )
150 100 50 0 -50
-100
(a)
0.0
νsr - 429228004229900 [Hz]
Lattice Stark shift: 17(8) Hz/I0
0
(b)
4x10
9
Magnetic Shift -32(7) Hz / G
200 100 0
-100 -200
(c) -4 -3 -2 -1 0
1
2
10
10
11
4x10
11
Atomic Density [atoms/cm ]
400 300
10
3
Lattice Intensity [I/I0]
3
4
Axial Magnetic Field [G]
νsr - 429228004229900 [Hz]
νsr - 429228004229900 [Hz]
PRL 96, 033003 (2006)
80 Ref. [6] 60 40 20 0 This work -20 -40 -60 (d) 5/3 5/17 5/31 6/14 6/28 7/12 7/26 Date (2005)
FIG. 4 (color online). The measured 1 S0 -3 P0 transition frequency versus (a) lattice intensity (I0 10 kW=cm2 ), (b) atomic density, and (c) magnetic field. (d) JILA measurements over a 3 month period, with each data point representing an averaged daily frequency measurement. The results reported in this work (lower bars) and in Ref. [6] (upper bars) are both shown with the total (outer box) and statistical (inner shaded area) errors.
laser. For our investigation, the ac Stark shift due to the probe laser was exacerbated by using an electro-optic (EO) modulator to probe the atoms with a weak sideband while retaining an off resonant carrier for use in our fiber noise cancellation. The second frequency shift mechanism arises from a residual probe beam misalignment with respect to the lattice laser, permitting photon-recoil shifts in the transverse direction of the lattice. We separated these power-dependent effects by either varying the total 698 nm light intensity incident on the atoms or changing the relative carrier-sideband amplitude via the EO modulation index. We determined each of these effects within 2 Hz uncertainty. The frequency reference used for the optical measurement was a hydrogen maser directly calibrated by the NIST F1 Cs fountain clock, transferred by an optical fiber link from NIST to JILA [25]. This is critical for the systematic
TABLE I. Typical systematic corrections and their uncertainties for the absolute frequency of the 1 S0 -3 P0 clock transition. Contributor ac Stark shift (lattice) ac Stark shift (probe) Blackbody shift Zeeman shift Recoil/Doppler shift Density shift Gravitational shift Cs-maser calibration Systematic total
Correction (Hz)
Uncertainty (Hz)
�17 7.0 2.2 0 0 �2:0 0.66 46.8
8.3 0.9 0.05 12 1.9 12 0.14 0.5
38
19
week ending 27 JANUARY 2006
evaluation of the Sr clock. The approximate 14 m lower elevation of our JILA Sr experiment relative to the NIST fountain clock introduced <1 Hz gravitational shift. Including all systematic effects discussed above, the total uncertainty (added in quadrature) is 19 Hz. The final number we report for the 87 Sr 1 S0 -3 P0 transition frequency is �429 228 004 229 869 � 19�sys� � 2:8�stat�� Hz. Comparing to Ref. [6], the statistical uncertainty of our frequency measurement is �3 times smaller and our final frequency value disagrees by 3 standard deviations. Work in [6] used a reference based on GPS (instability � 10�10 at 1 s averaging time). We have presented the most precise spectroscopic measurement of the 87 Sr 1 S0 -3 P0 transition frequency in an optical lattice with extensive studies of systematic uncertainties. We apply this high resolution spectroscopy to investigating motional properties of lattice trapped Sr atoms. This work demonstrates the strength of the system for an optical atomic clock. Future work will improve further upon the reported precision and accuracy. We thank J. Hall, T. Loftus, C. Greene, and M. Holland for helpful interactions and S. Diddams, T. Parker, and L. Hollberg for the maser signal transfer. This work is funded by ONR, NSF, NASA, and NIST.
[1] S. A. Diddams et al., Science 306, 1318 (2004). [2] H. S. Margolis et al., Science 306, 1355 (2004). [3] C. W. Oates, E. A. Curtis, and L. Hollberg, Opt. Lett. 25, 1603 (2000). [4] U. Sterr et al., C.R. Physique 5, 845 (2004). [5] T. Ido et al., Phys. Rev. Lett. 94, 153001 (2005). [6] M. Takamoto et al., Nature (London) 435, 321 (2005). [7] S. G. Porsev and A. Derevianko, Phys. Rev. A 69, 042506 (2004). [8] R. Santra et al., Phys. Rev. A 69, 042510 (2004). [9] T. Ido and H. Katori, Phys. Rev. Lett. 91, 053001 (2003). [10] I. Courtillot et al., Phys. Rev. A 68, 030501(R) (2003). [11] T. Hong et al., physics/0504216. [12] C. W. Hoyt et al., Phys. Rev. Lett. 95, 083003 (2005). [13] M. Notcutt et al., Opt. Lett. 30, 1815 (2005). [14] T. Fortier et al., Opt. Lett. 28, 2198 (2003). [15] M. Notcutt et al. (to be published). [16] T. H. Loftus et al., Phys. Rev. Lett. 93, 073003 (2004); Phys. Rev. A 70, 063413 (2004). [17] T. Mukaiyama et al., Phys. Rev. Lett. 90, 113002 (2003). [18] X. Xu et al., Phys. Rev. Lett. 90, 193002 (2003). [19] D. J. Wineland and W. M. Itano, Phys. Rev. A 20, 1521 (1979). [20] J. C. Bergquist, W. M. Itano, and D. J. Wineland, Phys. Rev. A 36, 428 (1987). [21] R. Ja´uregui et al., Phys. Rev. A 64, 033403 (2001). [22] R. J. Rafac et al., Phys. Rev. Lett. 85, 2462 (2000). [23] L. S. Ma et al., Opt. Lett. 19, 1777 (1994). [24] E. Peik, G. Hollemann, and H. Walther, Phys. Rev. A 49, 402 (1994). [25] J. Ye et al., J. Opt. Soc. Am. B 20, 1459 (2003).
033003-4