The Academic Achievement Gap in Grades 3 to 8
Charles T. Clotfelter*, Helen F. Ladd, and Jacob L. Vigdor Duke University May 1, 2006
Abstract Using data for North Carolina public school students in grades 3 to 8, we examine achievement gaps between white students and students from other racial and ethnic groups. We focus on successive cohorts of students who stay in the state’s public schools for all six years, and study both differences in means and in quantiles. Our results on achievement gaps between black and white students are consistent with those from other longitudinal studies: the gaps are sizable, are robust to controls for measures of socioeconomic status, and show no monotonic trend between 3rd and 8th grade. In contrast, both Hispanic and Asian students tend to gain on whites as they progress through these grades. Looking beyond simple mean differences, we find that the racial gaps between low-performing students have tended to shrink as students progress through school, while racial gaps between high-performing students have widened. Racial gaps differ widely across geographic areas within the state; very few of the districts or groups of districts that we examined have managed simultaneously to close the black-white gap and raise the relative test scores of black students.
JEL classifications: I21, J15
*Corresponding author: On leave, Russell Sage Foundation, 112 E. 64th Street, New York, NY 10021;
[email protected]; phone 212-755-4736. The authors wish to thank Robert Malme, Leona Christy, Aaron Hedland, and Marco Hernandez for excellent research assistance, David Aman for useful information on test administration in North Carolina, Frank Levy for helpful suggestions, workshop participants at the Russell Sage Foundation, the New School, CUNY, Amherst, Columbia, and NYU for valuable comments, and the Spencer Foundation for financial support. R:\teachq\papers\achgapdraft50106.wpd
The Academic Achievement Gap in Grades 3 to 8 Charles T. Clotfelter, Helen F. Ladd, and Jacob L. Vigdor Duke University
I. Introduction No topic goes to the heart of American concerns about equity in K-12 education more than the racial achievement gap. In 2004 Secretary of Education Rod Paige (2004) stated: “The academic achievement gap is the major driver of racial inequity in this country”; commentators across the political spectrum have expressed alarm over its size and consequences.1 The racial gap itself has been a major impetus for federal education policy as embodied in the No Child Left Behind Act of 2001, and has entered into countless state and local debates regarding school finance equalization, academic tracking, and school testing and accountability programs. Ever since the Coleman Report in 1966, researchers have known that average achievement test scores of black students lag well behind those of white students, but this issue has been taken up with renewed energy in the last decade. Efforts to describe and explain the achievement gap include studies of differences across cohorts (Lee 2002; Perie et al. 2005) and the progress of individual cohorts in the early school years (Fryer and Levitt 2004, 2005; Murnane et al. 2006) or in later years (Hanushek and Rivkin 2006). These studies show a large and persistent gap in achievement test scores between white and black students, but they differ
1
For example, Jencks and Phillips (1998, p.3-4) state, “if racial equality is America’s goal, reducing the black-white test score gap would probably do more to promote this goal than any other strategy that commands broad political support”; Thernstrom and Thernstrom (2003, p. 235) write, “Closing the skills gap is the key to real racial equality in American society.” See also NAAC P Legal Defense and E ducational Fund (2005).
1
regarding the size of the gap at the beginning of school, how much of the gap is explained by socioeconomic status, and whether the gap widens as students advance through school grades. This paper contributes to existing literature by studying racial/ethnic achievement gaps, based on tests that are linked to the state’s standard course of study, exhibited by five consecutive cohorts of North Carolina public school students as they progressed from 3rd to 8th grade. We confirm some findings in existing literature: test-score gaps between black and white students are sizable, even after controlling for rudimentary student covariates. Hispanic and American Indian students also lag behind whites, albeit less dramatically; Asian students often score higher than whites, particularly in later grades. Unlike other studies of which we know, we find that the regression-adjusted mean test scores of minority groups other than blacks rise relative to whites as students age, at least over the range of grades that we observe. The regression-adjusted blackwhite gap in math test scores declines by about 6% between 3rd and 8th grade but increases by about 10% in reading. Looking beyond the mean, we find that the trend towards improved relative minority test scores in math is concentrated at the low end of the distribution. The gap in math scores between disadvantaged minority groups and whites closes rapidly at the 10th percentile as students progress through school, but in most cases actually increases at the 90th percentile. Each of the test score distributions for black, Hispanic, and American Indian students becomes more compressed relative to the white test score distribution over these grades. Evidence suggests that this pattern has become stronger over time. We discuss possible explanations for this phenomenon – in particular, the possibility that predominantly minority schools have
2
redistributed resources toward lower-performing students – but leave hypothesis tests to subsequent work. Finally, we present evidence regarding the variation in achievement gaps exhibited across districts within the State of North Carolina. Our examination of 11 districts or district groups shows that where mean black test scores increased between 3rd and 8th grades, the gap between black and white students tended to increase. That is, we find no clear relationship between the change in the test scores of black students and the size of the black-white gap. Previous research on the racial achievement gap is summarized in section II of the paper. Section III describes our data. Section IV shows the size of racial achievement gaps in North Carolina applying to different groups, before and after adjusting for socioeconomic differences among students. Section V looks beyond mean differences to examine other aspects of achievement distributions. Section VI examines the black-white achievement gap in districts and regions within the state, and section VII concludes the analysis.
II. Previous Research on the Racial Achievement Gap Research studies have examined racial and ethnic gaps in achievement using various groups, but by far the most attention has been paid to the black-white gap. The Black-White Gap Starting in the 1990s researchers used nationally representative samples to document the extent of and change in racial and ethnic gaps in achievement test scores. Several studies examined data from the National Assessment of Educational Progress (NAEP). As summarized by Phillips and Chin (2004, pp. 468-470), this research showed that the black-white gap at the 4th 3
grade narrowed during the 1970s and into the 1980s, after which it stagnated or grew again slightly. As of 2000, this gap was 0.90 of a standard deviation in math and 0.83 in reading, as shown in Table 1. The corresponding gap for 8th graders was more than a full standard deviation (1.06) in math and 0.85 in reading.2 In a pair of studies using the Early Childhood Longitudinal Study (ECLS), Fryer and Levitt (2004, 2005) find a gap of 0.66 in math and 0.40 in reading at the beginning of kindergarten, as shown in Table 1. Over successive grades, however, these gaps grew. In contrast, Murnane et al. (2006) find larger initial gaps when they examine a very similar sample of students, but they do not find any growth in the gaps with grade level. In explanation for those conflicting findings, these authors point to differences in the type of tests used in the two studies: in comparison to the more general test used by Murnane et al., the one used by Fryer and Levitt was more closely aligned to items that are learned in school, thus giving students from all family backgrounds a more or less equal start in kindergarten. 3 Two previous studies of achievement gaps rely on administrative data from school systems. Using data from Pasadena, Bali and Alvarez (2004) find black-white gaps roughly 0.55 s.d. and 0.35 in math and reading at 1st grade and about 0.50 and 0.45 at 4th grade.4 Hanushek
2
Precise gaps provided by Meredith Phillips. From this point forward, the units in which achievement gaps are measured will be standard deviations unless otherwise indicated. 3
W herea s the test used in the E CLS samp le exam ined b y Fryer and Levitt emphasizes skills learned in school, the test used in the M urnane et al. study stresses a wider set of skills. 4
These figures were derived by dividing the reported gaps, measured as test scores, by the standard deviation of the 4 th grade reading test, the only standard deviation reported in the article. See Bai and Alvarez (2004, Tables 2 and 3 ).
4
and Rivkin (2006) employ a much larger data set, covering the entire state of Texas. Examining only math achievement, they find black-white gaps of 0.70 in 3rd grade and 0.75 in 8th.5 Since socioeconomic characteristics such as income and parental education tend to be correlated with race, it is likely that at least a portion of the observed gaps between racial and ethnic groups can be accounted for by non-racial factors. The research on achievement gaps has sought to determine just how large this portion is, in part because it is the portion of the currently observed gap that presumably will wither away over time as socioeconomic differences recede.6 In their study covering grades K-3, Fryer and Levitt (2005) find that adding a small set of controls – including age, gender, birth weight, mother’s age at first birth, and indicators of socioeconomic status – reduces estimated black-white gaps by more than half and actually eliminates the pure racial component at the beginning of kindergarten, after which it grows at the rate of about a tenth of a standard deviation through 3rd grade. Murnane et al. (2006) reach a different conclusion, based, as noted above, on a different sort of achievement test. When they control for socioeconomic status and other student covariates, they find a relatively constant racial gap, a bit smaller than one standard deviation, in both kindergarten and 5th grade. Gaps between Whites and Other Groups Hispanic students nationwide now comprise a larger minority group than African Americans. Although the historical circumstances and policy issues may differ between these two groups, the issues related to measuring the test score gap with whites and adjusting the gap
5
These are preliminary findings, ba sed on all black and white stude nts.
6
For an analysis that discusses the relationship between changes in the achievement gap and long-term socioeconomic differences, see Krueger, Rothstein and Turner (200 5).
5
for socioeconomic differences are quite parallel. As a general matter, the size of the Hispanicwhite gap tends to be smaller than the black-white one. In their analysis of the NAEP, for example, Phillips and Chin (2004) find gaps on the order of 0.70 standard deviations on both math and reading at the 4th grade level (compared to the 0.90 and 0.83 black-white gaps in math and reading, respectively). At 8th grade, the corresponding Hispanic-white differences were nearly 0.90 and 0.80, smaller than the black-white gap in math but about the same as the blackwhite gap in reading. In their 4th grade calculations, Bali and Alvarez (2004) find Hispanic-white gaps about half the size of the black-white one. Although smaller than the black-white gap, the Hispanic-white gap has been seen as stubbornly constant in recent decades.7 Nor does research suggest any shrinkage in this gap as students progress through school. As a percentage of the corresponding black-white gap on the NAEP in 2004, the Hispanic-white gap was 74% as large at 4th grade and 88% at 8th grade (Perie et al. 2005, pp. 41-44). In their somewhat gloomy National Research Council study, Tienda and Mitchell (2006, pp. 82-85) report that this gap remains constant through elementary school, as Hispanic students suffer from disadvantageous home environments, teacher biases, and low motivation.8 In a similar study of students in publicly supported English schools, Wilson, Burgess and Briggs (2005) examine the gaps in tests taken between ages 7 and 16, between white students and those from several ethnic minority groups. They find that raw achievement scores for whites 7
Lee (2002, Figures 2 and 3) shows that Hispanic-white gaps based on math and reading NAEP scores at three age levels have not declined since the late 1980s and the gap in SAT scores increased in the 1990s. Kao and Thom pson (2003 , p. 431) find that, after controlling for socioeconomic status, the achievement of white and Hispanic students was very close. 8
They state (p. 85): “Weak relations with teachers diminish students’ motivation to pursue academic work, and in turn lower teachers’ expectations in a self-perpetuating cycle of academic disengagement and underachievement.”
6
exceeded those for most minority groups, there was little gap with respect to Indians, and whites were consistently behind Chinese students. When scores are adjusted for differences in socioeconomic status, both of these nonwhite groups consistently outperformed white students. As students progress through school, most nonwhite groups gained relative to white students over most years.9
III. Data In this paper we analyze administrative data from North Carolina, one of the first and most prominent of the states to develop a mandatory statewide testing and accountability program. Having begun statewide testing in the 1970s and designed its own tests beginning in 1993, the state launched its accountability program, called the ABCs of Education, in the fall of 1996, which required the testing of all students in grades 3 to 8 and offered monetary rewards to teachers in high-performing schools.10 The state is both large and ethnically diverse. In 2002 its public schools enrolled 1.3 million public school students, giving it the 11th largest public school enrollment among the 50 states (U.S. Department of Education 2005, Table 37). Its largest racial minority is African American, with these black students making up 31.4% of the state’s public school students in 2004/05. Another 7.5% were Hispanic, this share having grown rapidly in recent years. Asian students comprised 2.0% of the total. And, reflecting concentrations of
9
The adjusted gap m easured in standard deviation units, for example, shows Pakistani students 0.22 behind whites at age 7 b ut 0.02 ahead at age 11; black Carib bean students remain behind by 0.42 and 0 .19. B y contra st, Indian and Chinese students are ahead of whites at both ages (Wilson, Burgess and Briggs 2005, T able 5). 10
For further background on testing in North Carolina, see North Carolina State Board of Education( n.d). or W ard (n.d.).
7
Cherokee in the west and Lumbee in the east, another 1.5% of students were American Indian (North Carolina Public Schools 2005, p. 24). The data used in the present study are derived from administrative records created by North Carolina’s Department of Public Instruction and maintained by the North Carolina Education Research Data Center.11 The state required all students to take standardized achievement tests in both math and reading at the end of every grade between 3 and 8. Using unique student identifying numbers that had been assigned randomly to individual students by the Data Center, we were able to match a student’s records over time, making it possible to compare trends in student achievement using a fixed sample of students. Not only does the data set provide information on test scores and many of the usual set of demographic variables, it also contains information on parents’ education and the school district attended. To facilitate comparisons across years, we normalized the scaled scores for each test in every year over all students in the state who took the test so that each test would have a mean score of zero and a standard deviation of one. On this normalized scale, positive scores denote above-average performances relative to the state, and negative scores denote below-average performance. Because we have achievement test data for grades 3 to 8 spanning the school years 1994/95 to 2004/05, we were able to examine five cohorts of students, most of whom progressed normally from grade 3 to 8.12 11
For more inform ation o n the Center, see its W eb page at: http://www.pubpol.duke.edu/centers/child/NC_Education_Research_Data_Center/nc_education_res_ctr.html, visited 12/21/05. 12
Append ix Table A2 shows the structure of the data by year and grade. Note that the sample sizes for the reading cohorts (those students who had six successive years’ data) are slightly smaller than those for the corresponding math cohorts. Limited English proficient (LEP) students could be excused their first year in the U.S. for the end-of-grade test in reading, but not in math.
8
So that our results would not be influenced by the movement of students in or out of the state or to and from private schools, we examined a series of unchanging cohorts of public school students. For both the math and reading tests we included in each cohort all students who took the corresponding 3rd grade end-of-grade test in a given year and end-of-grade tests in each succeeding year.13 Thus our results apply only to students who were enrolled in North Carolina public schools for six years, a fact that is particularly important with respect to Hispanic students, as we discuss in more detail in the next section. We have explicitly chosen to include in the sample students who repeated one or more grades, provided they appeared for six years. Leaving them out of the analysis would produce a seriously unrepresentative sample, in light of the high rates of grade retention among black and Hispanic students. Fortunately, standardized tests in North Carolina employ a developmental scale that makes it possible to express a retained student’s test outcome in terms of standard deviations from the mean of his or her former peers.14 By focusing on students who remained in the state’s public schools for six successive years, we are necessarily examining an unrepresentative group. These students on average had higher scores in 3rd grade and their parents had higher educational attainment than those students who did not qualify.15 But we believe the benefits from our focus on unchanging cohorts – most
13
The last two lines in Append ix Tab le A2 sho w the size of each year’s cohort for each of the two tests. These cohorts grew in size much more rapidly than the state’s overall public school enrollment, which increased at an ave rage rate of 1 .8% a year (c alculated from NC ES, Digest of Education Statistics 2004, Table 37, http://nces.ed.gov/programs/digest/d04/tables/dt04_037.asp, 1/9/06). This growth is largely the result of an increasing percentage of students enrolled for all six years. 14
The Ap pendix co ntains a d iscussion of ou r treatment of stud ents who are retained in grade, and Ap pendix Figure A1 illustrates differences in retention by race and ethnicity. Calculations based only on students who made normal progress through grades not surprisingly produce higher average scores, but the resulting racial gaps are similar in size to those based on entire cohorts, as shown in Table 2 . 15
See Table A1 for a compariso n of students included and excluded from the 1 999 coho rt.
9
importantly, the exclusion of newly arrived immigrants from the sample – outweighs this weakness.
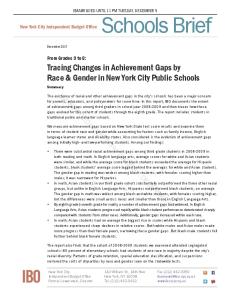
IV. Mean Differences in Achievement Across Racial and Ethnic Groups We begin our analysis of racial achievement gaps by examining levels and differences in mean achievement level by grade, with no corrections made for location or socioeconomic differences. We then present regression-adjusted estimates of these mean differences. Raw Achievement Gaps Table 2 presents mean achievement gaps for five racial/ethnic groups in grades 3 to 8, based on the cohorts who took their 3rd grade tests from 1995 to 1999. Figure 1 presents graphically for the four most numerous groups these gaps in a manner that facilitates the identification of patterns by grade level.16 The gap is largest and most persistent for black students. In math, this gap began at 0.768 s.d. in grade 3 and ended at 0.808 in grade 8; in reading the gap rose from 0.693 to 0.765. For neither test was there a monotonic progression, and what trends exist may largely if not entirely reflect statistical noise. These black-white gaps are well within the range established by existing literature – somewhat smaller than those reported by Fryer and Levitt (2005) for grade 3 and Phillips and Chin (2004) for grades 4 and 8, slightly larger than those observed by Hanushek and Rivkin (2006) for math in grades 3, 5, and 8,
16
Students were observed in six successive years. As explained in the Appendix, those few who indicated different racial/ethnic groups were assigned to the group most often cited. Except in cases involving the multiracial category, we dropped any student who cited two groups an equal number of years. When the multiracial group was one of the gro ups in a tie, we assigned the student to the other racial group if. Beca use of this asymm etric treatment, we give less attentio n to the gap for multirac ial students.
10
and quite a bit larger than Bali and Alvarez’s (2004) 4th grade gap based on a single school district. For Hispanic students the story is quite different. These students started with a smaller gap and then reduced that gap as they progressed into middle school. In math, they began an average of 0.508 standard deviation behind whites, and by 8th grade they were just 0.381 behind, a reduction of 25%. In reading, the gap started out larger than in math; between 3rd and 8th grade this gap fell by almost 30%, from 0.554 to 0.391 standard deviation.17 Crucial to this result is our restricted focus on students who were in the public schools for six consecutive years. This restriction not only leaves out Hispanic students whose families moved out of North Carolina after the 3rd grade year, but, more importantly, it also leaves out those who moved into the state after 3rd grade. Reflecting the steady flow of immigrants into North Carolina over the years covered by our data, this second group of Hispanic students was numerous, and they tended to have lower scores than the Hispanic students in our cohorts. Thus an achievement gap based on a snapshot of all students in any given year would be much larger than those we calculate based on unchanging cohorts. Moreover, the gaps based on such snapshots of all students tend to grow with each grade. Using our data for all North Carolina students rather than just members of cohorts, we calculated such snapshots to calculate Hispanic-white achievement gaps. These gaps were slightly larger at 3rd grade than those based on cohorts, and they grew rather than receded between 3rd and 8th grade, by 0.116 standard deviation in math and 0.202 in reading. This stark
17
Fryer and Levitt (2005, p. 3) cite a similar convergence.
11
contrast illustrates why the pattern of raw gaps for Hispanic students shown in Table 2 differs so profoundly from the impression given by the NAEP and other cross-section snapshots.18 Thus, the marked improvement we observe among Hispanic students relative to whites is highly dependent upon our exclusive focus on unchanging cohorts of students. Those Hispanic students who began in 3rd grade and stayed in the state’s public schools for five more years learned English if they were not fluent before and proceeded to improve relative to whites in both math and English.19 Our results serve as a warning not to let the hopeful gains achieved by established Hispanic students be obscured by combining them with the lower scores of newly arrived immigrants – precisely the result that emerges from exclusive reliance on periodic snapshots such as those provided by the NAEP-based national report cards. Asian students made steady progress from grade to grade relative to whites. By 8th grade, the average Asian student had a math score more than a third of a standard deviation above that of the average white student and was slightly ahead (by 9% of a standard deviation) in reading. This pattern is remarkably similar to that found by Burgess and Wilson (2005) for Chinese and Indian students in English schools. The American Indian students in North Carolina remained more than half a standard deviation below white students in both tests. Multi-racial students experienced gaps smaller than those for disadvantaged minority groups, and these gaps remained rather stable as students progressed in school. Regression-adjusted Achievement Gaps
18
By way of comparison, the gap for blacks based on snapshots is only slightly larger than that based on cohorts and shows a very similar change in both tests between 3 rd and 8th grades. 19
To illustrate, the perce ntage of the 19 99 co hort of Hisp anic students classified as limited English proficient fell from 37.9 % in 1999 to 17.3% in 2002.
12
Because students in various ethnic and racial groups typically differ in other ways that are systematically associated with achievement levels, such as socioeconomic status, researchers have sought to control statistically for such factors so as to isolate the component of achievement gaps purely related to racial or ethnic category. The controls used in these studies are of two types: measures of students’ personal and family characteristics and descriptive measures of schools and teachers. A principal reason for including variables of the latter type is to explore the extent to which observed gaps may be due to quality differences in schools attended by white and minority students. In this paper, we use measures only of the first type, leaving for separate analysis the examination of how schools and teachers affect achievement gaps. Consequently, we estimate regressions explaining normalized achievement test scores, using as regressors indicator variables for each racial group other than white, plus a set of other student covariates for which we have data. This list of variables includes gender, age in the spring of the 3rd grade, parental education, eligibility for free or reduced price lunch, and indicator variables signifying type of district and region within the state. We estimate twelve regressions in sets of six for math and reading scores, one per grade, pooling observations from the five age cohorts. Regressions estimated separately for each cohort show little evidence of meaningful differences in the level or trend of any racial achievement gap. Table 3a displays the results of specifications analyzing variation in math test scores, while Table 3b reports the results for reading specifications. Coefficients for the racial indicators appear first in each table, and can be interpreted as the regression-adjusted gap between the
13
indicated racial group and whites.20 As has been found in other studies, this statistical correction reduces the size of the black-white gap. For math, that adjusted gap is roughly two-thirds the size of the unadjusted gap; the adjusted gap averages slightly more than half a standard deviation, compared to the raw gap averaging about 0.80 s.d. over the six years covered, shown in Table 2. Similarly, the adjusted gap in reading averages somewhat less than half a standard deviation, compared to an average of about three quarters without adjustments. Although reduced in size, the remaining, otherwise unaccounted-for gap between white and black students in these grades is sizable. The tables also make it possible to track the adjusted black-white gap from grade to grade. For neither test was there a strong or even a monotonic trend, with the math gap ending slightly smaller in 8th grade and the reading gap ending somewhat larger. For Hispanic students, the effect of this statistical adjustment is striking: by 5th grade they were on a par with whites in both math and reading. By 8th grade, adjusted scores for Hispanic students in the state surpassed those of observationally equivalent whites by roughly a tenth of a standard deviation. These gains relative to whites are parallel to those observed above in the raw gaps. Thus, once income and educational background differences are taken into account, Hispanic students in North Carolina were outperforming whites by the end of middle school.21 Two features of the analysis explain this striking result, and serve to qualify it. First, the estimated equation underlying the adjustment includes both family income and parental 20
The re gressions repo rted in Tables 3a and 3b restrict the estimated effect of co variates to be eq ual across all racial groups. Regressions estimated with only two racial groups at a time, which effectively relax this restriction, prod uce similar results. 21
Little if any of the relative im provement by H ispanic students over the six gra des can be attributed to their improved eco nomic statnding. A year-by-year comparison of subsidized lunch rates for the 1999 coho rt, the only one for w hich informatio n was available in every year, sho ws the white-Hispanic gap falling slightly (from 51 .4 to 49.1% ) between 3 rd and 5th grade and then remaining constant thereafter.
14
education, two characteristics on which Hispanic students differ markedly from whites.22 Second, to repeat the point emphasized above, our focus on a fixed cohort of Hispanic students necessarily ignores newly arrived immigrants and their likely lower average achievement scores. For Asian students, the statistical adjustment has only a small effect on the size of the gap, because of their greater socioeconomic similarity with whites. The resulting estimates show Asian students surpassing whites on both tests and in all years except 3rd and 4th grade reading. For American Indians, the adjustment has the effect of reducing the gap with whites markedly, cutting it by almost half in most grades, owing to the large differences in income and education levels between white and Indian families in the state.23 The regression-adjusted estimates also show stronger trends towards convergence for this group. The adjusted gap between multiracial students and whites similarly shows convergence and is reduced in overall size. While the evidence of convergence for most disadvantaged minority groups conditional on observable characteristics might be construed as promising, it necessarily implies that the importance of certain other characteristics in determining test scores must be increasing over time. Indeed, both Table 3a and 3b show that the gap between poor and non-poor students (classified here according to their eligibility for subsidized lunches in 7th or 8th grade) increases as students get older. We considered the possibility that this result might be due to measurement
22
See Appendix Table A3 for a comparison of mean values by racial/ethnic group.
23
The gap between American Ind ians and whites is red uced even m ore when co mpa risons are made only within districts or schools, using fixed effects. In these regressions, estimated gaps are roughly a fourth smaller than those reported in Table 3, suggesting that a sizable portion of the statewide achievement gap between white and Indian students was due to differences across districts. Race/ethnicity coefficient estimates for the district fixed effect mode l appear as App endix Ta ble A4. Mo re than half of North Carolina’s American Indian students attend schools in two relatively small counties: Robeson and Swain. For other groups fixed effects specifications produce gaps com parable to those shown in Ta ble 3. The school fixed effects mode l, availab le from the authors on request, yields estim ates very similar to those o f the district fixed effects mod el.
15
error, but this appears unlikely. 24 This could mean that a portion of the racial gap is morphing into an economic gap as students age. Why a similar change does not emerge from the parental education coefficients, however, is unclear. A second factor showing increasing importance over time is student age. Students who are old relative to their cohort perform worse than their younger counterparts, and this gap grows over time. Disadvantaged minority students show a very slight tendency toward being older than whites (see Table A3), possibly because they are more likely to be retained prior to entering our analysis as 3rd graders. Thus, while the pattern of convergence in test score gaps is encouraging in some respects, researchers and policy-makers may wish to make further efforts to understand the widening gaps along other dimensions.
V. Racial Gaps at Other Points in the Achievement Distribution Much of the existing literature on racial achievement gaps focuses on differences in raw or regression-adjusted means. While the mean is perhaps the best statistic for measuring differences between racial and ethnic groups, for policy purposes other aspects of the distribution may be equally, if not more, interesting. In fact, we find that mean achievement gaps in some 24
As noted in the text above, we used eligibility for free or reduced price lunch in grad es 7 or 8 because those were the only two grades for which we had such information for all five cohorts. If families move in and out of poverty in years when students are in these grades, our measure could be a less precise indicator of poverty for students in early grades than when they were in grades 7 and 8. A consequence would be classic errors-in-variables that would bias the coefficient of the subsidized lunch indicator in the earlier grades toward zero, which could in turn raise the estimated coefficient on the rac e/ethnicity indicato rs to the extent they w ere co rrelated with income level. To test for this possibility, we examined data for the 1999 cohort only (the only cohort for which we had subsid ized lunch info rmatio n for each year). W e found that our grad e 7-8 measure of subsidized lunch eligibility is indeed more highly correlated to contemporaneous eligibility (0.66 for 3 rd grade math versus 0.86 for 8 th grade math, for exa mple). This variation app ears to exert little bias, how ever. W e estima ted regressio ns of the form o f those in Tables 3a and 3b, comparing the results when the indicator for actual contemporaneous eligibility for subsidized lunches was substituted for our indicator based on status in grades 7 and 8. We found no significant difference between a ny of the pairs of estimated coefficients for the subsidized lunc h or any of the race/ethnicity indicators.
16
instances mask a more complex pattern occurring in the tails of the test score distribution. This pattern suggests that success in closing the achievement gap can be attributed primarily to improving the test scores of the lowest-achieving students, and may come at the expense of higher-achieving students. Figures 3 and 4 present Epanechnikov kernel density plots of the math test score distribution for black and white students in the 1999 cohort in the 3rd and 8th grades, respectively. A close comparison of the two plots reveals a subtle but important difference in how each group’s distribution changes. Among black students, the distribution appears to be pushed in from the left, forcing up the peak, indicating improvement among those at the bottom. By contrast, the white distribution flattens slightly and its right tail extends, indicating improvement at the top of the distribution. These plots show evidence of a pattern that repeats itself in multiple cohorts and for all three disadvantaged minority groups (black, Hispanic, and American Indian): the test score distribution becomes compressed relative to the white distribution as students progress from 3rd to 8th grade. Further evidence in support of this point can be found in Table 4a, which lists math test score gaps between the 10th and 90th percentile of the white distribution and test score distributions for four different minority groups, where the gaps are measured in raw test score points rather than standard deviations. (In the overall test score distribution, a standard deviation is equal to approximately 10 raw test score points.) A consistent pattern appears for the three disadvantaged minority groups: between 3rd and 8th grade the gap from white scores at the bottom of the distribution falls, while the gap at the top increases. Of the 15 comparisons offered by the five cohorts and three groups, the gap at the 10th percentile fell in 14 of them. But the gap at the 90th percentile increased in 12 out of 15 cases. 17
This pattern is made possible by a decrease in the dispersion of each disadvantaged minority test score distribution relative to the white test score distribution. (It should be noted that the Asian test score distribution does not follow this pattern: high-performing Asian students accelerate ahead of their white counterparts in a manner comparable to Asian students at the low end of the distribution.) The impact of this compression is noteworthy. In 3rd grade, achievement gaps between disadvantaged minority students and whites were almost always larger at the low end than at the top of the distribution. The only exceptions were black students in the 1999 cohort and Hispanic students in the 1996 cohort, for whom the gaps at the high and low ends are equal. In 8th grade, this pattern is reversed: the largest gaps are now found at the high end of the distribution for all but the American Indian 1995 cohort. Table 4b shows that test score compression is generally not present in the distribution of reading test scores. At both the 10th and 90th percentiles, the overwhelming tendency is for test score gaps in this measure to remain roughly the same size, or to shrink slightly. No cohort exhibits the pattern of rising gaps at the 90th percentile exhibited in Table 4a. The overwhelming majority of cohorts exhibits a change in gap size of either zero or one point in either direction. While there is some tendency for gaps to be wider at the low end of the distribution, there is very little evidence that these low-end gaps are shrinking faster than those at the high end. Generally speaking, the convergence in reading test scores exhibited by Hispanics and Asians in Tables 2 and 3b appears to represent a wholesale shifting of the test score distribution of these groups. Why do racial math test score gaps tend to close at the bottom end of the distribution and widen at the top end? Why don’t reading test score gaps follow the same pattern? Although a 18
full evaluation of this phenomenon is beyond the scope of this paper, one reasonable hypothesis is that it reflects efforts to meet standards imposed by school accountability programs, such as North Carolina’s ABCs program and the federal No Child Left Behind Act, which assign disproportionate weight to low-performing students. These and other accountability programs include sanctions that punish schools where students fail to attain a minimum level of achievement. This emphasis on bringing all students up to a certain threshold may lead some schools to reallocate instructional resources away from high-performing children and towards low-performing children. If schools with high concentrations of low-achievers divert more resources away from high-performers than other schools, high-performers will be disadvantaged when they attend such schools. The observed depression of scores at the high end of the minority math test score distribution might then reflect the tendency for high-achieving minority students to have more low-performing classmates than their white counterparts. The absence of compression in the reading test score distribution at first seems to contradict this hypothesis, but it might reflect the general lack of progress in closing the blackwhite reading test score gap, as evidenced by Tables 2 and 3b. The relative success in closing the black-white math gap might reflect a more successful redistribution of instructional resources towards low-performing children. A straightforward test of this hypothesis would be to compare cohorts educated before and after the implementation of North Carolina’s accountability system, to see if the system’s implementation is associated with a decline in test scores for high-performing students in schools with a high proportion of low-performing students. We are unable to test this hypothesis because our earliest cohort did not reach 8th grade before the implementation of accountability in North 19
Carolina. We can at most present some suggestive evidence that this hypothesis might well be correct. Figure 5 shows the black and white 8th grade score distributions for our earliest cohort, those who were in 3rd grade in 1995; this cohort did not experience the state’s accountability program until they were in 5th grade. In comparison to the corresponding distributions for the 1999 cohort shown in Figure 4, the black distribution in this earlier cohort shows less compression, a difference that is consistent with our hypothesis.25 We must, however, leave further analysis of this phenomenon to future work. In any case, the possibility that raising the test scores of low-performing students may come at the expense of scores of high-performing students merits additional research.
VI. Differences Across Districts for Blacks and Whites One advantage of our administrative data is the opportunity it offers to observe achievement patterns for regions or individual districts. Such comparisons are instructive, in part, because of the contrasts in socioeconomic conditions experienced by students of different races in various metropolitan areas and regions as well as between urban and rural districts. As Bali
25
In considering the possible effects of accountability programs, it is instructive to ask how the mean achievement gaps changed over the five cohorts. To test for secular trends in these gaps, we estimated regressions with student covariates, interacting a linear time trend with indicators for each racial/ethnic group. The estimated coefficients for those interaction terms, shown in Appendix Table A5, indicate the average annual change in each gap at grades 3 and 8. Positive coefficients show improvement relative to white students, and negative ones show worsening gaps. The table shows that the black-white gap deteriorated gradually in both m ath and reading at 3 rd grade but improved slightly at 8 th grade, but in no case changing b y as much as 2 % o f a standard d eviation per year. The gap for H ispanic students also reveals a seem ingly contradictory pattern, with a growing gap in math in grade 3 but a shrinking gap fo r read ing only at 8 th grade. For Asian students, the only statistically significant trend is in reading at 8 th grade. The group showing the most consistent progress in relation to whites is American Indians, who reduced their gap in both subjects at 3 rd grade and in math a t 8 th grade. The rate of decline in 8th grade math scores for this group, 2.5% of a standard deviation a year, was about twice the rate experienced by black students and, if continued, would eliminate the entire adjusted ga p with whites in about 12 years.
20
and Alvarez (2004) did for Pasadena, we can calculate gaps applying to single large districts. Of greater practical importance, though, is the insight such comparisons can provide in assessing the impact of some district-wide school policies, such as Wake County’s practice of balancing its schools according to the percentage of students with low test scores and high rates of subsidized lunch eligibility. 26 Table 5 provides information from math tests on black achievement and the black-white gap for the state’s five largest districts, the remaining urban districts divided by the state’s three major regions, and the rural districts divided the same way. 27 The first column shows average black achievement for 3rd graders in the 1999 cohort to indicate the extent of variation across the state. This variation cannot be explained easily by income level, since the district or group with the lowest percentage of black students eligible for subsidized lunches (Wake) had lower black scores than all three of the groups of rural districts, and among the five largest districts the one with the highest average black score (Cumberland) also had the highest subsidized lunch share. The black-white gap, shown in the second column, also varied, being smallest in the rural districts and largest in the four large urban districts with the lowest rates of black subsidized lunches (those other than Cumberland). Especially pertinent to district policies is what happens to these two indicators as students advance in school. A district wishing to reduce the achievement gap for its black students would 26
The rule, adopted in 2000, established ceilings at each school limiting students on free or reduced-price lunch to 40% and those performing below grade level to 25% of the school’s enrollment (Silberman 200 2, p. 143). See also Finder (2005) for a description of the Wake County policy. 27
The table covers students who remained in the same district all six years of the cohort. Districts that unde rwent conso lidation betwe en 19 96 and 2005 were comb ined fo r all years; four city districts were comb ined with their respective county districts over this period. Students in charter schools were included in the district in which their cha rter school was loca ted.
21
hope to see both absolute progress for its black students and a narrowing of its local black-white achievement gap. As the remainder of this table clearly shows, however, neither objective was achieved in a majority of the 55 group-cohort combinations, and the pair was achieved simultaneously even less Only two groups of districts managed for a majority of the five cohorts to raise the mean test scores of black students while simultaneously reducing the magnitude of the achievement gap – the rural districts in the mountains and the coast. Elsewhere this accomplishment was rare. However, Wake County did witness in four of the five cohorts an increase in average achievement for its black students, arguably the more important of these two desirable objectives. Taken together, the pattern of changes shown in this table suggests the difficulty of achieving both objectives.
VII. Conclusion Our analysis of North Carolina administrative data adds to the body of research on racial achievement gaps by focusing on several very large cohorts of students in an ethnically diverse state, by examining gaps with respect to students in four different minority groups, and by looking beyond the mean of the distribution to uncover a more complicated pattern. Because the cohorts contain students who remained in the public schools for six consecutive years, the results are not influenced by immigration or private school enrollment, either of which could change the composition of students in the public schools. To be sure, restricting ourselves to students who remain in the public schools necessarily limits the generalizability of our findings, but we believe this disadvantage is vastly outweighed by the advantages of observing the academic performance of a fixed group of students over time. 22
Like previous studies, we find large gaps in mean achievement between white and black students. In contrast to some of those studies, however, we find no appreciable growth in the gap as student progress through school. Other disadvantaged minority groups, namely Hispanics and American Indians, also display lower test scores than whites, but these gaps are uniformly smaller than the black-white gap and show evidence of dissipating as students age. Asian students surpass whites between 3rd and 8th grade. Our findings are also in agreement with previous research in that socioeconomic factors explain a portion of these racial test score gaps. Indeed, these factors grow more important as students advance in school. Our work departs from previous research, however, in showing that the gap between cohorts of white and Hispanic students narrows markedly between 3rd and 8th grades. The stability of the black-white gap in regression-adjusted mean math test scores masks two divergent trends in the tails of the achievement distribution. At the low end of the achievement distribution, the gaps between white students and disadvantaged minority groups shrink, in most cases by a third or more, between 3rd and 8th grade. At the high end, however, test score gaps tend to increase by similar amounts as students age. This tendency may reflect any number of different factors, but one important question for further research is whether these divergent trends reflect tradeoffs that are being made in response to accountability programs, such as NCLB and North Carolina’s ABCs program, designed to raise the achievement of those at the bottom of the distribution. We find further evidence of the challenges inherent in closing the black-white test score gap in our examination of trends for individual school districts and groups of districts across the state. Few of the districts and district groups we examined succeeded over these grades in both 23
raising a black cohort’s test scores relative to the statewide mean and closing the black-white achievement gap. Nor did districts and district groups often succeed even in the first objective, suggesting once again the importance of research that will identify promising policies for raising achievement for disadvantaged students.
24
References Bali, Valentia A. And R. Michael Alvarez, “The Race Gap in Student Achievement Scores: Longitudinal Evidence from a Racially Diverse School District,” The Policy Studies Journal 32 (No. 3, 2004), 393-415. Barr, Donald A., “The Practitioner’s Dilemma: Can We Use a Patient’s Race to Predict Genetics, Ancestry, and the expected Outcomes of Treatment?” Annals of Internal Medicine 143 (2005), 809-815. Clotfelter, C.T., HF Ladd, JL Vigdor and R.A. Allege Diaz, “Do School Accountability Systems Make It More Difficult for Low Performing Schools to Attract and Retain High Quality Teachers?” Journal of Policy Analysis and Management v.23 (2003). pp.251-271. Clotfelter, Charles T., Helen F. Ladd, and Jacob L. Vigdor, “Federal Oversight, Local Control, and the Specter of ‘Resegregation’ in Southern Schools,” paper presented at conference on Brown v. Board of Education, Princeton University, October 7-8, 2004; NBER Working Paper 11086, January 2005. Clotfelter, Charles T., Helen F. Ladd, and Jacob L. Vigdor, “Teacher-Student Matching and the Assessment of Teacher Effectiveness,” paper presented at the meetings of the Association for Public Policy and Management, NBER Working Paper, January 2006. Finder, Alan, “As Test Scores Jump, Raleigh Credits Integration by Income,” New York Times, September 25, 2005. Fryer, Roland G. and Steven D. Levitt, “Understanding the Black-White Test Score Gap in the First Two Years of School, Review of Economics and Statistics 86 (May 2004), 447-464. Fryer, Roland G. and Steven D. Levitt, “The Black-White Test Score Gap through Third Grade,” unpublished ms., 2005. Hanushek, Eric A. and Steven G. Rivkin, “The Evolution of the Black-White Achievement Gap in Elementary and Middle Schools,” paper presented at the meetings of the American Economic Association, January 2006 (preliminary). Jencks, Christopher and Meredith Phillips (eds.), The Black-White Test Score Gap (Washington: The Brookings Institution, 1998). Kao, Grace and Jennifer S. Thompson, “Racial and Ethnic Stratification in Educational Achievement and Attainment,” Annual Review of Sociology 29 (2003), 417-442.
25
Krueger, Alan, Jesse Rothstein, and Sarah Turner, “Race, Income and College in 25 Years: The Continuing Legacy of Segregation and Discrimination,” NBER Working Paper 11445, June 2005. Lee, Jaekyung, “Racial and Ethnic Achievement Gap Trends: Reversing the Progress Toward Equity?” Educational Researcher 31 (January/February 2002), 3-12. Murnane, Richard J., John B. Willett, Kristen L. Bub, and Kathleen McCartney, “Explaining Puzzling Patterns in Black-White Achievement Gaps,” Harvard Graduate School of Education, January 2006. NAACP Legal Defense and Educational Fund, Closing the Gap (Washington: NAACPLDEF, 2005). http://www.naacpldf.org/content/pdf/gap/Closing_the_Gap_-_Moving_from_Rhetoric_to_Realit y.pdf North Carolina Public Schools, Statistical Profile 2005. http://www.ncpublicschools.org/fbs/stats/statprofile05.pdf, 1/16/06. North Carolina State Board of Education, “History of the North Carolina State Board of Education,” NC State Board of Education website, http://www.ncpublicschools.org/state_board/SBE_history/chapter3.html, 3/13/06. Paige, Rod, address to National Urban League, July 22, 2004. http://64.233.161.104/search?q=cache:ldWoiotQy64J:www.ed.gov/news/pressreleases/2004/07/ 07222004.html+Paige+calls+achievement+gap&hl=en, 12/22/05. Perie, Marianne, Rebecca Moran, Anthony D. Lutkus, and William Tirre, NAEP 2004 Trends in Academic Progress (Washington: Department of Education, National Center for Education Statistics, July 2005). http://nces.ed.gov/nationsreportcard/pdf/main2005/2005464.pdf, 1/18/06 Perlmann, Joel and Mary Waters (eds.), The New Race Question: How the Census Counts Multiracial Individuals (New York: Russell Sage Foundation, 2002). Peterson, Paul E., “Erasing Inequality,” New York Sun, September 28, 2005. Phillips, Meredith and Tiffani Chin, “School Inequality: What Do We Know?” in Kathryn Neckerman (ed.), Social Inequality (New York: Russell Sage Foundation, 2004). Public Schools of North Carolina, Website, The ABCs Accountability Model, http://abcs.ncpublicschools.org/abcs/, 12/23/05.
26
Public Schools of North Carolina, Assessment Brief, vol. 5, no. 3, March 1, 2004 , “Understanding North Carolina End-of-Grade Testing” http://www.dpi.state.nc.us/docs/accountability/testing/eog/AssessmentBriefEOG04.pdf, 12/23/05 Silberman, Todd, “Wake County Schools: A Question of Balance,” in Century Foundation, Divided We Fail: Coming Together through Public School Choice (New York: Century Foundation Press, 2002), pp. 141-163. Thernstrom, Stephan and Abigail Thernstrom, No Excuses: Closing the Racial Gap in Learning (New York: Simon and Schuster, 2003). Tienda, Marta and Faith Mitchell (eds.), Multiple Origins, Uncertain Destinies (Washington: National Research Council, 2006). Wilson, D., S. Burgess, and A. Briggs, “The Dynamics of School Attainment of England’s Ethnic Minorities,” unpublished paper, U. of Bristol, October 2005. U.S. Department of Education. 2005. Digest of Education Statistics, 2004. Web page: http://nces.ed.gov/programs/digest/d04/tables/dt04_037.asp, 12/21/05. Ward, Martha S., “Policies and Standards, Their Role and Revision: The Case of Ethics in Testing in North Carolina,” unpublished paper, n.d., http://www.natd.org/Ward96.htm, 3/13/06. g:\teachq\papers\achgapdraft50106
27
Appendix Detailed Data Description The construction of our panel data sets involved forming cohorts of students who took six successive end-of-grade achievement tests. This appendix discusses the treatment of students who failed at least one grade and the consistency of data for individual students. Grade Retention Any student who failed a grade necessarily did not take all tests in the same years as most of his or her peers. Simply eliminating these students would have yielded a seriously distorted sample, because rates of grade retention differ systematically by race. Figure A1 depicts the proportions of three racial/ethnic groups who progressed as expected from grade to grade. It shows that school careers with normal grade progression were markedly less common among black students than among white students, with Hispanic students falling between these groups. Five years after the 1998/99 school year, only 84% of the black students in the cohort had reached the 8th grade, compared to 89% of Hispanic and 94% of white students.28 Our approach to dealing with these repeaters and the noncomparability of their scores is to compute for these students a score based on their actual test performance but standardized according to test performance in the student’s “normal” rather than actual grade. The state’s end-of-grade tests were designed to correspond to the state’s curriculum. Raw scores on multiple choice exams based on the number of correct answers are converted to a “developmental scale score,” which “allows for the comparison of the student’s end-of-grade scores by subject from one grade to the next” (Public Schools of North Carolina 2004, pp. 1-2). Since these scores are meant to correspond to actual levels of knowledge that correspond to the state’s curriculum, we are able to apply, for example, the score a student obtains in the 3rd grade test after being retained in grade to the state distribution of the 4th grade scores to infer where that student would have fallen if he or she had taken the 4th grade test. Depending on the type of test and the grade level, the state’s published tables assume that a student showing “consistent mastery” should see growth in scaled scores ranging from a fraction of 1% to about 3% per year. Although both the math and reading tests experienced at least one re-calibration over the period of our sample, they retain the same format, with scaled scores at a given mastery level showing gradual increases from one year to the next. We illustrate how the inclusion or exclusion of various groups of students could affect the representativeness of the sample by examining the cohort of students who were 3rd graders in 1999. Table A1 gives sample sizes and mean values of several variables for four groups of students. The first three columns include three groups who took the 3rd grade test in 1999: those who made normal progress through all six grades, those in the cohort who repeated at least one
28
As can be inferred from comparing the gender composition of groups A and B in the 1999 cohort shown in Table A1, boys fail grades with more regularity than girls. The proportion of boys reaching 8 th grade in the norm al five years amo ng white students was 92% com pared to 9 5% for girls. Fo r black students the co mpa rable rates were 80 versus 88%, and for Hispanic students they were 87 versus 92%.
28
grade, and those students who were excluded from the cohort because they were not present in the data set all six years. Of these 98,578 students who took the 3rd grade test in 1998, this last group numbered almost 20,000, or about a fifth of the total. Of the remaining 79,147 students – those qualifying for the cohort – almost a tenth had to repeat at least one grade. The table’s last column covers the parallel group of students who were in a public school and took the math test in the last year, 2004, but who were not present all six years. The contrast between the cohort’s two groups, A and B, shows striking differences. Compared to those with normal grade progression, the grade repeaters (group B) averaged achievement scores in 3rd grade a full standard deviation below the normal-progress group. These repeaters were also disproportionately male (64%, compared to 49% among those with normal progress) and even more disproportionately black (52 vs. 29%). They were also more likely to be Hispanic or American Indian and less likely to be Asian. Their parents were markedly less likely to be college graduates and much more likely to have dropped out of school before receiving a high school diploma. The repeaters were also more likely to have family incomes low enough to qualify for subsidized lunches, and they were more likely to have been classified as exceptional in some way other than being deemed gifted. The sharp differences between groups A and B illustrate the importance of keeping the latter in the sample when examining the racial achievement gap. The mean values for groups C and D shown in Table A1 suggest what kinds of students are omitted from the analysis by restricting our sample to those who are present in all of the six years. Looking at the first group of mobile students, the table shows that those in group C had slightly lower 3rd grade achievement than those with normal progress in the cohort (roughly a fifth of a standard deviation), were much less likely to have college-educated parents, but also less likely to have parents who were not high school graduates. The mobile students in group D, comprising mostly students who arrived in the state after 1999, differed most clearly in their larger share of Hispanic students (10.4%), with a correspondingly higher share of students who were ever classified as having limited English. One other feature marking both of these mobile groups is their high probability of being in one of the state’s five largest school districts, a finding consistent with the high relative rates of growth and population turnover in the largest metropolitan areas. Data consistency We performed several checks to see how consistent the administrative data were over time. We were also interested in how students’ free and reduced price lunch status changed. We report here results for the 1998 cohort, but other cohorts looked similar in these regards. Three attributes that should not change over time are a student’s gender, age, and race/ethnicity; yet occasional inconsistences do arise in all of these categories. Given the vagaries of data collection in a multi-layered state administrative structure, some inconsistencies are inevitable. When students change schools in the weeks before a test, for example, preprinted forms with student information cannot be made available, so students themselves must provide information on gender, race, and date of birth, taking care to follow all instructions on how to fill in forms, all of which leads to occasional mistakes. Fortunately, such mistakes are 29
relatively rare. In the case of gender, they are quite rare, with a mere 0.4% of the 1998 cohort having at least one mistake over the six years. In fact, only 0.03% of the sample had no modal gender. In these cases, for all but the 1999 cohort, staff of the North Carolina Education Research Data Center examined the names to determine probable gender. Where that examination proved inconclusive, and for all the cases in the 1999 cohort with no mode, gender was assigned randomly. Inconsistencies were more common in the reporting of birthdays, with 5.4% of the 1998 cohort having at least one inconsistency. In these cases the modal birthday was chosen. For the 0.14% of this cohort that had no mode, the midpoint was chosen. The consistency of the race/ethnicity category is of special importance because of its centrality to the current analysis. The issue of racial categories has also assumed more general significance in light of the change in the census race categories in 2000 and the accompanying scholarly debate over racial classification itself.29 North Carolina school records allowed for these six categories in all years covered by our data: non-Hispanic white and black, Hispanic, Asian, American Indian, and multi-racial. For purposes of reporting to the Department of Education, however, the state used only the first five of these. For our purposes, we classified students according to the group they were placed in four or more of the six years. For the vast majority of students, there was no ambiguity: of the students in the 1998 cohort, 99% had the same race designation in all six years. If students were classified as multi-racial for three years and another race in three years, we assigned the student to the latter group. Students for whom there was no majority designation were dropped from the analysis. Interestingly, consistency in racial designation was highest for white and black students. The percentage of students in the 1998 cohort who showed only one race category over the six-year period was: white, 99.86%; black, 99.67%; Hispanic, 94.6%; Asian, 94.6%; American Indian, 91.3%; and multi-racial, 57.0%. Because information on which students were eligible for the free and reduced price lunch program was available only beginning in the 1998/99 year, we decided to define our measure of low family income based only on eligibility in a student’s last two years, which for most would be their 7th and 8th grade years. This information was available equally for all five of our cohorts. Accordingly, we found that about 44% of students in the 1998 cohort were classified as low-income, by virtue of being eligible for free or reduced price lunch in either 2002 or 2003. To see how well this variable distinguished students, we compared these designations to information on eligibility in each year from 1999 to 2003. We found that three quarters of those designated low income by our definition in fact were eligible in at least four of the five years for which we could determine their status. On the other side, we found that only 16% of those not designated low income had ever qualified as eligible. Our measure of parental education is based on information supplied by a student’s teacher or counselor, who was asked to indicate the education level corresponding to “the highest level completed by either of this student’s parents/guardians.” To Check for any general tendency to overstate or understate attainment by race/ethnicity, we compared the implied rates by group with those obtained in the 2000 census for the parents of students aged 8 to 11 in North Carolina. In general, the two distributions are very close to one another. Teachers and 29
See, for example, Perlmann and W aters 2002 and B arr (2005).
30
counselors were inclined to overstate the college completion rate of white and Asian parents (35.5% for whites compared to 30.9% from the census; 40.8% vs. 38.2% for Asians). But they tended to understate the proportion of black parents who had not completed high school (7.3% vs. 14.0% in the census). The tendency to overstate attainment for white and Asian parents could lead to an overestimate of the importance of parental education since their children have higher average achievement, but the tendency to overstate attainment for black parents would have the opposite effect.
31
Figure 1. Raw Achievement Gaps, 1995-1999 Combined Cohorts, Math and Reading
Note: achievement gaps are differences in mean normalized achievement scores, measured in standard deviation units, estimated in regressions combining five cohorts and containing indicators for racial/ethnic groups other than whites and for cohorts other than 1995. 4/11/06
Figure 2. Regression-adjusted Achievement Gaps 1995-1999 Combined Cohorts, Math and Reading
Note: achievement gaps in standard deviation units, estimated in regressions combining five cohorts and containing racial/ethnic indicators and other covariates. See Appendix Table A4. 4/11/06
Figure 3: The black and white achievement distributions, 1999 cohort, 3rd grade.
Figure 4: The black and white achievement distributions, 1999 cohort, 8th grade.
Figure 5: The black and white achievement distributions, 1995 cohort, 8th grade.
3/13/06
Table 1. Calculated Black-White Achievement Gaps, Selected Studies and Grades, in Standard Deviation Units Grade
Study
Raw Math
K (fall) Fryer-Levitt 1 K Fryer-Levitt 1 K Murnane et al. 2
Adjusted (differences in means) Reading Math Reading
-0.66 -0.73 -1.00
-0.40 -0.45 -1.18
-0.10 -0.21 -0.74
0.13 0.00 -0.92
1 1
Fryer-Levitt 1 Bali-Alvarez3
-0.76 -0.55
-0.52 -0.35
-0.28 -0.28
-0.08 -0.21
3 3
Fryer-Levitt 1 Hanushek-Rivkin4
-0.88 -0.70
-0.77 ----a
-0.38
-0.28
4 4
Phillips-Chin 5 Bali-Alvarez3
-1.00 -0.50
-0.83 -0.45
5 5
Hanushek-Rivkin4 Murnane et al. 2
-0.72 -1.01
----a -1.09
-0.81
-0.87
8 8
Phillips-Chin 5 Hanushek-Rivkin4
-1.06 -0.75
-0.86 ----a
Note: Raw gaps are differences in mean achievement scores, and adjusted gaps are estimated coefficient of black indicator in regressions with student covariates. Blanks indicate that studies did not calculate comparable adjusted gaps. a. Gaps calculated just for math scores. Sources: 1 Fryer and Levitt (2005, Tables 1, 2 and 3). 2 Murnane et al. (2006, Tables 2, 8). 3 Bali and Alvarez (2004, p. 409). Estimated by dividing reported gaps, measured in units of test scores, by the standard deviation of 4th grade reading test. 4 Hanushek and Rivkin (2006, Table 2), preliminary. 5 Phillips and Chin (2004) and spreadsheet made available by the authors.
ctcdocs\Ach gap\previous studies 1/23/06
Table 2. Raw Achievement Gaps, Grades 3 to 8, 1995-1999 Combined Cohorts Math, by Grade
Reading, by Grade
3
4
5
6
7
8
3
4
5
6
7
8
Black
-0.768 (0.003)
-0.808 (0.003)
-0.789 (0.003)
-0.827 (0.003)
-0.826 (0.003)
-0.808 (0.003)
-0.693 (0.003)
-0.746 (0.003)
-0.766 (0.003)
-0.755 (0.003)
-0.756 (0.003)
-0.765 (0.003)
Hispanic
-0.508 (0.011)
-0.468 (0.012)
-0.446 (0.012)
-0.454 (0.012)
-0.424 (0.012)
-0.381 (0.012)
-0.554 (0.012)
-0.510 (0.012)
-0.456 (0.012)
-0.441 (0.012)
-0.387 (0.012)
-0.391 (0.012)
Asian
0.023 (0.014)
0.133 (0.014)
0.207 (0.014)
0.246 (0.014)
0.290 (0.014)
0.340 (0.014)
-0.105 (0.014)
-0.059 (0.014)
0.005 (0.014)
0.033 (0.014)
0.089 (0.014)
0.092 (0.014)
Am. Ind
-0.577 (0.012)
-0.611 (0.012)
-0.669 (0.013)
-0.639 (0.013)
-0.629 (0.013)
-0.565 (0.013)
-0.621 (0.012)
-0.643 (0.012)
-0.711 (0.013)
-0.667 (0.012)
-0.648 (0.013)
-0.623 (0.012)
Multiracial
-0.273 (0.018)
-0.281 (0.018)
-0.262 (0.018)
-0.301 (0.018)
-0.289 (0.018)
-0.274 (0.018)
-0.219 (0.018)
-0.219 (0.018)
-0.200 (0.019)
-0.205 (0.018)
-0.206 (0.018)
-0.200 (0.018)
Note: Note: For math, the cohorts contain 56,625 students in 1995, 61,611 in 1996, 71,753 in 1997, 76,398 in 1998 and 79,147 in 1999. The cohort consists of NC public school students who took the grade 3 math end-of-grade test in the spring of 1998 and who took end-of-year math tests in each of the following five years. For reading, the cohort is defined analogously and contains 56,519 students in 1995, 61,353 in 1996, 71,334 in 1997, 75,853 for 1998 and 78,431 in 1999.
Source: North Carolina Education Data Center; author’s calculations 3/14/06
Table 3a. Regression Estimates, Math Scores, 1995-99 Combined Cohorts Variable Grade 3 Grade 4 Grade 5 Grade 6 Race/ Ethnicity (white omitted) Black -0.531* -0.544* -0.512* -0.525* (0.004) (0.004) (0.004) (0.004) Hispanic -0.099* -0.025* 0.009 0.024* (0.011) (0.011) (0.011) (0.011) Asian 0.066* 0.175* 0.237* 0.287* (0.013) (0.013) (0.013) (0.013) Am. Indian -0.330* -0.338* -0.373* -0.324* (0.012) (0.012) (0.012) (0.012) Multiracial -0.141* -0.137* -0.115* -0.138* (0.017) (0.017) (0.017) (0.017) Male -0.013* -0.008* -0.013* -0.029* (0.003) (0.003) (0.003) (0.003) Age in years, May -0.054* -0.114* -0.150* -0.178* 15 (0.003) (0.003) (0.004) (0.003) Subsidized lunch -0.173* -0.190* -0.196* -0.208* (0.004) (0.004) (0.004) (0.004) Parental education No HS degree -1.052* -1.110* -1.140* -1.164* (0.006) (0.006) (0.007) (0.006) HS, no college -0.566* -0.617* -0.658* -0.685* degree (0.004) (0.004) (0.004) (0.004) District type (other urban omitted) Largest five -0.044* -0.060* -0.060* -0.065* (0.004) (0.004) (0.004) (0.004) Rural 0.009* 0.004 -0.022* -0.001 (0.004) (0.004) (0.004) (0.004) Region (Piedmont omitted) Coastal 0.052* 0.046* 0.030* 0.055* (0.005) (0.004) (0.004) (0.004) Mountain 0.034* 0.055* 0.067* 0.114* (0.004) (0.004) (0.004) (0.004) Year of Cohort (1995 omitted) 1996 -0.005 -0.004 -0.005 -0.003 (0.005) (0.005) (0.005) (0.005) 1997 -0.001 0.008 0.023* 0.015* (0.005) (0.005) (0.005) (0.005) 1998 0.004 -0.015* -0.011* -0.008 (0.005) (0.005) (0.005) (0.005) 1999 0.005 -0.010* -0.006 -0.017* (0.005) (0.005) (0.005) (0.005) N 345,534 345,534 345,534 345,534 R2 0.254 0.277 0.281 0.302 Note: Standard errors in parentheses; * denotes significance at the 5% level 3/1/06
Grade 7
Grade 8
-0.520* (0.004) 0.060* (0.011) 0.329* (0.013) -0.304* (0.012) -0.124* (0.017) -0.035* (0.003) -0.182* (0.003) -0.211* (0.004)
-0.497* (0.004) 0.111* (0.011) 0.388* (0.013) -0.246* (0.012) -0.105* (0.017) -0.029* (0.003) -0.217* (0.003) -0.217* (0.004)
-1.185* (0.006) -0.711* (0.004)
-1.177* (0.006) -0.692* (0.004)
-0.062* (0.004) -0.006 (0.004)
-0.049* (0.004) 0.030* (0.004)
0.068* (0.004) 0.116* (0.004)
0.088* (0.004) 0.124* (0.004)
-0.007 (0.005) 0.019* (0.005) -0.002 (0.005) 0.042* (0.005) 345,534 0.310
-0.011* (0.005) 0.006 (0.005) 0.010* (0.005) 0.025* (0.005) 345,534 0.304
Table 3b. Regression Estimates, Reading Scores, 1995-99 Combined Cohorts Variable Grade 3 Grade 4 Grade 5 Grade 6 Race/ Ethnicity (white omitted) Black -0.443* -0.482* -0.494* -0.475* (0.004) (0.004) (0.004) (0.004) Hispanic -0.123* -0.061* 0.016 0.028* (0.011) (0.011) (0.011) (0.011) Asian -0.067* -0.024 0.039* 0.071* (0.013) (0.013) (0.013) (0.013) Am. Indian -0.349* -0.351* -0.407* -0.365* (0.012) (0.012) (0.012) (0.011) Multiracial -0.086* -0.080* 0.058* -0.058* (0.017) (0.016) (0.017) (0.016) Male -0.162* -0.149* -0.137* -0.158* (0.003) (0.003) (0.003) (0.003) Age in years, May -0.097* -0.123* -0.139* -0.155* 15 (0.003) (0.003) (0.004) (0.003) Subsidized lunch -0.198* -0.211* -0.215* -0.222* (0.004) (0.004) (0.004) (0.003) Parental education No HS degree -1.081* -1.118* -1.177* -1.148* (0.006) (0.006) (0.007) (0.006) HS, no college -0.579* -0.616* -0.630* -0.635* degree (0.004) (0.004) (0.004) (0.004) District type (other urban omitted) Largest five -0.034* -0.031* -0.025* -0.011* (0.004) (0.004) (0.005) (0.004) Rural -0.007 -0.012* -0.016* 0.013* (0.004) (0.004) (0.004) (0.003) Region (Piedmont omitted) Coastal 0.039* 0.055* 0.050* 0.061* (0.004) (0.004) (0.004) (0.004) Mountain 0.044* 0.048* 0.053* 0.063* (0.004) (0.004) (0.004) (0.004) Year of Cohort (1995 omitted) 1996 -0.002 -0.002 -0.009 -0.007 (0.005) (0.005) (0.005) (0.005) 1997 0.006 0.009* 0.016* 0.001 (0.005) (0.005) (0.005) (0.005) 1998 0.009* -0.004 -0.019* 0.004 (0.005) (0.005) (0.005) (0.004) 1999 0.015* 0.005 -0.022* -0.009 (0.005) (0.005) (0.005) (0.004) N 343,490 343,490 343,490 343,490 R2 0.251 0.276 0.281 0.293 Note: Standard errors in parentheses; * denotes significance at the 5% level 3/1/06
Grade 7
Grade 8
-0.481* (0.004) 0.090* (0.011) 0.124* (0.013) -0.342* (0.011) -0.061* (0.017) -0.166* (0.003) -0.155* (0.003) -0.220* (0.004)
-0.486* (0.004) 0.089* (0.011) 0.131* (0.013) -0.314* (0.011) -0.054* (0.016) -0.165* (0.003) -0.184* (0.003) -0.231* (0.003)
-1.172* (0.006) -0.619* (0.004)
-1.155* (0.006) -0.612* (0.004)
0.012* (0.004) 0.011* (0.004)
-0.002 (0.004) 0.008* (0.003)
0.064* (0.004) 0.075* (0.004)
0.069* (0.004) 0.072* (0.004)
-0.021* (0.005) 0.021* (0.005) -0.014 (0.005) 0.039* (0.005) 343,490 0.288
-0.010* (0.005) -0.021* (0.005) 0.027* (0.004) 0.042* (0.004) 343,490 0.297
Table 4a: Achievement Gaps in the Tails of the Math Distribution Gap between 10th percentile of group and 10th percentile of whites
Gap between 90th percentile of group and 90th percentile of whites
Group
Cohort
3rd grade
8th grade
Change
3rd grade
8th grade
Change
Black
1995
9
9
0
8
11
+3
1996
9
5
-4
8
11
+3
1997
9
6
-3
7
11
+4
1998
9
7
-2
8
10
+2
1999
9
7
-2
9
10
+1
1995
5
3
-2
4
5
+1
1996
5
2
-3
5
5
0
1997
7
3
-4
4
5
+1
1998
6
3
-3
5
4
-1
1999
6
3
-3
5
5
0
1995
-2
-4
-2
-2
-5
-3
1996
0
-4
-4
-1
-6
-5
1997
0
-3
-3
0
-3
-3
1998
1
-3
-4
-1
-4
-3
1999
-1
-3
-2
-1
-4
-3
1995
9
7
-2
6
7
+1
1996
7
3
-4
5
7
+2
1997
9.5
5
-4.5
5
8
+3
1998
8
5
-3
6
7
+1
1999
6
4
-2
6
8
+2
Hispanic
Asian
Am. Ind.
3/3/06
Table 4b: Achievement Gaps in the Tails of the Reading Distribution Gap between 10th percentile of group and 10th percentile of whites
Gap between 90th percentile of group and 90th percentile of whites
Group
Cohort
3rd grade
8th grade
Change
3rd grade
8th grade
Change
Black
1995
6
7
1
7
6
-1
1996
6
7
1
6
6
0
1997
6
7
1
6
6
0
1998
7
7
0
7
6
-1
1999
6
7
1
7
6
-1
1995
3
2
-1
3
2
-1
1996
3
2
-1
4
2
-2
1997
6
5
-1
4
4
0
1998
7
3
-4
5
3
-2
1999
6
4
-2
5
3
-2
1995
-1
-4
-3
0
-1
-1
1996
0
-1
-1
0
-1
-1
1997
1
0
-1
0
0
0
1998
2
-1
-3
2
-1
-3
1999
1
0
-1
0
-2
-2
1995
7
7
0
5
5
0
1996
6
6
0
6
5
-1
1997
7
7
0
5
5
0
1998
7
6
-1
5
4
-1
1999
5
5
0
6
5
-1
Hispanic
Asian
Am. Ind.
3/3/06
Table 5. 3rd Grade Math Score for Blacks and Black-White Gap, 1999 Cohort, and Changes from Grade 3 to 8 in Black Math and Black-White Gap, 1995 to 1999 Cohorts
State Top five CharlotteMecklenburg Wake Guilford Cumberland WinstonSalem/Forsyth Other urban Coastal Piedmont Mountain Rural Coastal Piedmont Mountain
3rd grade, 1999 Change in average normalized black score Avg. Black- Pct black white black 1995 1996 1997 1998 1999 math gap subsid cohort cohort cohort cohort cohort score lunch -0.463 -0.784 75.6 -0.091 -0.062 -0.025 -0.059 -0.028
Change in black-white score gap 1995 cohort
1996 cohort
1997 cohort
1998 cohort
1999 cohort
0.086
0.046
0.007
0.050
0.024
-0.528 -1.080
70.2
-0.260
-0.114
0.118
0.049
0.067
0.095
0.001
-0.036
0.012
-0.007
-0.472 -0.551 -0.353 -0.684
-1.045 -0.967 -0.682 -1.051
53.2 72.3 77.1 73.5
-0.049 -0.274 -0.224 -0.142
0.036 -0.289 -0.131 -0.030
0.130 -0.145 -0.198 -0.063
0.050 -0.109 -0.203 -0.034
0.073 -0.012 -0.107 0.114
0.112 0.093 0.038 0.002
0.093 0.138 -0.060 -0.054
-0.032 0.031 0.007 -0.027
0.041 0.063 0.045 0.022
0.004 0.067 -0.062 -0.110
-0.403 -0.748 -0.455 -0.849 -0.525 -0.770
78.7 70.5 75.8
-0.095 -0.054 0.029
-0.055 -0.079 0.030
0.000 -0.109 0.061
-0.050 -0.166 0.137
-0.046 -0.104 0.023
0.069 0.068 0.036
0.003 0.067 0.017
-0.032 0.030 0.028
-0.023 0.107 0.006
0.004 0.029 0.032
-0.440 -0.721 -0.422 -0.665 -0.464 -0.687
85.5 82.3 76.9
-0.025 -0.033 0.077
0.059 -0.057 0.051
0.041 -0.065 0.024
0.013 -0.113 0.042
-0.016 -0.096 0.093
0.090 0.032 -0.029
-0.014 0.028 -0.050
-0.060 0.019 -0.046
-0.028 0.061 -0.038
-0.030 0.042 -0.047
Note: Bolded district indicate either increases in mean test scores or decreases in the white-black score test gap between eighth and third grades. Source: North Carolina Education Research Center; authors' calculations. 3/22/06
Figure A1. Grade Progression by Racial/Ethnic Group, 1999 Cohort
3/13/06
Table A1. Sample Sizes and Mean Values for Selected Variables, Groups of 3rd Grade Students, 1999; One Group of 8th Grade Students, 2004 A
B
1999 cohort Normal progress Repeated a grade
C D Not present all six years Present in Present in 1999 2004
N 71,625 7,522 19,431 29,433 Normalized grade 3 score (a) Math 0.169 -1.023 -0.054 -Reading 0.161 -1.026 -0.034 -Male 0.488 0.636 0.539 0.551 Race/ Ethnicity White 0.647 0.422 0.633 0.521 Black 0.286 0.516 0.263 0.315 Hispanic 0.025 0.030 0.043 0.104 Asian 0.016 0.004 0.022 0.026 Am. Indian 0.015 0.017 0.011 0.009 Multiracial 0.012 0.011 0.019 0.020 Age in May of grade 3 (b) 9.21 9.26 9.29 9.57 Parental education College 0.296 0.041 0.094 0.121 HS, no college degree 0.647 0.764 0.871 0.811 No HS degree 0.057 0.195 0.035 0.068 Subsidized lunch (c) 0.419 0.654 -0.537 Ever exceptional 0.148 0.332 0.189 0.182 Ever limited English 0.018 0.023 0.026 0.059 District group Largest five 0.276 0.231 0.333 0.334 Urban Coastal 0.095 0.130 0.125 0.115 Urban Piedmont 0.110 0.101 0.098 0.112 Urban Mountain 0.077 0.071 0.075 0.070 Rural Coastal 0.061 0.077 0.058 0.059 Rural Piedmont 0.240 0.294 0.201 0.206 Rural Mountain 0.140 0.096 0.110 0.102 Note: The 1999 cohort includes all students who took the 3rd grade end-of-grade math test in the spring of 1999, and the end-of-grade math tests in each year through 2004. Group A includes all those who progressed one grade each year. Group B is comprised of students who were present in all six years but who repeated at least one grade. The samples shown in columns C and D are comprised of students who did not have an end-ofgrade math score or were otherwise not in the data set in each of the six years.
a. Each end-of-grade test was normalized using the statewide mean and standard deviation of the scaled score, producing a normalized score with zero mean and unitary standard deviation. For students who were retained in grade, scaled scores were applied to the statewide mean and standard deviation applying to the grade in which they would have been had they made normal progress. See text. Very few in group D were in a state's public schools in their third grade year, so no mean is reported. b. Age in years is exact only to the month since birth date was available only to the closest month. c. Percentage of students who were eligible for free or reduced price lunch in either of the last two years covered by the sample, normally grades 7 or 8. Since very few in group C were in the state's public schools in the last two years of the grade span, the mean for this group is omitted. Source: North Carolina Education Research Data Center; authors' calculations. 2/27/06
Table A2. Normal Grade, by Year and Cohort School year 1994/1995 1995/1996 1996/1997 1997/1998 1998/1999 1999/2000 2000/2001 2001/2002 2002/2003 2003/2004
Test date 1995 1996 1997 1998 1999 2000 2001 2002 2003 2004
Cohort, by Year in 3rd Grade 1995 3 4 5 6 7 8
1996
56,625 56,519
61,611 61,353
3 4 5 6 7 8
1997
3 4 5 6 7 8
1998
3 4 5 6 7 8
1999
3 4 5 6 7 8
Sample size Math Reading 2/27/06
71,753 71,334
76,398 75,853
79,147 78,431
Appendix Table A3. Sample Sizes and Mean Values for Selected Variables, by Race/Ethnicity, 1999 Cohort
N Normalized grade 3 score Math Reading Male Age in May of grade 3 Parental Education College HS, no college degree No HS degree Subsidized lunch Ever exceptional Ever limited English District Group Largest Five Urban coastal Urban piedmont Urban mountain Rural coastal Rural piedmont Rural mountain Source: See Table A1. 3/3/06
White 49,619
Black Hispanic 24,500 2,025
Asian 1,163
Am.Indian 1,191
Multiracial 912
0.317 0.294 0.510 9.21
-0.467 -0.421 0.487 9.24
-0.206 -0.321 0.521 9.32
0.366 0.172 0.506 9.17
-0.179 -0.293 0.490 9.24
0.070 0.105 0.493 9.17
0.355 0.591 0.053 0.265 0.168 0.002
0.118 0.809 0.073 0.757 0.173 0.002
0.089 0.488 0.422 0.764 0.146 0.489
0.408 0.440 0.154 0.459 0.093 0.301
0.126 0.777 0.097 0.761 0.154 0.005
0.240 0.708 0.052 0.536 0.148 0.013
0.233 0.085 0.102 0.094 0.058 0.238 0.189
0.343 0.133 0.124 0.044 0.079 0.241 0.036
0.300 0.080 0.147 0.049 0.056 0.271 0.097
0.513 0.037 0.108 0.116 0.006 0.081 0.138
0.103 0.016 0.021 0.015 0.006 0.791 0.048
0.320 0.126 0.134 0.090 0.041 0.206 0.083
Appendix Table A4. Adjusted Achievement Gaps, Grades 3 to 8, 1995-99 Combined Cohorts, District Fixed Effects Average normalized math score, by grade Average normalized reading score, by grade 3 4 5 6 7 8 3 4 5 6 7 8 Black -0.527* -0.533* -0.507* -0.513* -0.502* -0.475* -0.436* -0.471* -0.481* -0.461* -0.463* -0.468* (0.004) (0.004) (0.004) (0.004) (0.004) (0.004) (0.004) (0.004) (0.004) (0.004) (0.004) (0.004) Hispanic -0.098* -0.026* 0.009 0.023* 0.052* 0.100* -0.124* -0.063* 0.014 0.028* 0.089* 0.086* (0.011) (0.011) (0.011) (0.011) (0.011) (0.011) (0.011) (0.011) (0.011) (0.011) (0.011) (0.011) Asian 0.076* 0.192* 0.251* 0.300* 0.335* 0.398* -0.065* -0.016 0.046* 0.075* 0.123* 0.133* (0.013) (0.013) (0.013) (0.013) (0.013) (0.013) (0.013) (0.013) (0.013) (0.013) (0.013) (0.013) Am. Indian -0.310* -0.313* -0.280* -0.267* -0.245* -0.200* -0.318* -0.307* -0.296* -0.290* -0.250* -0.227* (0.013) (0.014) (0.014) (0.014) (0.013) (0.013) (0.013) (0.013) (0.014) (0.013) (0.013) (0.013) Multiracial -0.145* -0.141* -0.119* -0.140* -0.121* -0.101* -0.088* -0.087* -0.064* -0.063* -0.059* -0.057* (0.016) (0.017) (0.017) (0.017) (0.016) (0.017) (0.017) (0.016) (0.017) (0.016) (0.017) (0.016) Note: Figures shown are coefficients of race/ethnicity indicators in a regression explaining normalized end-of-grade test scores and including student covariates for gender, age, subsidized lunch, parental education, year of cohort, type of district, and region. Standard errors are shown in parentheses; asterisks denote significance at the 5% level. Source: North Carolina Education Research Center; authors' calculations. 3/1/06
Appendix Table A5. Linear Trends over Time in Achievement Gaps, Grades 3 and 8, 1995 to 1999 Cohorts 3rd Grade
8th Grade
Math
Reading
Math
Reading
Black
-0.006* (0.002)
-0.018* (0.002)
0.006* (0.002)
0.012* (0.002)
Hispanic
-0.007 (0.008)
-0.032* (0.008)
0.023* (0.008)
-0.013 (0.008)
Asian
0.016 (0.009)
0.011 (0.009)
0.021* (0.009)
-0.010 (0.009)
Amer. Indian
0.028* (0.008)
0.017* (0.008)
-0.000 (0.008)
0.025* (0.008)
Note: Table shows the coefficients of interaction terms between race/ethnicity indicators and a linear time trend. Other variables include race/ethnicity indicators, linear time trend, age, and indicators for gender, subsidized lunch, parental education, district type, and region. Standard errors in parentheses; * denotes significance at the 5% level. Source: North Carolina Education Research Center; authors' calculations. 3/14/06