The Economy, Military, and Ecologically Unequal Exchange Relationships in Comparative Perspective: A Panel Study of the Ecological Footprints of Nations, 1975–2000 Andrew K. Jorgenson, University of Utah Brett Clark, North Carolina State University The authors employ multiple theories within a political economy framework to examine the structural predictors of the per capita ecological footprints of nations. Engaged theories include ecological modernization, treadmill of production, treadmill of destruction, and ecologically unequal exchange. Results of cross-national panel regression models indicate that the treadmill of production in the context of economic development increases per capita footprints, which contradicts general claims of ecological modernization theory. Similarly, the treadmill of destruction in the mode of military expenditures per soldier positively affects per capita footprints. Those with relatively higher levels of exports sent to economically developed and militarily powerful nations experience suppressed consumption levels, and these effects are especially pronounced and increasingly so for less-developed countries, many of which consume resources well below globally sustainable thresholds. The latter sets of findings support key elements of ecologically unequal exchange theory. Ultimately, this research suggests that a political economy framework that considers domestic attributes and structural relationships in particular contexts is quite useful for understanding the consumption-based environmental harms of nations. Keywords: environment, globalization, international political economy, military, ecologically unequal exchange.
Perhaps the greatest challenge facing humanity during the twenty-first century is the environmental problem. Scientific investigations indicate that human activities are the primary force transforming ecosystems and climate conditions (e.g., IPCC 2007). James Hansen (2008:7–8), a leading U.S. climatologist, notes that the “planet is dangerously near a tipping point” given the accumulation of carbon dioxide in the atmosphere. He points out that if we continue with business-as-usual, in terms of an expanding economy predicated on a carbon-based energy system, cascading environmental problems will beset global society. While the speed and scale of the transformation of ecosystems is unprecedented, the disparities in environmental damages are uneven among nations. Rich nations place more stress on the global environment, while poorer nations disproportionately contend with the effects and consequences of degraded and/ or stressed ecosystems (Roberts and Parks 2007; Srinivasan et al. 2008). Increasingly, the relationships between the economy, the military, and natural resources have captured widespread attention, given the war in Iraq and concerns over the “global energy supply.” Alan Greenspan, former Federal Reserve Board chairman, explains in his book An earlier version of this article was presented at the International Conference on Ecology and Power: Critical Perspectives on Sustainability and Resilience, hosted by the Human Ecology Division, Lund University, Sweden, September 2008. The authors thank the editor, anonymous reviewers, and Kelly Austin for very helpful suggestions on prior drafts. Direct correspondence to: Andrew K. Jorgenson, Department of Sociology, University of Utah, 380 South 1530 East, Room 301, Salt Lake City, UT 84112. E-mail:
[email protected]. Social Problems, Vol. 56, Issue 4, pp. 621–646, ISSN 0037-7791, electronic ISSN 1533-8533. © 2009 by Society for the Study of Social Problems, Inc. All rights reserved. Please direct all requests for permission to photocopy or reproduce article content through the University of California Press’s Rights and Permissions website at www.ucpressjournals.com/reprintinfo/asp. DOI: 10.1525/sp.2009.56.4.621.
SP5604_02.indd 621
10/3/09 1:58:17 PM
622
JORGENSON/Clark
The Age of Turbulence (2007) that world economic growth over the next 25 years is going to require vast increases in the consumption of oil for production. He indicates that the needed oil will primarily come from the Persian Gulf. Hence, he exclaims, “the Iraq war is largely about oil” (Greenspan 2007:462–63). This course of economic development has generated concerns among other mainstream environmentalists, such as James Gustave Speth—who founded the World Resources Institute, co-founded the Natural Resources Defense Council, and was an adviser to President Clinton. Speth (2008) explains that the economy and the environment “remain in collision” and that the former is “incapable of sustaining the environment” due to its inherent tendency for expansion (pp. xi, 48–63). Such conclusions demand a critical evaluation of the exchanges of natural resources within the global economy as well as the relationships of economic development and the military to the environment in comparative perspective. Here we present cross-national analyses utilizing an international political economy framework, which engages the ecological modernization, treadmill of production, and treadmill of destruction traditions within environmental sociology as well as the emergent ecologically unequal exchange orientation in the comparative social sciences. We utilize this structural political economy framework to illuminate the environmental consequences of the contemporary world’s interstate system, with a particular focus on the consumption-based environmental impacts of nations, measured as per capita ecological footprints. We analyze cross-national panel data to illustrate historical patterns and relationships, and we evaluate the explanatory power of the ecological modernization, environmental treadmill, and ecologically unequal exchange theories for identifying and explaining particular society/nature relationships related to the consumption-based environmental demands of nations. Furthermore, we assess the extent to which the impacts of ecologically unequal exchange relationships vary between developed countries1 and less-developed countries, and if the impacts became more or less pronounced for less-developed countries during the period under investigation.2 The results confirm both treadmill orientations, indicating that economic development and militarization independently contribute to the environmental harms of nations. We also find support for ecologically unequal exchange theory, and that the environmental impacts of such exchanges are indeed more pronounced for less-developed countries than developed countries. Lastly, the results show that the relationships have become increasingly more ecologically unequal for less-developed countries, and that such intensifying relationships are largely driven by both the treadmill of production and the treadmill of destruction. Our study makes multiple noteworthy advances while drawing from prior sociological research on the environment. We employ newly available panel data and rigorous methods to investigate causal relationships. We consider how both the treadmill of production and the treadmill of destruction contribute in unique ways to ecological degradation. We extend and generalize the treadmill of destruction theory from the domestic to the international level, and we test competing assertions of ecological modernization theory and treadmill of production theory. We also make significant contributions to studies of ecologically unequal exchange, as we consider the importance of both the economy and military in relation to the structure of international trade and environmental degradation. As a result, we illuminate unique and persistent politicaleconomic factors that contribute to the consumption-based environmental demands of nations. We begin with a general discussion of international political economy and the specific theories of relevance for the panel analyses. In this, we outline the relationships that we investigate in the subsequent empirical investigation. Next, we describe the substantive characteristics of the ecological footprint as well as divergent temporal patterns of the footprints of developed 1. In our discussions we use the terms “nation” and “country” interchangeably. 2. Consistent with much prior comparative research, in this study less-developed countries are those in the bottom three quartiles of the World Bank’s (2007) income quartile classification of nations, and developed countries are in the top quartile.
SP5604_02.indd 622
10/3/09 1:58:17 PM
Ecological Footprints of Nations, 1975–2000
623
countries and less-developed countries relative to globally sustainable thresholds. Here, we also discuss the relationship between human well-being and resource consumption and its particular significance for many less-developed countries. Prior to presenting the results of the analyses, we describe the employed panel regression methods, variable definitions and data sources, and countries included in the tested models. Following the presentation and discussion of the research findings, we conclude by emphasizing the key results of the study and summarizing their theoretical relevance.
International Political Economy and Society/Nature Relationships Long before the modern era, natural resources were exploited and transported from one region to another (Chew 2001; Diamond 2005; Moore 2000, 2003). Nonetheless, ecological degradation tended to be regionalized, sometimes causing the collapse of particular civilizations, such as the Mayans. The ascendancy of global capitalism as an economic system successively and systematically integrated much of the world under a new form of social production and the logic of accumulation. While a global political economic system emerged, it became divided into nation-states occupying fundamentally different and often unequal positions in an international division of labor (Chase-Dunn 1998). Transfers in economic values are accompanied in multiple ways by ecological-material flows. Control of such flows (both economic and ecological) is a vital part of the global economy, which generates uneven ecological impacts that reflect the stratified interstate system. International political economy, within environmental sociology, attempts to uncover how ecological consequences and concomitant human well-being are related to the structure and relational characteristics of the contemporary interstate system. While there are a broad range of theoretical perspectives and important distinctions within the international political economy framework, below we focus on the arguments of a few particular traditions: ecological modernization (e.g., Mol 1995), treadmill of production (Schnaiberg 1980; Schnaiberg and Gould 1994), treadmill of destruction (Hooks and Smith 2004, 2005), and ecologically unequal exchange (e.g., Bunker 1984; Jorgenson 2006). We attempt to flesh out the distinctions and similarities between these perspectives regarding the economy, military, and the environment in order to highlight their conceptions of society/nature relationships.
Modernization and the Treadmill: Ecological Contradictions and the Economy Humans have transformed the world in a multitude of ways—many of which were unfathomable a couple hundred years ago—in order to meet “social needs.” Indeed, the transformation of nature is necessary to sustain life. Through this process, humans forge their history in relation to the physical world. Increasingly the economy has become one of the most important social structures that influence how societies interact with nature through the extraction and processing of natural resources. This involves the organization of labor, transportation, trade, and production—not to mention disposal of waste within an international economic system (Bunker and Ciccantell 2005; Frey 1994; Hornborg 2006; Pellow 2007). The ecological ramifications of these socioeconomic relationships are one of the key areas of study within environmental sociology. As is to be expected, major theoretical traditions are at loggerheads in regard to questions concerning economic development and environmental conditions. Here we elucidate one of the primary conflicts between ecological modernization and the treadmill of production perspectives. Following the framework and enthusiasm of W. W. Rostow (1964), modernization proponents contend that with time, investment, trade, and large-scale production, “traditional” nations should advance—socially and economically—along the lines of Western nations. Social and ecological concerns have arisen over time, and environmental economists have responded by
SP5604_02.indd 623
10/3/09 1:58:17 PM
624
JORGENSON/Clark
acknowledging that economic growth generates environmental harms (Grossman and Krueger 1995). Rather than revamp the trajectory of economic development, environmental concerns are seen as an outgrowth of ongoing social development (Hawken 1993). It is argued that growing consumer demand for “green products” partially represents emerging public concerns for a healthy environment, and with enough pressure and interest, economic development will increasingly involve more sustainable practices. Ecological modernization proponents, embracing the notion of “rational capitalism,” suggest that with state regulation and ongoing economic development a “third way” is possible for sustaining the current economic system (Mol 1995, 2001). Economic rationality will transform to incorporate ecological concerns and the importance of sustaining environmental processes that support life. This ecological rationality translates into new technologies that dematerialize production and society, thereby reducing the energy and material consumption required to sustain society within a growing economy (Mol 1995). Thus, ecological modernization argues that ongoing economic development as well as related industrialization and technology should produce the means to reduce ecological degradation, leading to a more green and sustainable society. The treadmill of production perspective (Gould, Pellow, and Schnaiberg 2008; Schnaiberg 1980), as well as other related orientations (e.g., Burkett 2006; Foster 2002; O’Connor 1998), takes issue with the assertions of ecological modernization theory. The treadmill of production argument focuses on how an economic system driven by endless growth, on an ever larger scale, generates widespread ecological degradation (Schnaiberg and Gould 1994). The economy is driven by an “insatiable appetite” to expand profit due to the “the inherent nature of competition and concentration of capital” (Schnaiberg 1980:230). As Joseph Schumpeter (2000:206), the great economist, notes, a capitalist economic system cannot stand still—it must expand if it is to survive. New technologies are employed to expand production and to reduce labor costs. Such growth requires raw materials and energy to operate, given that nature is used to fuel industry and to produce the commodities for the market (Gould et al. 2008). As a result, economic growth and the environment are caught in an “enduring conflict” (Schnaiberg and Gould 1994). An economy premised on constantly increasing the scale and intensity of production to expand profits runs up against a finite world, not to mention the problems associated with the generation of pollution. It increases the degradation of the environment as its bounty is consumed at a faster rate, potentially undermining the reproductive capacities of ecosystems (Clark and York 2005a, 2005b). Attempts to dematerialize society and decouple the economy from energy and material consumption have been caught in the “Jevons paradox”—as greater efficiency in resource use often leads to increased consumption of resources (Jevons 1906). In other words, gains made in improving the efficiency of energy use tend to be outstripped by the expansion of production—and the actual use of a raw material tends to expand (Clark and Foster 2001; Jorgenson 2009b; Polimeni et al. 2008; York 2006). Thus, the treadmill of production perspective argues that economic growth generates environmental problems, given the ceaseless demands placed upon nature. Resource consumption grows and environmental degradation worsens as development continues while the scale and intensity of production increases. In the analyses that follow, we consider the premises of both ecological modernization and the treadmill of production orientations. The former contends that ecological rationality significantly influences economic development and concomitant environmental conditions. Thus, it is argued that higher levels of economic development lead to declines in the consumption-based environmental impacts of nations. Conversely, the treadmill of production perspective proposes that economic development leads to higher consumption-based environmental demands. To assess these competing perspectives concerning economic development and the environment, and consistent with prior research on society/nature relationships, we employ GDP per capita and its quadratic as predictors in the tested panel models of the per capita ecological footprints of nations.
SP5604_02.indd 624
10/3/09 1:58:17 PM
Ecological Footprints of Nations, 1975–2000
625
Militarism and the Treadmill: Ecological Degradation and the Military The relationship between the economy, military, and state is complex (McNeill 1982; Tilly 1990). Both the position of states in the interstate system and domestic politics influence the development of militaries within nations (Hooks and McLauchlan 1992). For hegemonic powers, economic dominance generally precedes military supremacy, given that the former helps generate the social surplus to invest in the latter. In the twentieth century, especially following the Second World War, a transformation in the social position, the scale, and the capabilities of the military took place. With the growing clout of the Pentagon, in the United States the military became firmly situated in the power elite (Mills 2000). “Big science” was wedded to the military, as research and development were increasingly geared to addressing the technological needs of the Pentagon. The military infrastructure directed social resources to developing and deploying superior vehicles, planes, boats, and weapons for national security and potential use in future conflicts (Hooks and McLauchlan 1992). Newer equipment was made of special materials, and it was much more capital and resource intensive (Shaw 1988). Randall Collins (1981) notes that while modern technology has enhanced the speed of military operations and movements, it has also increased the expense of the military, in part due to the escalating costs associated with operating equipment. Through these transformations, the military—while tied in various ways to the overall economy—is not simply a reflection of commercial interests. It generates its own growth dynamics that require immense amounts of capital.3 While considering the above characteristics in contemporary contexts, recent comparative sociological research focuses on how the military influences levels of domestic income inequality (Kick, Davis, and Kentor 2006), economic development (Kentor and Kick 2008; Levy 1998), and other social outcomes (Jenkins and Scanlan 2001). However, despite its potential influence on the environment, there has been scarcely, with few exceptions, any theorization and empirical investigations in sociology regarding the environmental impacts of militarism. Gregory Hooks and Chad Smith (2004, 2005) are perhaps the most notable exceptions. Drawing upon the treadmill of production argument, they study the relationships between the military and environmental degradation.4 While recognizing that the military and economy are related, they contend that the former is somewhat independent of the latter. In this, they explain that the military has its own expansionary dynamics, which involve significant environmental and ecological costs. Given the logic of militarism and the emphasis on national security, the military produces a treadmill of destruction, which undermines environmental protection. Richard York (2008) notes that while the effects of warfare on the environment expose the potentially serious environmental harms that military institutions, technologies, and behaviors can produce, it does not capture the full extent of their overall ecological impacts (see also Jorgenson 2005; Jorgenson, Clark, and Kentor forthcoming). The treadmill of destruction perspective argues that militaries as social structures generate environmental degradation regardless of whether they are engaged in armed conflicts or not (Hooks and Smith 2005). Even outside of war, military institutions and their activities consume massive amounts of nonrenewable energy and other resources to sustain their overall infrastructures and hardware (Dycus 1996). Research and development as well as general maintenance of equipment also contribute to the environmental impacts of militaries. What is more, military operations require the use of land for bases, other forms of installations, and training exercises. The land employed to these ends has steadily increased over the last century (United Nations’ Center for Disarmament 1982). A network of military bases encompasses the globe, requiring a vast amount of resources to staff, operate, and transport equipment and personnel between destinations. 3. It is quite possible that the role of the military is different in developed countries and less-developed countries. However, here we are particularly concerned with the influence of the military on the consumption-based environmental impacts of nations. 4. However, Schnaiberg (1980) argues that military institutions help to sustain and expand the treadmill of production.
SP5604_02.indd 625
10/3/09 1:58:17 PM
626
JORGENSON/Clark
As part of the treadmill of destruction, the military stockpiles fuels and other materials. This also partially fosters the treadmill of production. To some extent, many industries are geared to meeting the material requirements of the military, including transportation equipment and communications technologies. A whole support economy exists to keep the military stocked with various supplies, including food for military personnel as well as large quantities of various organic and synthetic materials for uniforms and other specialized forms of clothing (Jorgenson 2005). In other words, the treadmill of destruction extends and further fuels the treadmill of production, given that social surplus is directed to supporting the military. In addition to consuming resources, the military generates different forms of waste, even during peacetime activities. In testing, supporting, and sustaining an arsenal of weapons, large amounts of toxic substances are known to pollute the land and water surrounding military bases and the immediate communities (LaDuke 1999; Shulman 1992; Thomas 1995). Additionally, the armed forces consume large amounts of fossil fuels that directly contribute to carbon dioxide emissions and the emission of other greenhouse gases known to impact global warming and climate change. Michael Renner (1991) indicates that land vehicles, aircrafts, sea vessels, and other forms of machinery burn 75 percent of all energy used by armed forces worldwide. The Pentagon, it is argued, is quite possibly the largest consumer of nonrenewable energy resources, especially fossil fuels, in the United States (Santana 2002). The global reach of the military through the network of military bases increases the natural resources consumed to sustain such an infrastructure. The treadmill of destruction highlights how militarization and related technological and infrastructural changes trump environmental concerns. Superior combat equipment is constructed for the purposes of national security and wartime activities, and energy efficiency in these matters is not a priority (Renner 1991). While Hooks and Smith (2004, 2005) apply their treadmill of destruction theory to the U.S. military and domestic conditions, we situate the orientation in an international comparative perspective. Although geopolitical competition often drives arms races as well as technological advances and infrastructural development, military development does not necessarily entail increases in armed forces’ personnel. For developed nations, which devote vast amounts of money to building their militaries through high technology, the environmentally damaging capabilities are likely a function of the weaponry and machinery that often requires fewer soldiers for possible use. In other words, more capital intensive militaries are likely to experience increases in their material infrastructure, become more spatially dispersed, or at least remain relatively constant (Kentor and Kick 2008). At the same time, the overall social space (i.e., population) occupied by more technologically advanced militaries often shrinks (e.g., Kick et al. 2006). In a related vein, international political economists (e.g., Chase-Dunn 1998; Kentor 2000) explain that nations with more capital intensive and thus technologically advanced militaries often utilize their global military reach to gain disproportionate access to natural resources. Thus, the treadmills of production and destruction may act in tandem, driving both production and military largesse ever forward, expanding the degradation of nature. In the subsequent panel analyses we assess key assertions of the treadmill of destruction perspective. To do so we employ a measure that quantifies the capital intensity of militaries: military expenditures per solider. The current study’s comparative formulation of treadmill of destruction theory would propose a positive association between nations’ consumption-based environmental demands and their military expenditures per soldier.
Division of Nations: Ecologically Unequal Exchange and Nature The historical incorporation of nations into the contemporary global economy has been uneven, establishing a system of nations stratified both economically and militarily (ChaseDunn 1998). Stephen Bunker and Paul Ciccantell (2005) point out that a central feature of
SP5604_02.indd 626
10/3/09 1:58:17 PM
Ecological Footprints of Nations, 1975–2000
627
the contemporary interstate system is the systematic exploitation of nature through a global division of labor. In a related vein, James O’Connor (1998:192) argues that “the concentration of industrial production, commerce, population, and so on, in developed zones” and “the concentration of agriculture and raw material extraction in underdeveloped zones” conditions processes of uneven development. Eduardo Galeano (1979), in describing the history of Latin America, notes that “once integrated into the world economy . . . The more a product is desired by the world market, the greater the misery it brings to the . . . peoples [and environment] whose sacrifice creates it” (pp. 72–73). From a political economy perspective, the division of nations and the international division of labor contribute to global inequalities, which are sustained through various unequal exchange relationships (e.g., Emmanuel 1972; Galtung 1971). Classical dependency perspectives assert that core nations drain off economic surplus at the expense of the more peripheral nations (Dos Santos 1971). The transfer of economic value entails the movement of ecological materials as well. Recent strands of environmental sociology and its sister disciplines have taken up this issue, analyzing how the structure of international trade contributes to ecological and environmental outcomes (e.g., Hornborg, NcNeill, and Martinez-Alier 2007; Jorgenson and Kick 2006). Largely building on the classic unequal exchange and uneven development traditions (e.g., Emmanuel 1972; Frank 1967), as well as Bunker’s (1984) insightful account of how natural resource extraction shaped the underdevelopment of the Amazon, the contemporary theory of ecologically unequal exchange asserts that through the “vertical flow of exports” from less-developed countries, more-developed and militarily powerful countries partially externalize their consumption-based environmental costs to the former, which in turn increase forms of environmental degradation within their borders while suppressing domestic levels of resource consumption, often well below globally sustainable thresholds (e.g., Hornborg 1998, 2001, 2006; Jorgenson 2006, 2009a; Rice 2007; Roberts and Parks 2007). We posit that the ecologically unequal exchange perspective intersects with both treadmill orientations. The treadmill of production propels the world economy toward constant expansion, demanding more and more resources to meet its insatiable appetite, especially in the articulated consumer markets of developed countries (Gould et al. 2008; see also Foster 1999, 2002). Similarly, in the interests of national security, technological innovation, political power, and geopolitical influence, the treadmill of destruction facilitates the increased consumption of resources by the nations’ militaries and their supporting sectors (Hooks and Smith 2005; Jorgenson 2005). What is more, increased military strength enhances access to the natural resources and sink capacity5 of less-powerful, underdeveloped nations (Chase-Dunn 1998). In other words, the stratified interstate system imposes a division of nature that replicates the flow of economic surplus and military power differences, while at the same time producing specific forms of ecological degradation that undermine the environmental conditions within nations. The environmental and ecological consequences of the structure of international trade are most pronounced for nations that rely heavily on exporting raw and/or barely processed materials, as well as those states with colonial legacies (e.g., Clark and Foster 2009; Roberts and Parks 2007). Extractive industries are typically the most environmentally destructive, generating enormous amounts of pollution while destroying whole ecosystems. Ecologically unequal exchange involves the disproportionate (and undercompensated) transfer of matter and energy, which enhances the social and economic complexity within the global North, at the expense of the global South due to the loss of these resources (Bunker 1984; Jorgenson, Austin, and Dick 2009; Hornborg 1998; Rice 2007). Generally speaking, the populations of more-developed and militarily powerful countries are positioned advantageously in the contemporary world economy, and thus more likely 5. Sink capacity refers to the ability of particular ecosystems to absorb and/or recycle the wastes generated by humans (e.g., forests absorbing carbon dioxide).
SP5604_02.indd 627
10/3/09 1:58:17 PM
628
JORGENSON/Clark
to secure and maintain favorable terms of trade allowing for greater access to the natural resources and sink capacity of bio-productive areas within less-developed countries. These advantageous positions facilitate the externalization of environmental costs of resource extraction and consumption to less-developed countries, and help create conditions where more-developed countries and those with more powerful militaries are able to over-utilize global “environmental space” (Rice 2007) as well as the global commons (e.g., the atmosphere and oceans). The misappropriation of environmental space suppresses resource consumption opportunities for many less-developed countries, which also impacts the health and well-being of their domestic populations (Rice 2008). Furthermore, given the structure and acceleration of both the treadmill of destruction and treadmill of production, it is quite likely that the consequences of these processes for less-developed countries are more pronounced than for developed countries, and possibly increase through time. The latter would be consistent with the arguments of globalization scholars who posit that recent upsurges in the globalization of trade contribute to increases in social and environmental inequalities between nations (e.g., Jorgenson and Kick 2006; Lofdahl 2002). To evaluate specific articulations of the ecologically unequal exchange orientation, in the panel analyses below we employ two weighted indices that quantify the relative extent to which the exports of a given nation are sent to (1) more economically developed nations and (2) more militarily powerful nations. We also incorporate interaction variables in the analyses to assess the extent to which the impacts of ecologically unequal exchange relationships vary between developed countries and less-developed countries as well as if their impacts for the latter change through time.
Ecological Footprints of Nations To assess the theoretical articulations outlined in the preceding sections, below we conduct analyses of the per capita ecological footprints of nations. The ecological footprint was primarily developed by Mathis Wackernagel and William Rees (1996), and quantifies the amount of biologically productive land required to support the consumption of renewable natural resources and assimilation of carbon dioxide waste products of a given population. Estimates for the ecological footprints of nations are available from the Global Footprint Network (2006a). These data allow for comparisons of a nation’s environmental demand relative to available domestic and global natural capital. The latter refers to the stock of natural assets, such as water and forest resources, producing a flow of services and resources for human societies. The national footprint estimates measure the bio-productive area required to support consumption levels of a given population from cropland, grassland and pasture, fishing grounds, and forests (Global Footprint Network 2006a). These measures also include the area required to absorb the carbon dioxide released when fossil fuels are burned, and the amount of area required for built infrastructure. Regarding the former, the carbon dioxide portion of the footprint deals explicitly with natural sequestration, which involves the biocapacity required to absorb and store the emissions not sequestered by humans, less the amount absorbed by the oceans.6 The ecological footprint is measured and reported in global hectares, and is calculated by adding imports to, and subtracting exports from, domestic production. In mathematical terms, consumption = (production + imports) - exports. This balance is calculated for more than 600 products, including both primary resources and manufactured products that are derived from them. The calculations also use yield factors to take into account national differences in biological productivity and equivalence factors to take into account differences in 6. A new aspect of the ecological footprint is the nuclear footprint subcomponent, which accounts for less than 4 percent of the global footprint in 2000, and this percent is even lower for earlier years.
SP5604_02.indd 628
10/3/09 1:58:17 PM
Ecological Footprints of Nations, 1975–2000
629
5.5
4.75
4
3.25
2.5
1.75
1
1975
1980 Median Footprint Per Capita, LDCs (54)
1985
1990
Median Footprint Per Capita, DCs (15)
1995
2000
Global Biocapacity Per Capita
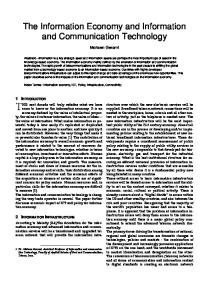
Figure 1 • The Ecological Footprints of Nations and Global Biocapacity Per Capita, 1975–2000
world average productivity among different land types. With their increasing availability and empirical utility, social scientists have tested propositions derived from various theoretical perspectives in macro-comparative analyses of the ecological footprints of nations (e.g., Dietz, Rosa, and York 2007; Hornborg 2006; Jorgenson 2003, 2005, 2009a; Jorgenson and Burns 2007; Jorgenson et al. 2009; Ozler and Obach 2009; Rice 2007; York, Rosa, and Dietz 2003). The per capita footprints of nations can be compared to the global biocapacity per capita, which is calculated by dividing all the biologically productive land and sea on earth by the total world population, which provides a general estimate of human sustainable levels of consumption. This global indicator of sustainable consumption was also developed by Wackernagel and associates (2002) and is available from the Global Footprint Network. Figure 1 provides the median footprint per capita for 54 less-developed countries (labeled as LDCs), the median7 footprint per capita for 15 developed countries (labeled as DCs),8 and the global biocapacity per capita. These three measures are presented in 5-year intervals from 1975 to 2000.9 While the median per capita footprint for the developed countries in the data set increased by 7. We present median values due to the positively skewed distributions. 8. We exclude countries that are identified by the Global Footprint Network to have inconsistencies in their footprint estimates that disallow for valid temporal comparisons. As a reminder, less-developed countries are those in the bottom three quartiles of the World Bank’s (2007) income quartile classification of nations, and developed countries are in the top quartile. All countries included in the descriptive analyses in Figure 1 as well as in the subsequent panel regression analyses are listed in Appendix A. 9. It is quite likely that global-level population growth and forms of environmental degradation partially contribute to declines in the global biocapacity per capita.
SP5604_02.indd 629
10/3/09 1:58:23 PM
630
JORGENSON/Clark
24.94 percent from 4.13 hectares in 1975 to 5.16 hectares in 2000, the median per capita footprint for the less-developed countries in the sample increased by only 13.79 percent from 1.16 hectares in 1975 to 1.32 hectares in 2000. Besides the growing gap between the midpoints for these two groups of nations, the median per capita footprints for the developed countries were well above (and increasingly so) the global biocapacity per capita for each of the time points, while the median per capita footprint for the less-developed countries remained below the globally sustainable threshold for the entire 25-year period.10 As an indicator of resource demand, the ecological footprint does not measure human well-being directly, but nations with the lowest per capita footprints tend to have the relatively highest rates of infant and child mortality as well as malnutrition and poverty (Jorgenson 2003; Rice 2008). The human health and general well-being of populations are largely a function of access to adequate shelter as well as consumption of food and other bio-resources, all of which are included to some extent in the composite footprint measures. Thus, the per capita footprints of nations could be treated as a proxy measure of human quality of life, and many less-developed countries have ecological footprints that could increase without becoming globally unsustainable while enhancing the well-being of domestic populations. Of additional relevance, a common observation in related bodies of literature is the resource consumption/ environmental degradation paradox, which highlights the inverse relationship between the per capita footprints of nations and domestic levels or rates for particular forms of environmental degradation, such as forest degradation and industrial water pollution (e.g., Jorgenson et al. 2009; Rice 2007). It is argued that these inverse associations are largely the result of ecologically unequal exchange relationships in comparative perspective as well as relative levels of economic development and other structural factors, including military power (e.g., Bunker 1984; Hornborg 2001; Jorgenson 2006; Rice 2007; Roberts and Parks 2007). However, prior research fails to simultaneously assess the extent to which these particular structural factors and interrelationships impact environmental and ecological outcomes. Below, we conduct quantitative comparative analyses in an attempt to help resolve these shortcomings.
Analyses Data Set We analyze a panel data set consisting of measurements for 53 developed and less-developed countries from 1975 to 2000. These are the countries in which data are available for the dependent variable and key independent variables. Data are point estimates at 5-year intervals (1975, 1980, 1985, 1990, 1995, 2000). To maximize the use of available data, we allow sample sizes to vary among the models. For the tested models that include both developed countries and less-developed countries, overall sample sizes range from 297 observations to 318 observations, with a minimum of 3 and a maximum of 6 observations per country. For the analyses restricted to less-developed countries, which we conduct to assess if the effects of ecologically unequal exchange relationships change through time, the overall sample sizes range from 213 to 234 with the same minimum and maximum numbers of observations per country as the models that include developed countries as well. Appendix A lists all countries included in the study.
Random Effects Models For methodological and substantive reasons, we estimate generalized least squares (GLS) random effects (RE) models with robust standard errors for all reported analyses 10. In unreported sensitivity analyses, we compare nations in the upper quartile of the distribution of military expenditures per soldier to all other nations. The temporal trajectories are very similar to those reported in Figure 1.
SP5604_02.indd 630
10/3/09 1:58:23 PM
Ecological Footprints of Nations, 1975–2000
631
(Frees 2004; Hsiao 2003). In panel studies where the time dimension is relatively small (e.g., six time points or less), a RE modeling approach is often preferable to fixed effects (FE) because fewer degrees of freedom are necessary to account for the subject-specific parameters (Frees 2004:78). When one or more independent variables have relatively low variation across time per case, the latter type of model can suffer from extreme multicollinearity since variables under these conditions will likely be highly collinear with the country-specific fixed effects. FE models are also inappropriate for perfectly time-invariant variables of possible relevance, and the estimation algorithm for the FE model can be interpreted substantively as “throwing away” theoretically relevant between-country variation present in the data. Results of the Hausman test statistic (all nonsignificant) also indicate that the RE modeling approach is preferred to FE for the current analyses. However, we note that elsewhere we re-estimate all appropriate reported models with FE panel regression (minus the tropical dummy variable discussed below), and the findings of particular interest for this study are very similar to the results of the GLS RE models. Using relevant diagnostics, we also conclude that the overall sample in the current study does not contain any overly influential cases.
Dependent Variable The dependent variable for the analyses is the updated estimates for the per capita ecological footprint. These data, which are logged to minimize skewness, were obtained directly from the Global Footprint Network. All other variables in the study that are logged (ln) are done so for analogous reasons. For a detailed description of the calculations used for the updated footprint estimates, see the 2006 Living Planet Report (Global Footprint Network 2006b).
Independent Variables of Particular Interest We include gross domestic product per capita (GDP per capita) as a measure of a nation’s level of economic development, affluence, and capital intensity. These data, which are logged (ln), are measured in 2000 constant U.S. dollars and obtained from the World Bank (2007). The quadratic for GDP per capita (i.e., GDP per capita squared) is included to further assess the relationship between consumption-based environmental demand and economic development. To minimize collinearity, we center the measures by subtracting the mean of GDP per capita (ln) before squaring them (Neter, Wasserman, and Kutner 1990). These two measures of economic development are employed to evaluate the competing assertions of ecological modernization theory and treadmill of production theory. Military expenditures per soldier (ln) are included as a measure of the capital intensity of militaries as well as a nation’s relative military strength (Jorgenson 2005; Kentor and Kick 2008; Kick et al. 2006). This variable is calculated by dividing total military expenditures by total military personnel. Total military personnel estimates are gathered from the World Bank (2007) and total military expenditures are obtained from the Stockholm International Peace Research Institute (SIPRI) (1977, 1984, 1987, 1991, 2000). Military expenditures data include all current capital expenditures on the armed forces, including peacekeeping forces; defense ministries and other government agencies engaged in defense projects; paramilitary forces, if these are judged to be trained and equipped for military operations; and military space activities. More specifically, such expenditures include operation and maintenance; procurement; military research and development; military and civil personnel, including retirement pensions of military personnel and social services for personnel; and military aid (in the military expenditures of the donor country). To minimize collinearity, we regress these data on GDP per capita, and use the residuals in many of the reported models to assess the effects of military expenditures per soldier on the per capita footprints of nations, entirely independent of economic development. Other cross-national investigations employ this “residualizing”
SP5604_02.indd 631
10/3/09 1:58:23 PM
632
JORGENSON/Clark
technique for analogous reasons (e.g., Jorgenson 2005; Kentor and Kick 2008).11 As a reminder, treadmill of destruction theory would posit a positive association between per capita ecological footprints and military expenditures per soldier. We calculate and use two weighted indices to evaluate key assertions of ecologically unequal exchange theory. The first quantifies the relative extent to which a country’s exports are sent to more-developed countries (measured as per capita GDP). The second measures the relative extent to which a country’s exports are sent to nations with more powerful militaries (measured as military expenditures per soldier). We refer to these indices as export flows weighted by GDP per capita and export flows weighted by military expenditures per soldier. Both indices are logged (ln). Data required for the construction of the indices include relational measures in the form of exports between sending and receiving countries, and attributional measures of economic development and military expenditures for receiving countries in the form of per capita gross domestic product (GDP) and military expenditures per soldier (MXPS). The exports data are taken from the International Monetary Fund’s 2003 Direction of Trade Statistics CD ROM database, and are reported in U.S. dollars. The per capita GDP and MXPS data are derived from the same sources as discussed above. The weighted indices are calculated as: N
Wi =
∑p a
ij j
j=1
Where: Wi = weighted export flows for country i pij = proportion of country i’s total exports sent to receiving country j aj = GDP per capita or military expenditures per soldier of receiving country j To calculate each of the two measures, the first step is to convert the flows of exports to receiving countries into proportional scores. More specifically, the exports to each receiving country are transformed into the proportion of the sending country’s total exports. The second step for the first index involves multiplying each proportion by the receiving country’s per capita GDP, while the second step for the other index is to multiply each proportion by the receiving country’s military expenditures per solider. The third step in the calculation of both indices is to sum the products of the calculations in step two. The sum of these products for the first index quantifies a nation’s relative level of exports sent to more-developed countries, and the sum for the second index measures a nation’s relative level of exports sent to countries with more capital intensive and thus more powerful militaries. To minimize collinearity, we regress the export flows weighted by MXPS on the export flows weighted by GDP per capita and include the residuals as measures of the former in models that include both weighted indices.12 In order to assess the theoretically derived notion that the impacts of different forms of ecologically unequal exchange are more pronounced for less-developed countries than for developed countries, we calculate and use slope-dummy interactions (Hamilton 1992) between the weighted export flows measures and a dummy-coded variable for less-developed countries.13 The inclusion of these interaction variables involves a slightly more complex interpretation of the effects. The coefficient for either weighted export flows measure is the unit change in per capita 11. In separate analyses available upon request, we instead residualize GDP per capita on military expenditures per soldier. Results of the panel models are substantively identical to the reported findings. 12. In unreported sensitivity analyses, we reverse the residuals of these two predictors and the results of the panel models are substantively identical to the reported findings. 13. In separate analyses available upon request, we create and analyze a slope-dummy interaction between the weighted export flows indices and a dummy variable for low military expenditures per solider, and the results are consistent with the reported findings.
SP5604_02.indd 632
10/3/09 1:58:24 PM
Ecological Footprints of Nations, 1975–2000
633
footprints for developed countries (the reference category) for each unit increase in the former for the same year. The effect of export flows (weighted by GDP per capita or MXPS) for less-developed countries equals the sum of the coefficients for developed countries and the appropriate interaction term, labeled as “export flows weighted by GDP pc (ln) X LDCs” or “export flows weighted by MXPS (ln) X LDCs.” The test of statistical significance for the slope-dummy coefficients determines whether the slope for the particular interaction and the reference category—in this case developed countries—differ significantly. We also calculate and employ slope-dummy interactions between time and the weighted export flows measures14 in analyses restricted to less-developed countries to assess if the impact of either type of the latter on the per capita footprints of nations increases or decreases over time.15 For the analyses in which they are employed, the coefficient for either form of weighted export flows is the unit change in per capita footprints in 1975 for each unit increase in the former for the same year. The effects for the other five time points (1980, 1985, 1990, 1995, 2000) equals the sum of the coefficients for 1975 and the appropriate interaction term. The test of statistical significance for the slope-dummy coefficients determines whether the slope for the particular interaction and the reference category—in this case 1975—differ significantly.
Additional Independent Variables Included in the Reported Analyses We include measures of urban population, which quantifies the percent of a country’s population residing in urban areas. These data are gathered from the World Bank (2007). To minimize collinearity, we residualize urban population by regressing these data on GDP per capita. We use the residuals in the reported models to assess the effects of urban population on the per capita footprints of nations, entirely independent of economic development. Urban political-economy perspectives commonly argue that due to the scale and intensity of their built infrastructure as well as the productive activities and embedded articulated consumer markets, more urban areas exhibit higher consumption-based environmental demands (e.g., Dickens 2004; Molotch 1976). We include a dummy-coded latitude measure—“tropical”—to control for climate conditions. Countries where the predominant latitude is less than 30 degrees from the equator are coded as tropical. Temperate and arctic countries, meaning those where the predominant latitude is greater than 30 degrees from the equator, are the reference category. Conventional wisdom suggests that more resources are consumed to sustain societies in colder climates. Thus, one would assume that resource consumption increases the further a nation is from the equator, and prior research supports this assumption (e.g., Dietz et al. 2007; York et al. 2003). All models include unreported period-specific intercepts (period effects), which control for the potential unobserved heterogeneity that is cross-sectionally invariant within years. Table 1 provides descriptive statistics and bivariate correlations for the variables included in the reported analyses of developed countries and less-developed countries, and Table 2 reports the same information for the sample restricted to only less-developed countries.16 While the employed residualizing technique eliminates potential collinearity problems for many predictors in the analyses reported below, as illustrated by Tables 1 and 2, some moderate 14. Other recent sociological investigations employ slope-dummy interactions between time and theoretically derived predictors for analogous reasons (e.g., Jorgenson, Dick, and Mahutga 2007; Jorgenson and Kuykendall 2008). 15. In unreported sensitivity analyses, we estimate these models for the sample restricted to nations with low military expenditures per soldier and the results are consistent with the reported findings. 16. For the sample restricted to less-developed countries, GDP per capita and military expenditures per soldier are correlated at .510. While this moderately strong correlation is less than for the sample of developed and less-developed countries combined, for purposes of consistency and to assess its effect entirely independent of economic development, we elect to use the residualized form of military expenditures per solider in the second set of panel analyses as well. However, we note that the use of their nonresidualized form yields substantively identical findings for the sample of less-developed countries.
SP5604_02.indd 633
10/3/09 1:58:24 PM
SP5604_02.indd 634
-.813 -.058 -.029
-.817 -.034 .003
11. 12. 13.
.505 1.661 2.438 1.295 .759 1.000 .496 .308 .584 4.220 4.867 .288 .260
7.694 .000 .000
SD
-.633 .041 .036
.365 .378 -.238 -.108 .122 .126 -.636
3.
1.103 7.586 2.752 9.456 .000 .000 .434 9.367 10.768 6.695
Mean
.173 .810 .000 .000 -.624 .193 .139 -.816
.895 .311 .731 .009 .087 -.673 .074 .048 -.818
1. 2. 3. 4. 5. 6. 7. 8. 9. 10.
2.
-.777 -.114 -.107
.586 -.062 -.372 .113 .042 -.773
4.
.000 -.810 -.810
-.933 .144 .236
Min
.557 .009 -.028
-.022 -.015 .558
7.
.450 4.450 .000 5.590 -2.731 -3.163 .000 8.081 9.301 .000
.251 .087 .098
-.123 .140 .164 .242
6.
.549 .158 .453 .084 -.121 -.293 .268 -.792 -.162 -.955
Skew
-.207 -.117 -.145
-.105 .229 -.076 -.124 -.196
5.
-.091 .000 -.098
.870 -.113
8.
11.950 1.439 1.439
2.370 10.510 .981 12.250 1.785 2.328 1.000 10.071 11.950 10.071
Max
-.018 .493 .360
-.059
9.
.998 .080 .020
10.
297 297 297
318 318 318 318 318 318 318 297 297 297
N
.125 .070
11.
12.
.903
Notes: MXPS refers to military expenditures per soldier; SD refers to standard deviation; skew refers to skewness; min refers to minimum value; max refers to maximum value. To minimize collinearity, GDP per capita is centered and then squared.
Ecological footprint per capita (ln) GDP per capita (ln) GDP per capita (ln) squared MXPS (ln) MXPS (ln), residualized Urban population, residualized Tropical Export flows weighted by GDP per capita (ln) Export flows weighted by MXPS (ln) Export flows weighted by GDP per capita (ln) X LDCs Export flows weighted by MXPS (ln) X LDCs Export flows weighted by MXPS (ln), residualized Export flows weighted by MXPS (ln) X LDCs, residualized
Ecological footprint per capita (ln) GDP per capita (ln) GDP per capita (ln) squared MXPS (ln) MXPS (ln), residualized Urban population, residualized Tropical Export flows weighted by GDP per capita (ln) Export flows weighted by MXPS (ln) Export flows weighted by GDP per capita (ln) X LDCs Export flows weighted by MXPS (ln) X LDCs Export flows weighted by MXPS (ln), residualized Export flows weighted by MXPS (ln) X LDCs, residualized
1.
Table 1 • Bivariate Pairwise Correlations and Univariate Descriptive Statistics for the Sample of Developed and Less-Developed Countries
634 JORGENSON/Clark
10/3/09 1:58:24 PM
SP5604_02.indd 635
Ecological footprint per capita (ln) GDP per capita (ln) MXPS (ln), residualized Urban population, residualized Tropical Export flows weighted by GDP per capita (ln) Export flows weighted by GDP per capita (ln) X 1980 Export flows weighted by GDP per capita (ln) X 1985 Export flows weighted by GDP per capita (ln) X 1990 Export flows weighted by GDP per capita (ln) X 1995 Export flows weighted by GDP per capita (ln) X 2000 Export flows weighted by MXPS (ln) Export flows weighted by MXPS (ln) X 1980 Export flows weighted by MXPS (ln) X 1985 Export flows weighted by MXPS (ln) X 1990 Export flows weighted by MXPS (ln) X 1995 Export flows weighted by MXPS (ln) X 2000 .063
.014 -.026 -.011 -.140 .021 -.222
.007
14. 15. -.036 16. -.010 17. -.017
.001
.038
.055
13.
.176
.145
.090
.002
.001
.005
.311 -.182
.264 -.181
.054 -.181
.988
.862 -.362
.310 -.182
.020 -.051 -.166
.233
.000
.262 -.181
.193 -.025
.055 -.219
12. -.149
.176
.001
.049 -.182
.041 -.222
.020 -.224
11. -.018
.146
.005
.124 -.143
-.013 -.139
10. -.010
.089
-.030
9. -.035 .004
.017 -.048 -.166
.193 -.023
.015
.010
8.
7.
.041 -.219
6.
.123 -.141
.098
5.
.039
4.
.056
3.
7.
2.
.000 .000 -.011 -.407 .302 -.185 .067 -.145 .188
1.
2. .729 3. -.109 4. .227 5. -.540 6. -.189
1.
-.177
-.180
-.182
.963
-.166
.024
-.181
-.180
-.181
8.
-.202
-.200
.977
-.188
-.182
.016
-.202
-.200
9.
-.206
.981
-.200
-.182
-.180
.404
-.200
10.
.970
-.202
-.205
-.162
-.179
.400
11.
.406
.407
.027
.025
-.363
12.
-.182
-.188
-.184
-.166
13.
Table 2 • Bivariate Pairwise Correlations and Univariate Descriptive Statistics for the Sample Restricted to Less-Developed Countries 15.
16.
(continued)
-.193 -.200 -.203
-.184 -.201
-.180
14.
Ecological Footprints of Nations, 1975–2000 635
10/3/09 1:58:25 PM
SP5604_02.indd 636
.324 1.107 .763 12.836 .492 .334 3.156 3.203 3.497 3.553 3.567 .602 3.516 3.710 4.016 4.198 4.197
1.255 1.274 1.559 1.586 1.590 10.728 1.398 1.475 1.789 1.872 1.872
SD
.860 6.778 .000 .000 .590 9.333
Mean
1.807
1.806
1.812
2.129
.000
.000
.000
.000
.000
9.301
-.116 2.128
.000
.000
.000
.000
.000
.450 4.450 -2.876 -47.271 .000 8.081
Min
1.805
1.804
1.805
2.128
2.129
1.065 .042 -.486 -1.182 -.367 -.713
Skew
11.942
11.920
11.580
11.260
10.730
11.942
10.070
10.000
9.850
9.7100
9.630
.180 8.950 1.643 25.800 1.000 10.071
Max
Notes: MXPS refers to military expenditures per soldier; SD refers to standard deviation; skew refers to skewness; min refers to minimum value; max refers to maximum value.
Ecological footprint per capita (ln) GDP per capita (ln) MXPS (ln), residualized Urban population, residualized Tropical Export flows weighted by GDP per capita (ln) Export flows weighted by GDP per capita (ln) X 1980 Export flows weighted by GDP per capita (ln) X 1985 Export flows weighted by GDP per capita (ln) X 1990 Export flows weighted by GDP per capita (ln) X 1995 Export flows weighted by GDP per capita (ln) X 2000 Export flows weighted by MXPS (ln) Export flows weighted by MXPS (ln) X 1980 Export flows weighted by MXPS (ln) X 1985 Export flows weighted by MXPS (ln) X 1990 Export flows weighted by MXPS (ln) X 1995 Export flows weighted by MXPS (ln) X 2000
Table 2 • (Continued) N
213
213
213
213
213
213
213
213
213
213
213
234 234 234 234 234 213
636 JORGENSON/Clark
10/3/09 1:58:25 PM
Ecological Footprints of Nations, 1975–2000
637
correlations remain for couplings of different variables in both samples. Thus, in sensitivity analyses available upon request, we estimate all models for both samples using regular OLS regression, and we evaluate the variance inflation factors (VIFs) for the predictors. All VIFs are well within acceptable limits (i.e., below a value of 5), indicating the reported RE models are unlikely affected by multicollinearity.
Results and Discussion Table 3 reports the findings for the panel analyses of the data set that combines lessdeveloped countries and developed countries. Ten tested models are reported. We provide unstandardized and standardized coefficients as well as robust standard errors for all predictors. We also report constants, r-square within, r-square between, r-square overall17, sample size (N), and the minimum and maximum numbers of observations per country for each model. Model 1 consists of GDP per capita, urban population, and the tropical dummy variable, while Model 2 also includes the centered quadratic for GDP per capita. Model 3 consists of military expenditures per soldier as well as the tropical and urban population controls. Model 4 includes both GDP per capita and military expenditures per soldier as well as urban population and the tropical dummy predictor. All remaining models include the four predictors in Model 4 as well as one to four additional independent variables. Export flows weighted by GDP per capita is the additional predictor in Model 5, while export flows weighted by military expenditures per soldier is the additional predictor in Model 6. Model 7 consists of both weighted export flows measures. In Model 8, we include export flows weighted by GDP per capita as well as its slope-dummy interaction with less-developed countries. Model 9 does the same as Model 8, but for the export flows measures weighted by military expenditures per soldier. Model 10 is the most fully saturated of the series, and consists of all predictors included in any of the preceding models, with the exception of the quadratic for GDP per capita. Unreported period-specific intercepts are included in each tested model as well, and Models 8 through 10 also include an unreported dummy variable for less-developed countries, which controls for the possibility of differing intercepts (and their potential impacts on the differing slopes of interest) for this group of countries relative to the developed countries (Brambor, Clark, and Golder 2006). The dummy variable is the same as the dichotomous measure used in the creation of the slope-dummy interactions between the weighted export flows indices and lessdeveloped countries. We begin with a brief summary of the associations between the outcome and the two statistical controls.18 The effect of urban population on the per capita footprints of nations is positive in all ten models. This finding, which supports urban political-economy assertions, is also consistent with prior comparative research on society/nature relationships (e.g., Jorgenson 2003). The effect of the tropical dummy variable on the outcome is also statistically significant in all reported models, but the association between them is negative. Thus, and all else being equal, consumption-based environmental impacts do indeed increase the further a nation is from the equator. Besides corresponding with other cross-national investigations (e.g., York et al. 2003), these results underscore the importance in considering the extent to
17. R-square within refers to the explained variation within units (i.e., countries), r-square between quantifies the explained variation between units (i.e., countries), and r-square overall refers to the overall explained variation in the panel model (Hamilton 2006). 18. In additional unreported models we include measures of democratization, state strength (government expenditures as percent GDP), secondary education levels, literacy rates, manufacturing as percent GDP, services as percent GDP, and environmental INGO presence. The effects of all these controls on the outcome are nonsignificant and their inclusions do not substantively change the presented results of interest.
SP5604_02.indd 637
10/3/09 1:58:25 PM
638
JORGENSON/Clark Table 3 • Unstandardized Coefficients for the Regression of Per Capita Ecolgical Footprints on Selected Independent Variables: Random Effects Model Estimates for 3 to 6 Observations on 53 Developed and Less-Developed Countries, 1975–2000 Model 1 GDP per capita (ln)
.138** (.013) [.455]
Model 2 .169** (.013) [.559]
Model 3
Model 4
Model 5
Model 6
Model 7
Model 8
Model 9
Model 10
.135** (.013) [.388]
.175** (.015) [.470]
.181** (.016) [.488]
.181** (.015) [.489]
.142** (.016) [.366]
.147** (.015) [.373]
.152** (.016) [.384]
GDP per .032** capita (ln) (.005) squared [.155] Military .037** .151** .184** .190** .191** expenditures (.008) (.014) (.014) (.015) (.016) per soldier (ln) [.094] [.260] [.336] [.349] [.350] Urban .003** .002* .005** .003** .004** .005** .005** (.001) (.001) (.001) (.001) (.001) (.001) (.001) population [.072] [.042] [.240] [.079] [.102] [.122] [.123] Tropical -.387** -.307** -.506** -.382** -.301** -.284** -.283** (.065) (.065) (.071) (.065) (.063) (.064) (.063) [-.380] [-.302] [-.497] [-.375] [-.295] [-.279] [-.278] Export flows -.060** -.057** weighted by (.021) (.021) [-.037] [-.035] GDP pc (ln) Export flows weighted by GDP pc (ln) X LDCs Export flows -.036** -.040* weighted by (.010) (.019) [-.041] [-.078] MXPS (ln) Export flows weighted by MXPS (ln) X LDCs Constant .221 -.142 .724 -.161 .062 -.185 -.046 R2 within .157 .209 .023 .157 .185 .191 .191 R2 between .787 .851 .696 .757 .830 .831 .830 R2 overall .774 .838 .681 .744 .818 .819 .819 N 318 318 318 318 297 297 297 Min/max 6/6 6/6 6/6 6/6 3/6 3/6 3/6 # of obs.
.140** .145** (.015) (.016) [.273] [.284] .003** .004** (.001) (.001) [.084] [.110] -.171** -.148* (.062) (.062) [-.168] [-.145] -.016 (.022) [-.010] -.047** (.008) [-.395]
.149** (.015) [.293] .005** (.001) [.121] -.155* (.063) [-.153] -.034 (.023) [-.020] -.046** (.008) [-.386]
-.002 (.012) [-.001] -.043** (.007) [-.417]
.055 (.036) [.031] -.120** (.041) [-.060]
.147 .244 .873 .862 297 3/6
.393 .241 .876 .865 297 3/6
.302 .208 .872 .861 297 3/6
Notes: All models include unreported period-specific intercepts; *p < .05 **p < .01 (two-tailed tests). Unstandardized coefficients flagged for statistical significance; robust standard errors are in parentheses; standardized coefficients are in brackets; MXPS refers to Military Expenditures per soldier; pc refers to per capita; military expenditures per soldier are residualized on GDP per capita (except in Model 3); urban population are residualized on GDP per capita (except in model 3); export flows weighted by MXPS are residualized on export flows weighted by GDP pc in Models 7 and 10; models 8–10 include unereported LDCs dummy variable
which ecological milieu condition the human dimensions of environmental change.19 We now turn to the results of interest for the current study. Level of economic development, measured as GDP per capita, is found to positively affect the per capita footprints of nations, and the positive association is statistically significant in 19. In sensitivity analyses available upon request, we also include arable land per capita as an ecological control. The effect of this biogeography measure on the outcome is positive and statistically significant, but its inclusion does not substantively alter the reported findings.
SP5604_02.indd 638
10/3/09 1:58:26 PM
Ecological Footprints of Nations, 1975–2000
639
all relevant models. Further, as indicated by Model 2, its centered quadratic also positively affects per capita consumption-based environmental demand. The positive effects of per capita GDP in both forms on the per capita ecological footprints of nations provides strong support for the treadmill of production perspective. Economic development remains tied to growing demands on the environment, increasing resource consumption and concomitant ecological degradation. Given that these results support treadmill of production assertions, they challenge the ecological modernization position that suggests that economic growth leads to the dematerialization of society—at least in cross-national contexts.20 Similarly, the consumptionbased environmental impacts of nations are positively associated with military expenditures per soldier, and this positive association is statistically significant in Models 3 through 10. The positive effects here support the treadmill of destruction argument: as militaries become more capital intensive, additional consumption-based demands are placed on the environment.21 Thus, economic development and military technological power in the context of expenditures per soldier both condition the consumption-based environmental harms of nations.22 Whether it is the economic treadmill of production or the military treadmill of destruction, the expansion of either requires vast amounts of resources, taxing ecological conditions. Models 5 through 7 indicate that both forms of ecologically unequal exchange relationships under investigation are of relevance when considering levels of resource consumption in comparative perspective. More specifically, the effects of the two weighted export flows measures on the per capita footprints of nations are negative. What is more, Model 7 suggests that structural relationships between relatively more and less militarily powerful nations have unique impacts on resource consumption, independent of structural relationships between more and less economically developed nations. The results of Models 8 through 10 indicate that the effects of ecologically unequal exchange relationships in the context of economic and military power are much more pronounced for less-developed countries than developed countries. In particular, the slope-dummy interactions between both weighted export flows measures and less-developed countries are negative in the individual models (Models 8 and 9) as well as Model 10, which includes both interactions as well as the main effects. Considering that the per capita ecological footprints of many less-developed countries are below globally sustainable thresholds, and that resource use is fundamentally tied to basic needs and human quality of life, the negative effects of the interactions underscore the ecologically unequal and underdevelopmental consequences of such interrelationships for many less-developed countries.23 Table 4 presents the findings for the analyses that are restricted to less-developed countries. The focus here is if the impacts of both types of ecologically unequal exchange relationships for less-developed countries changed during the 1975 to 2000 period. A total of five models are reported, and we provide the same measurements as in Table 3 for all predictors (e.g., unstandardized coefficients, robust standard errors) as well as for the individual models (e.g., constants, N). The first model is treated and labeled as a baseline, and consists of GDP per capita, military expenditures per soldier, urban population, and the tropical dummy variable. These predictors are included in the other four reported models (Models 1 through 4). Model 1 also includes export flows weighted by GDP per capita, while export flows weighted by military expenditures per soldier is added to Model 3. Models 2 and 4 include the series 20. On efficiency grounds, we exclude the quadratic of GDP per capita from the remaining models. However, in unreported sensitivity analyses its inclusion does not substantively alter any of the other reported findings for the full sample or the models restricted to less-developed countries. 21. In additional analyses we include military expenditures as percent of GDP. The effect of this predictor is positive and statistically significant but relatively weak in magnitude, and its inclusion does not substantively alter the reported findings. For purposes of brevity we elect to exclude these models from the reported findings. 22. In unreported sensitivity analyses we include the centered quadratic for military expenditures per soldier. Like the centered quadratic for GDP per capita, its effect is positive and statistically significant. 23. To consider potential regional effects and geographic relationships, in unreported models available upon request we include a series of dummy variables for continents. The inclusion of these regional controls does not substantively alter the reported findings of interest.
SP5604_02.indd 639
10/3/09 1:58:26 PM
640
JORGENSON/Clark Table 4 • Unstandardized Coefficients for the Regression of Per Capita Ecological Footprints on Selected Independent Variables: Random Effects Model Estimates for Three to Six Observations on 39 Less-Developed Countries, 1975–2000 Export Flows Weighted by GDP pc Baseline GDP per capita (ln)
Military expenditures per soldier (ln) Urban population
Tropical
.099** (.015) [.291] .065** (.012) [.178] .001 (.001) [.057] -.258** (.071) [-.392]
.147** (.017) [.432] .085** (.011) [.232] .003** (.001) [.125] -.193** (.058) [-.293] -.093** (.025) [-.097]
.432 .125 .599 .575 234 6/6
1.096 .172 .709 .675 213 3/6
Export flows weighted (ln) Export flows weighted (ln) X 1980 Export flows weighted (ln) X 1985 Export flows weighted (ln) X 1990 Export flows weighted (ln) X 1995 Export flows weighted (ln) X 2000 Constant R2 within R2 between R2 overall N Min/Max # of obs.
Model 1
Export Flows Weighted by MXPS
Model 2
Model 3
Model 4
.177** (.016) [.521] .099** (.011) [.270] .005** (.001) [.232] -.160** (.055) [-.243] -.023 (.027) [-.022] .001 (.002) [.012] -.004 (.002) [-.035] -.007** (.002) [-.079] -.007** (.003) [-.079] -.010** (.002) [-.108] .334 .264 .694 .666 213 3/6
.162** (.017) [.478] .093** (.012) [.253] .004** (.001) [.177] -.175** (.058) [-.266] -.060** (.013) [-.112]
.178** (.016) [.523] .099** (.011) [.271] .006** (.001) [.234] -.159** (.057) [-.241] -.020 (.023) [-.036] .001 (.002) [.013] -.002 (.003) [-.025] -.006* (.003) [-.071] -.005 (.003) [-.063] -.007* (.003) [-.094] .323 .265 .696 .667 213 3/6
.784 .198 .712 .679 213 3/6
Notes: All models include unreported period-specific intercepts; *p < .05 **p < .01 (two-tailed tests). Unstandardized coefficients flagged for statistical significance; robust standard errors are in parentheses; standardized coefficients are in brackets; MXPS refers to military expenditures per soldier; military expenditures per soldier and urban population are both are residualized on GDP per capita.
of slope-dummy interactions between the time points and the appropriate weighted export flows index. The interactions in these two models are employed to assess if the effects of the weighted export flows on the outcome become more or less pronounced through time. The baseline model in Table 4 further confirms the initial set of findings in Table 3. In particular, level of economic development and military expenditures per solider both partially shape the resource consumption levels of nations, and these associations hold when the sample is restricted to less-developed countries. Turning briefly to the two controls, climate
SP5604_02.indd 640
10/3/09 1:58:26 PM
Ecological Footprints of Nations, 1975–2000
641
conditions in the context of the tropical dummy variable has the same negative effect as reported in the preceding analyses, and with the exception of the baseline model, urban population positively affects the per capita footprints of nations. As indicated by Model 1, export flows weighted by GDP per capita has a negative effect on per capita footprints. Similarly, Model 3 reveals a negative association between per capita footprints and export flows weighted by military expenditures per solider. These results are consistent with the negative effects of the slope-dummy interactions in Table 3, further suggesting the relevance of ecologically unequal relationships in the forms of economic and military power for less-developed countries. Models 2 and 4 yield very similar findings for the temporal trajectories of the associations between the outcome and both weighted export flows indices. In Model 2, the interactions between the latter three time points and export flows weighted by GDP per capita are negative and statistically significant. Likewise, in Model 4, the interactions between export flows weighted by military expenditures per soldier in 1990 as well as 2000 are negative and statistically significant as well. In both models, the negative regression coefficients for the statistically significant slope-dummy interactions increase in value across time, and as the standardized coefficients suggest, the relative magnitudes of the increases are far from trivial. As shown by globalization scholars (e.g., Chase-Dunn, Kawano, and Brewer 2000), recent decades consisted of significant upswings in economic integration, particularly international trade between nations, and the rising consumption-based environmental impacts of more economically developed nations and those with more capital intensive militaries are part and parcel of the economic and military treadmills. Hence, through the vertical flow of exports, which likely broadened and intensified during the recent wave of trade globalization, structural relationships between less-developed countries and relatively more economically developed and militarily powerful nations became increasingly ecologically unequal, at least from 1975 to 2000. Taken as a whole, this research suggests that when investigating the consumption-based environmental impacts of nations—which are fundamentally tied to human well-being for many populations—researchers should consider the roles of economic and military factors in the context of domestic attributes as well as their relevance for structural relationships between countries. The latter are particularly significant for less-developed countries, many of which consumed resources well below globally sustainable thresholds during the entire 25-year period under investigation. In other words, while it appears that more economically developed and militarily powerful nations consume greater amounts of resources, to some extent these nations also utilize their relative positions of economic and military power to externalize portions of their environmental costs to lesser-developed countries, which as shown here, tends to suppress resources levels for the populations within the latter. What is more, these statistical associations hold, net of ecological conditions and levels of urbanization, both of which partially shape society/nature relationships.
Conclusion This research contributes to our collective understanding of society/nature relationships in comparative perspective. Foremost, we engaged multiple theoretical perspectives within a general political economy framework to investigate the consumption-based environmental impacts of economic development, the military, and ecologically unequal exchange relationships. Results of the panel regression analyses indicate that the per capita ecological footprints of nations are tied to both economic development, measured as per capita GDP, and military growth in the context of expenditures per soldier. These results lend strong support to the treadmill of production and treadmill of destruction theories in environmental sociology, but more importantly, they underscore the importance for considering both when investigating how human activities and our social institutions impact the environment. The economy and military are related, but they are not simply a reflection of each other. They
SP5604_02.indd 641
10/3/09 1:58:26 PM
642
JORGENSON/Clark
both have unique and independent ecological impacts, which in part are tied to the distinct forces propelling them to grow and develop in ways that are more resource dependent. There is a longstanding tradition in the environmental social sciences to focus on the environmental harms or benefits of economic development. While this is a critically important line of inquiry, our findings indicate that other institutions—particularly the military—are crucial to consider as well. Thus, in line with other scholars (Hooks and Smith 2004; Jorgenson 2005; Jorgenson et al. forthcoming; York 2008; see also Kentor and Kick 2008), we call for environmental sociologists and colleagues in our sister disciplines to incorporate the military into their future theoretical constructs and corresponding empirical investigations. Turning to our assessment of ecologically unequal exchange theory, the panel analyses indicate that more economically developed and militarily powerful nations are able to secure and maintain favorable terms of trade, allowing them to over utilize global environmental space, which suppresses the domestic consumption levels of many less-developed countries, well below globally sustainable levels. Findings for the analyses of the first set of slope-dummy interactions as well as those where we restrict the sample to less-developed countries suggest that the consequences of both forms of ecologically unequal exchange relationships are indeed much more pronounced for less-developed countries than developed countries. Furthermore, to some extent the magnitude of such impacts on the suppression of resource consumption in less-developed countries increased during the period under investigation. Put differently, such structural relationships between nations have become increasingly unequal. Our approach to assessing ecologically unequal exchange is not without its limitations. While the development and implementation of the weighted export flows indices allow for testing assertions concerning the vertical flow of exports and the consequences of such processes for sending nations, they do not allow for evaluating other aspects of the theory, most notably how and the extent to which more developed nations and those with capital intensive militaries utilize structural aspects of international exchanges to treat less-developed countries and those with weaker militaries as waste repositories. Secondly, here we focused on the ecological footprints of nations instead of more direct measures of environmental harms. Considering that prior research identifies strong inverse associations between the per capita footprints of nations and particular forms of environmental degradation (e.g., deforestation), research on the other side of the “resource consumption/environmental degradation coin” would do well to examine the potential role of the vertical flow of exports in the context of both economic and military power relationships. These are key issues that we plan to address in the next steps of this research agenda. While skeptics could argue that the suppression of resource consumption in many lessdeveloped countries—regardless of the mechanisms that shape such processes—is ultimately desirable from a sustainability perspective, it is crucial to realize that this is taking place at the expense of the increasingly unsustainable consumption levels of the most economically developed and militarily powerful nations. What is more, it is likely that suppressed consumption levels in many less-developed countries partially shape many of the human well-being problems experienced by large segments of their populations. Without doubt, human well-being is fundamentally tied to the consumption of resources. An ultimate challenge for global society and its many institutions is to create conditions in which the populations of the less-developed countries are able to increase in beneficial ways their access to and use of natural resources while not surpassing sustainable thresholds. At the same time, the economically developed nations with capital intensive militaries must place greater priorities on reducing their overall consumption-based environmental impacts. While it is well understood that military institutions focus on protecting their respective nation-states and not the environment, their continual development and expansionary practices exacerbate ecological problems at multiple scales, thereby threatening the environmental security of humanity and all other living species. In other words, rather than using the structure of international trade in ecologically unequal manifestations, the higherconsuming nations and their relevant institutions should utilize their collective human capital to foster methods and practices for internalizing environmental costs while also reducing their overuse of the world’s renewable and nonrenewable resources.
SP5604_02.indd 642
10/3/09 1:58:26 PM
Ecological Footprints of Nations, 1975–2000
643
Appendix A. Countries Included in the Analyses Afghanistan# Albania# Algeria Angola Argentina Austria* Belgium* Bosnia# Brazil Bulgaria Cameroon Canada* Central African Republic Chad China Colombia Congo Democratic Republic Cote d’Ivoire Croatia# Cuba# Egypt Estonia# Finland*
France* Gambia Germany* Haiti Hungary India Indonesia Iran Ireland*# Italy* Japan* Kenya Kuwait# Laos Latvia# Lebanon Mali Mexico Myanmar# Nepal Netherlands* Pakistan Panama
Poland Portugal* Romania Rwanda Saudi Arabia# Senegal Somalia# South Africa# Sudan# Sweden* Switzerland* Syria Tanzania Thailand Tunisia Turkey Turkmenistan# Uganda United Kingdom* United States of America* Venezuela Vietnam Yemen#
Notes: * denotes developed countries # denotes countries included only in the descriptive analysis reported in Figure 1
References Brambor, Thomas, William Clark, and Matt Golder. 2006. “Understanding Interaction Models: Improving Empirical Analyses.” Political Analysis 14:63–82. Bunker, Stephen. 1984. “Modes of Extraction, Unequal Exchange, and the Progressive Underdevelopment of an Extreme Periphery: The Brazilian Amazon, 1600–1980.” American Journal of Sociology 89:1017–64. Bunker, Stephen and Paul Ciccantell. 2005. Globalization and the Race for Resources. Baltimore, MD: Johns Hopkins University Press. Burkett, Paul. 2006. Marxism and Ecological Economics: Toward a Red and Green Political Economy. Boston: Brill. Chase-Dunn, Christopher. 1998. Global Formation: Structures of the World-Economy. Lanham, MD: Rowman & Littlefield. Chase-Dunn, Christopher, Yukio Kawano, and Benjamin Brewer. 2000. “Trade Globalization since 1795: Waves of Integration in the World-System.” American Sociological Review 65:77–95. Chew, Sing. 2001. World Ecological Degradation: Accumulation, Urbanization, and Deforestation, 3000 B.C.-A.D. 2000. Walnut Creek, CA: AltaMira Press. Clark, Brett and John Bellamy Foster. 2001. “William Stanley Jevons and The Coal Question: An Introduction to Jevons’s ‘Of the Economy of Fuel.’” Organization & Environment 14(1):93–98. ———. 2009. “Ecological Imperialism and the Global Metabolic Rift: Unequal Exchange and the Guano/ Nitrates Trade.” International Journal of Comparative Sociology 50:311–34. Clark, Brett and Richard York. 2005a. “Carbon Metabolism: Global Capitalism, Climate Change, and the Biospheric Rift.” Theory and Society 34(4):391–428. ———. 2005b. “Dialectical Materialism and Nature: An Alternative to Economism and Deep Ecology.” Organization & Environment 18(3):318–37. Collins, Randall. 1981. “Does Modern Technology Change the Rules of Geopolitics?” Journal of Political & Military Sociology 9(2):163–77.
SP5604_02.indd 643
10/3/09 1:58:26 PM
644
JORGENSON/Clark Diamond, Jared. 2005. Collapse: How Societies Choose for Fail or Succeed. New York: Viking. Dickens, Peter. 2004. Society and Nature. Cambridge, UK: Polity Press. Dietz Thomas, Eugene Rosa, and Richard York. 2007. “Driving the Human Ecological Footprint.” Frontiers in Ecology and The Environment 5:13–18. Dos Santos, Theotonio. 1971. “The Structure of Dependence.” Pp. 225–36 in Readings in U.S. Imperialism, edited by K. T. Fann and D. Hodges. Boston: Porter Sargent Publisher. Dycus, Stephen. 1996. National Defense and the Environment. Hanover, NH: University Press of New England. Emmanuel, Arghiri. 1972. Unequal Exchange: A Study of the Imperialism of Trade. New York: Monthly Review Press. Foster, John Bellamy. 1999. “Marx’s Theory of Metabolic Rift: Classical Foundations for Environmental Sociology.” American Journal of Sociology 105(2):366–405. ———. 2002. Ecology Against Capitalism. New York: Monthly Review Press. Frank, Andre Gunder. 1967. Capitalism and Underdevelopment in Latin America. New York: Monthly Review Press. Frees, Edward. 2004. Longitudinal and Panel Data: Analysis and Applications in the Social Sciences. New York: Cambridge University Press. Frey, R. Scott. 1994. “The International Traffic in Hazardous Wastes.” Journal of Environmental Systems 23:165–77. Galeano, Eduardo. 1997. Open Veins of Latin America: Five Centuries of the Pillage of a Continent. New York: Monthly Review Press. Galtung, Johan. 1971. “A Structural Theory of Imperialism”. Journal of Peace Research 8:81–117. Global Footprint Network. 2006a. Annual Report. Oakland, CA: Global Footprint Network. ———. 2006b. Living Planet Report. Oakland, CA: Global Footprint Network Gould, Kenneth, David Pellow, and Allan Schnaiberg. 2008. The Treadmill of Production: Injustice and Unsustainability in the Global Economy. Boulder, CO: Paradigm Publishers. Greenspan, Alan. 2007. The Age of Turbulence. London, UK: Penguin. Grossman, G. and A. Krueger. 1995. “Economic Growth and the Environment.” Quarterly Journal of Economics 110:353–77. Hamilton, Lawrence. 1992. Regression with Graphics. Belmont, CA: Duxbury Press. ———. 2006. Statistics With STATA. Belmont, CA: Thomson Higher Education. Hansen, James. 2008. “Tipping Point.” Pp. 7–15 in State of the World 2008, edited by E. Fearn and K. H. Redford. Washington, DC: Island Press. Hawken, Paul. 1993. The Ecology of Commerce. New York: Harper Collins. Hooks, Gregory and Chad Smith. 2004. “The Treadmill of Destruction: National Sacrifice Areas and Native Americans.” American Sociological Review 69(4):558–75. ———. 2005. “Treadmills of Production and Destruction: Threats to the Environment Posed by Militarism.” Organization & Environment 18(1):19–37. Hooks, Gregory and Gregory McLauchlan. 1992. “The Institutional Foundation of Warmaking: Three Ears of U.S. Warmaking, 1939–1989.” Theory and Society 21(6):757–88. Hornborg, Alf. 1998. “Towards an Ecological Theory of Unequal Exchange: Articulating World System Theory and Ecological Economics.” Ecological Economics 25:127–36. ———. 2001. The Power of the Machine: Global Inequalities of Economy, Technology, and Environment. Walnut Creek, CA: AltaMira Press. ———. 2006. “Footprints in the Cotton Fields: The Industrial Revolution as Time-Space Appropriation and Environmental Load Displacement.” Ecological Economics 59:74–81. Hornborg, Alf, J. R. McNeill, and Joan Martinez-Alier, eds. 2007. Rethinking Environmental History: WorldSystem History and Global Environmental Change. Lanham, MD: Alta Mira Press. Hsiao, Cheng. 2003. Analysis of Panel Data. 2d ed. New York: Cambridge University Press. Intergovernmental Panel on Climate Change (IPCC). 2007. Climate Change 2007: The Physical Science Basis. Cambridge, UK: Cambridge University Press. International Monetary Fund. 2003. Direction of Trade Statistics (CD ROM version). Washington, DC: International Monetary Fund Publications Services. Jenkins, Craig and Steve Scanlan. 2001. “Food Security in Less-Developed Countries, 1970–1990.” American Sociological Review 66:714–44. Jevons, W. Stanley. 1906. The Coal Question; An Inquiry concerning the Progress of the Nation, and the Probable Exhaustion of our Coalmines. London, UK: Macmillan and Company.
SP5604_02.indd 644
10/3/09 1:58:26 PM
Ecological Footprints of Nations, 1975–2000
645
Jorgenson, Andrew K. 2003. “Consumption and Environmental Degradation: A Cross-National Analysis of the Ecological Footprint.” Social Problems 50:374–94. ———. 2005. “Unpacking International Power and the Ecological Footprints of Nations: A Quantitative Cross-National Study.” Sociological Perspectives 48(3):383–402. ———. 2006. “Unequal Ecological Exchange and Environmental Degradation: A Theoretical Proposition and Cross-National Study of Deforestation, 1990–2000.” Rural Sociology 71:685–712. ———. 2009a. “The Sociology of Unequal Exchange in Ecological Context: A Panel Study of Lower Income Countries, 1975–2000.” Sociological Forum 24:22–46. ———. 2009b. “The Transnational Organization of Production, the Scale of Degradation, and Ecoefficiency: A Study of Carbon Dioxide Emissions in Less-Developed Countries.” Human Ecology Review 16:63–73. Jorgenson, Andrew K., Brett Clark, and Jeffrey Kentor. Forthcoming. “Militarization and the Environment: A Panel Study of Carbon Dioxide Emissions and the Ecological Footprints of Nations, 1970– 2000.” Global Environmental Politics. Jorgenson, Andrew K., Christopher Dick, and Matthew Mahutga. 2007. “Foreign Investment Dependence and the Environment: An Ecostructural Approach.” Social Problems 54:371–94. Jorgenson, Andrew K. and Edward Kick, eds. 2006. Globalization and the Environment. Leiden, Netherlands: Brill. Jorgenson, Andrew K., Kelly Austin, and Christopher Dick. 2009. “Ecologically Unequal Exchange and the Resource Consumption/Environmental Degradation Paradox: A Panel Study of Less-Developed Countries, 1970–2000.” International Journal of Comparative Sociology 50:263–84. Jorgenson, Andrew K. and Kennon Kuykendall. 2008. “Globalization, Foreign Investment Dependence, and Agriculture Production: A Cross-National Study of Pesticide and Fertilizer Use Intensity in LessDeveloped Countries, 1990–2000.” Social Forces 87:529–60. Jorgenson, Andrew K. and Thomas Burns. 2007. “The Political-Economic Causes of Change in the Ecological Footprints of Nations, 1991–2001: A Quantitative Investigation.” Social Science Research 36:834–53. Kentor, Jeffrey. 2000. Capital and Coercion. New York: Garland. Kentor, Jeffrey and Edward Kick. 2008. “Bringing the Military Back In: Military Expenditures and Economic Growth 1990 to 2003.” Journal of World-Systems Research 14:142–72. Kick, Edward, Byron Davis, and Jeffrey Kentor. 2006. “A Cross-National Analysis of Militarization and Inequality.” Journal of Political and Military Sociology 34(2):319–37. LaDuke, Winona. 1999. All Our Relations: Native Struggles for Land and Life. Boston: South End Press. Levy, Yagil. 1998. “Militarizing Inequality: A Conceptual Framework.” Theory and Society 27:873–904. Lofdahl, Cory. 2002. Environmental Impacts of Globalization and Trade. Cambridge, MA: MIT Press. McNeill, William H. 1982. The Pursuit of Power. Chicago: University of Chicago Press. Mills, C. Wright. 2000. The Power Elite. New York: Oxford University Press. Mol, Arthur. 1995. The Refinement of Production: Ecological Modernization Theory and the Chemical Industry. Utrecht, Netherlands: Van Arkel. ———. 2001. Globalization and Environmental Reform. Cambridge: MIT Press. Molotch, Harvey. 1976. “The City as a Growth Machine: Toward a Political Economy of Place.” American Journal of Sociology 82(2):309–32. Moore, Jason. 2000. “Environmental Crises and the Metabolic Rift in World-Historical Perspective.” Organization & Environment 13(2):123–57. ———. 2003. “The Modern World-System as Environmental History: Ecology and the Rise of Capitalism.” Theory and Society 32(3):307–77. Neter, John, William Wasserman, and Michael H. Kutner. 1990. Applied Statistical Models. 3d ed. Boston: Irwin. O’Connor, James. 1998. Natural Causes: Essays in Ecological Marxism. New York: The Guilford Press. Ozler, S. Ilgu and Brian Obach. 2009. “Capitalism, State Economic Policy, and Ecological Footprint: An International Comparative Analysis.” Global Environmental Politics 9:79–108. Pellow, David. 2007. Resisting Global Toxics: Transnational Movements for Environmental Justice. Cambridge, MA: MIT Press. Polimeni, John, Kozo Mayumi, Mario Giampietro, and Blake Alcott. 2008. The Jevons Paradox and the Myth of Resource Efficiency Improvements. London, UK: Earthscan. Renner, Michael. 1991. “Assessing the Military’s War on the Environment.” Pp. 132–52 in State of the World, edited by Linda Starke. New York: WW Norton & Company.
SP5604_02.indd 645
10/3/09 1:58:26 PM
646
JORGENSON/Clark Rice, James. 2007. “Ecological Unequal Exchange: International Trade and Uneven Utilization of Environmental Space in the World System.” Social Forces 85:1369–92. ———. 2008. “Material Consumption and Social Well-Being within the Periphery of the World Economy: An Ecological Analysis of Maternal Mortality.” Social Science Research 37:1292–1309. Roberts, Timmons and Bradley Parks. 2007. A Climate of Injustice: Global Inequality, North-South Politics, and Climate Policy. Cambridge, MA: MIT Press. Rostow, W. W. 1964. The Stages of Economic Growth: A Non-Communist Manifesto. Cambridge, UK: Cambridge University Press. Santana, Deborah. 2002. “Resisting Toxic Militarism: Vieques versus the U.S. Navy.” Social Justice SpringSummer:37–48. Schnaiberg, Allan. 1980. The Environment: From Surplus to Scarcity. New York: Oxford University Press. Schnaiberg, Allan and Kenneth Gould. 1994. Environment and Society: The Enduring Conflict. New York: St. Martin’s Press. Schumpeter, Joseph. 2000. Essays: On Entrepreneurs, Innovations, Business Cycles, and the Evolution of Capitalism. New Brunswick, NJ: Transaction Publishers. Shaw, Martin. 1988. Dialectics of War. London, UK: Pluto Press. Shulman, Seth. 1992. The Threat at Home: Confronting the Toxic Legacy of the U.S. Military. Boston: Beacon Press. Speth, James Gustave. 2008. The Bridge at the Edge of the World. New Haven, CT: Yale University Press. Srinivasana, U. Thara, Susan Carey, Eric Hallstein, Paul Higgins, Amber Kerr, Laura Koteen, Adam Smith, Reg Watson, John Harte, and Richard Norgaard. 2008. “The Debt of Nations and the Distribution of Ecological Impacts from Human Activities.” Proceedings of the National Academy of Sciences 105(5):1768– 73. Stockholm International Peace Research Institute [SIPRI]. 1977, 1984, 1987, 1991, 2000. SIPRI Yearbook: World Armaments and Disarmament. New York: Oxford University Press. Thomas, William. 1995. Scorched Earth: The Military’s Assault on the Environment. Philadelphia: New Society Publishers. Tilly, Charles. 1990. Coercion, Capital, and European States, AD 990–1992. Oxford, UK: Blackwell. United Nations’ Center for Disarmament. 1982. The Relationship Between Disarmament and Development. New York: United Nations. Wackernagel, Mathis, Niels Schulz, Diana Deumling, Alejandro Callejas Linares, Martin Jenkins, Valerie Kapos, Chad Monfreda, Jonathan Loh, Norman Myers, Richard Norgaard, and Jørgen Randers. 2002. “Tracking the Ecological Overshoot of the Human Economy.” Proceedings of the National Academy of Sciences 99(14):9266–71. Wackernagel, Mathis and William Rees. 1996. Our Ecological Footprint. Gabriola Island, BC: New Society. World Bank. 2007. World Development Indicators (CD ROM version). Washington, DC: World Bank. York, Richard. 2006. “Ecological Paradoxes: William Stanley Jevons and the Paperless Office” Human Ecology Review 13:143–47. ———. 2008. “De-Carbonization in Former Soviet Republics, 1992–2000: The Ecological Consequences of De-Modernization.” Social Problems 55:370–90. York, Richard, Eugene Rosa, and Thomas Dietz. 2003. “Footprints on the Earth: The Environmental Consequences of Modernity.” American Sociological Review 68:279–300.
SP5604_02.indd 646
10/3/09 1:58:27 PM