Speaker Recognition Using Common Passphrases in RedDots Hagai Aronowitz IBM Research - Haifa, Israel
[email protected]
Abstract In this paper we report our work on the recently collected text dependent speaker recognition dataset named RedDots, with a focus on the common passphrase condition. We first investigate an out-of-the-box approach. We then report several strategies to train on RedDots itself using up to 40 speakers for training. The GMM-NAP framework is used as a baseline. We report the following novelties: First, we demonstrate the use of bagging for improved accuracy. Second, we estimate the EER of a passphrase using metadata only. Third, the estimated EERs are used for improved score normalization. Finally we report an analysis of system sensitivity to the duration between enrollment and testing (template aging). Index Terms: RedDots, text dependent speaker recognition, bagging, pass-phrase quality estimation, template aging
1. Introduction This paper describes the work done at IBM within the framework of the RedDots text-dependent speaker recognition challenge for Interspeech 2016. The RedDots data collection is described in [1]. The RedDots challenge (described in [2]) addresses multiple authentication conditions. In this paper we focus on a single authentication condition (part 1 impostercorrect). This condition corresponds to the standard common passphrase condition in which both target and imposter authentication trials contain the same passphrase as used for enrollment. We focus on this condition as it is the most appropriate for multi-modal person authentication [3], in which liveness detection can be addressed using other means such as audiovisual synchrony detection and face recognition [4]. According to the RedDots part 1 protocol, scores from 10 different common passphrases are pooled. This is contrary to our previous works on the Wells Fargo (WF) dataset [5] were EER is computed independently for each passphrase. This raises the need of passphrase-dependent score normalization (or calibration). Furthermore, the RedDots challenge does not provide any in-domain development data (largely due to its small size). Instead, the RedDots protocol requires one to use an out-of-the-box system and to use the RedDots data for evaluation only. We address this discrepancy between protocols by conducting two types of analysis. First, we present results following the RedDots protocol using a text-independent system. Second, we use cross-validation to train and evaluate on RedDots. Finally, the RedDots data provides the opportunity to investigate the short-to-medium term template aging effect in the framework of text-dependent speaker recognition. In a
nutshell, the question is whether the accuracies obtained when enrollment and verification data are collected within a short time span degrade when the time span gets longer, and to what extent. We report a preliminary investigation on this subject. The remainder of this paper is organized as follows: Section 2 describes the datasets and setup. Section 3 describes our GMM-NAP-based baseline system. Section 4 introduced our novel bagging approach to improve the robustness of training a speaker recognition system on a small devset. Section 5 presents our work on RedDots. Section 6 presents our analysis on template aging. Finally, Section 7 concludes.
2. Datasets and setup 2.1. The RedDots Interspeech-2016 challenge The RedDots project was initiated, with collaboration from multiple sites, as a follow‐up to a special session during Interspeech 2014. It was set out to collect speech data through mobile crowd‐sourcing, with the benefit of potentially wider population and greater diversity. The challenge dataset consists of 62 speakers (49 male, 13 female) from 21 countries, with a total of 573 complete sessions (473 male and 99 female). The Part1 imposter-correct condition consists of 10 common passphrases, totaling in 3242/118166 male target/imposter trials and 634/4438 female target/imposter trials.
2.2. IBM datasets The IBM datasets were collected internally at IBM as part of a multi-modal data collection effort described in detail in [3]. The data was collected with smartphones and tablets. Subjects were recorded by smartphones and tablets held at arm-length. IBM-dev dataset was collected using iPad-2 and iPhone-4 with 2 recording sessions per speaker and per device. For most of the speakers single recordings sessions from Galaxy-2 and Xoom-2 were also recorded. The recording condition was highly clean. The dataset consists of 100 users (mostly males). Each recording session contains several utterances including 3 repetitions of the common passphrase my voice is my password. For text independent training each session contains a 75-words text which is mostly fixed (except for name, phone number and zip-code). IBM-eval contains 32 speakers (20 males) recorded by iPad-2 and iPhone-5. Three sessions were recorded per speaker for each device, the first two in clean conditions and the third in a noisy cafeteria. There are ~500 target trials and ~25000 impostor trials per device (no cross device trials).
2.3. Wells-Fargo (WF) dataset
The WF corpus consists of 750 speakers, from which 200 are assigned to a devset. Each speaker has 2 landline sessions and 2 cellular sessions. The data collection was accomplished over a period of 4 weeks. We use the WF devset for training a contrastive textindependent system. We use the following utterances: four fixed 10-digit phone numbers, a 10-digit string containing the words zero-to-nine, and two short fixed sentences.
2.4. Assessment strategy Results on RedDots (EER, minDCF) may be assessed in different ways. Consider for instance the gender issue. One alternative is to assess results independently for each gender and possibly also to average the EERs (or minDCFs) obtained for each gender in order to obtain a single gender independent assessment. Alternatively, scores may be pooled and then assessed. In such case, the lack of calibration before pooling may be an issue. The same issue applies to passphrase dependency. One can either pool all scores and then assess performance, or first assess performance and then average the performance measures. The choice of the best assessment method is highly dependent on the application. Furthermore, large accuracy differences between the two assessment methods indicate a need for passphrase dependent score normalization (or calibration). The assessment issue is mostly challenging when cross validation is used, because pooling scores from different noncalibrated systems may result in degraded performance. In this case we argue that the proper assessment method is to average the individual error measures for the different folds in the cross validation and not pool the scores from the different folds (as cross validation is just a tool for assessment and in deployment a single system is used).
3. Baseline System Our baseline system is based on the GMM-NAP framework. In the GMM-NAP framework a GMM is adapted for each session from a UBM using MAP-adaptation. A projection is estimated from the development set and is used to compensate intra-speaker intersession variability (such as channel variability). The GMM-NAP framework was chosen as it is possible to reasonably train it using tens of speakers [12-14], contrary to the i-vector PLDA [15] framework which requires much more data for training [16].
3.1. Front-end The front-end is based on PNCC-inspired features [7]. First audio is down-sampled (in case of 16KHz audio) to 8KHz. Then, an energy based voice activity detector is used to locate and remove non-speech frames. The final feature set consists of 19 Cepstral coefficients augmented by 19 delta and 19 double delta coefficients extracted every 10ms using a 25ms window. Feature warping is applied with a 300 frame window before computing the delta and double delta features.
3.2. GMM supervector extraction A Universal Background Model (UBM) with diagonal covariance matrices is trained on the development set and is used for extracting the supervectors. The means of the GMMs are stacked into a supervector after normalization with the
corresponding standard deviations of the UBM and multiplication by the square root of the corresponding weight from the UBM:
/2 x 1/ 2 1UBM IF
(1)
where µ stands for the concatenated GMM means, λUBM stands for a diagonal matrix with the UBM weights on the diagonal, ∑ is a block diagonal matrix with covariance matrices from the UBM on its diagonal, F is the feature vector dimension, is the Kronecker product, and IF is the identity matrix of rank F. We center all supervectors using the mean of the development set.
3.3. NAP estimation A low rank projection P is estimated as follows. First, we remove from each supervector in the development its corresponding speaker-dependent supervector mean. The resulting supervectors are named nuisance supervectors. We compute the covariance matrix of the nuisance supervectors and apply PCA to find a basis to the nuisance space. Projection P is created by stacking the top k eigenvectors as columns in matrix V:
P I VV t .
(2)
3.4. NAP compensation Every supervector x is compensated by applying projection P:
~ x Px .
(3)
3.5. Scoring and score normalization Scoring is performed using the Geometric mean kernel [8] applied on the compensated enrollment and test supervectors:
CGM E , T
t
1
vec E 1
2
1 UBM
vec T 1
1 1 1 ~ xEt E2 UBM T2 I F ~ xT (4)
2
where E and T stand for the enrollment and test sessions, ~ xE
and ~ xT are the corresponding compensated supervectors, and λE and λT are the corresponding diagonal matrices with the GMM weights on the diagonal. Finally, We apply ZT-score normalization [9] using the development data.
4. Bagging In speaker recognition the parameters of the recognition model (UBM, NAP and score-norm statistics) are usually pointestimated from a devset, and the estimation error is neglected. When the devset is small, model estimation error is high which causes performance degradation. A possible remedy for this problem would be to marginalize over the estimated distribution of the model parameters θ:
log px log px p d
(5)
A practical approximation would be to sample N models from p(θ) and compute the log of the average likelihood:
log px log N1 px i . i
(6)
Table 1. EER (in %) for the baseline and the bagging based systems trained on IBM-dev and tested on IBM-eval. Results are for pooled male and female trials Condition (dev-eval)
However, Eq. (6) requires scores to be calibrated into likelihoods. Instead, the log-likelihoods can be averaged as in Eq. (7):
log px
1 N
log px .
(7)
i
iPad
i
Note that contrary to the approximation in Eq. (6), modeldependent score biases (bi) will not affect EER if compensated using calibration (see Eq. (8)).
log px b log px b . i
i
i
i
i
i
(8)
iPhone
iPad
i
The methods we use to sample from the model parameter distribution are to either sample subsets from the devset and train the system on each such subset, or to train models with slightly different GMM orders. The general framework is named bagging [10]. We evaluate the bagging approach on the following setup. We train the baseline system described in Section 3 system on IBM-dev and test on IBM-eval using the utterances of the common passphrase my voice is my password. We sample the devset 8 times, each time removing 10 different speakers from the devset of 100 speakers resulting in 8 devsets of 90 speakers. The bagged scores are obtained by averaging the scores produced by the 8 models (Eq. 7). Results (using 128 Gaussians, and a NAP dimension of 50) are reported in Table 1. The experiments indicate an average error reduction of 13% relative, and 11% when DNN-based denoising [11] is applied as a pre-processing. In the next section we demonstrate the use of bagging for the RedDots data.
Method
5. RedDots experiments
baseline
iPhone
Relative improv.[%]
6 12 7 17 20 19 13 7 6 17 16 11
Table 2. EERs (in %) on RedDots. Scores from 10 common passphrases are pooled. Devset WF IBM-dev
Gender male female male female
w/o NAP EER [%] 5.9 8.4 3.9 6.8
NAP EER [%] 3.6 7.7 3.4 7.4
Relative improv.[%] 39 8 13 -9
Table 3. EERs (in %) on RedDots-males trained on IBM-dev text-independent. PB stands for Phrase dependent score Bias regressed from phrase length.
5.1. Out-of-the-box text-independent system The baseline system described in Section 3 was trained gender-independently on two different text-independent datasets (WF and IBM-dev), with 512 Gaussians, and a NAP dimension of 50. The results in Table 2 indicate that channel compensation (NAP) trained on a text-independent devset is helpful, except for the last row which might be due to the small number of females in the devset (12). Furthermore, as the number of females in RedDots (13 totaling in 99 sessions) is very small we do not report any further results on females. The rest of our results in this subsection are produced using IBM-dev for development as it gives better results than WF. Next, we explore the use of bagging. We use a similar setup as described in section 4 (8 samples of the devset resulting in 8 models). The results which are denoted by 'Pooling' are reported in Table 3. We next explore phrase-dependent (PD) score normalization. First, we evaluate the average EER per passphrase (contrary to pooling all scores and calculating a single EER). The results denoted by 'EERs averaged' are reported in Table 3. For some applications using EER averaging for evaluation is appropriate, for instance if a single common passphrase is used in deployment. However, for other applications a single
Baseline Bagging EER EER [%] [%] Raw audio clean-clean 1.07 1.01 clean-noisy 5.13 4.54 all-all 4.66 4.32 clean-clean 1.91 1.58 clean-noisy 2.82 2.27 all-all 2.98 2.41 DNN-denoised audio clean-clean 0.53 0.46 clean-noisy 4.86 4.54 all-all 4.22 3.95 clean-clean 1.27 1.05 clean-noisy 2.72 2.27 all-all 2.69 2.38
bagging
Eval method Pooling EERs averaged PB + pooling Pooling EERs averaged PB + pooling
EER [%] 3.3 3.0 3.2 3.0 2.6 2.5
Relative improv.[%] 9 3 9 21 24
Table 4. EERs (in %) on RedDots-males trained using cross-validation on RedDots. (PI/PD=passphrase independent/dependent training). CV-EA stands for cross-validation EER averaging. Method Baseline PD
Baseline PI
Bagging PD
Cross Valid. Pooling Pooling CV-EA CV-EA Pooling Pooling CV-EA CV-EA Pooling Pooling CV-EA CV-EA
Per partition Eval method Pooling EERs avg Pooling EERs avg Pooling EERs avg Pooling EERs avg Pooling EERs avg Pooling EERs avg
Devset size (# speakers) 10 20 30 40 7.1 7.1 6.6 6.1 4.0 3.5 3.8 3.2 6.0 5.9 5.7 4.9
3.5 3.3 3.5 3.1 3.3 2.9 3.2 2.8 3.0 2.8 2.9 2.6
2.8 2.5 2.8 2.4 3.1 2.7 3.1 2.6 2.4 2.2 2.4 2.1
2.6 2.2 2.3 1.7 3.0 2.6 2.7 2.0 2.3 1.9 2.0 1.4
threshold must be automatically set for all passphrases. A related problem is estimating a-priori the EER of a passphrase. We propose to regress the EER as a function of the length (in characters) of the passphrase. For the baseline system, a correlation of 0.8 was found (using the test data, i.e., a cheating experiment) between the inverse of the length of the passphrase and its. The next step is to use the regressed EER for score normalization. As our goal is to optimize EER, we aim at independently normalizing the scores of each passphrase such that a single threshold would give the EER operating point for all pass-phrases. We assume that after phrase-independent ZTscore normalization the imposter scores for each passphrase distribute normally standard. We can therefore subtract a phrase dependent bias from the scores of a given passphrase such that the expected false-acceptance is set to the expected EER (regressed from the phrase length). The results are reported in Table 3, and denoted by 'PB + pooling' (PB stands for Phrase-dependent Bias).
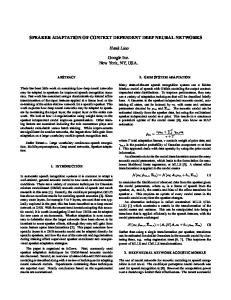
Figure 1: Template aging effect on RedDots using the baseline text-independent system trained on IBM-dev with passphrase EER averaging.
5.2. Cross validation experiments Experiments were run on RedDots (males only) using cross validation. For each specified number of development speakers (10, 20, 30 and 40), we create 30 different partitions of RedDots into a devset and an evaluation set (speakers in the two sets are disjoint). Three types of setups were evaluated. The first one is running the baseline GMM-NAP system (with a GMM order of 128) in a passphrase-dependent manner (building the whole system from scratch starting from the UBM, using only utterances from the evaluated passphrase). The second setup is training a single phrase-independent (PI) system (with a GMM order of 512). The third setup is similar to the first one (PD) but using the bagging method. In order to best exploit the small amounts of data, bagging was done by training 8 different systems when the difference is the number of Gaussians: 128+8k with k={-4,...,3}. For each experiment, the scores from the 30 different partitions may be either pooled (denoted by 'Pooling'), or individual EERs per partition (noisy but unbiased) may be computed and averaged (denoted by 'CV-EA' (cross-validation EER averaging)). We argue that the latter method (averaging EERs) is more appropriate as in deployment one will not need to pool scores from different folds. The results are reported in Table 4.
6. Aging templates analysis One of the concerns in speaker recognition is whether the performance assessed on evaluation data that has been recorded within a short period of time would degrade when deployed due to template aging (when the duration between enrollment and testing is long). The concern is particularly relevant to text-dependent speaker recognition where datasets like WF, RSR-2015 and IBM dataset have been recorded within a relatively short period. The template aging effect is analyzed by partitioning the target-trials according to the duration between enrollment and verification. For each partition, the EER and average score are computed and plotted as a function of the mean duration (Figure 1). A regression analysis indicates that EER is increased on average by 0.01% per day (R-squared=0.43), and
that target trial scores decrease on average by 0.02 per day (Rsquared=0.75).
7. Conclusions In this work we have investigated several alternatives for building a speaker recognition system for the RedDots challenge. We addressed the part 1 imposter-correct condition (10 common passphrases evaluated in the standard textdependent setup). We constrained ourselves to a GMM-NAP framework and compared an out-of-the-box text-independent system to a system trained on RedDots itself using crossvalidation. The main conclusion we draw is that RedDotsbased training is superior to the out-of-box system if more than 20 speakers are available for training. We have several contributions in this work. First, we propose to use bagging of multiple systems either trained on slightly different datasets or trained using a slightly different GMM order. We obtained an average relative error reduction of 15% using this approach. Second, we highlight the problem of pooling scores from different passphrases (and from different cross-validation patritions) and propose to average EERs instead of pooling scores whenever it is reasonable in view of the application (we argue that this is the case for cross-validation). Third, we propose to anticipate the EER of a passphrase using the textual representation of the passphrase. A first step of regressing the EER as a function of the inverse of the length (in characters) results in a correlation of 0.8. We use the regression to obtain modest error reductions by doing phrasedependent score normalization. Finally, we report an analysis of the template aging effect and conclude that EER increases by 0.01% per aging day.
8. References [1]
[2]
K.A. Lee, A. Larcher, G. Wang, P. Kenny, N. Brummer, D. van Leeuwen, Hagai Aronowitz, M. Kockmann, C. Vaquero, B. Ma, H. Li, T. Stafylakis, J. Alam, A. Swart, J. Perez, "The RedDots Data Collection for Speaker Recognition", in Proc. Interspeech, 2015. The Interspeech 2016 RedDots Description. Avaialable online: https://sites.google.com/site/thereddotsproject/reddots-challenge
[3]
[4]
[5]
[6] [7]
[8]
[9] [10] [11]
[12]
[13] [14] [15]
[16]
H. Aronowitz, M. Li, O. Toledo-Ronen, S. Harary, A. Geva, S. Ben-David, A. Rendel, R. Hoory, N. Ratha, S. Pankanti, D. Nahamoo, "Multi-Modal Biometrics for Mobile Authentication", in Proc. IJCB, 2014. A. Aides, H. Aronowitz, "Text-Dependent Audiovisual Synchrony Detection for Spoofing Detection in Mobile Person Recognition", submitted to Interspeech, 2016. H. Aronowitz, H. Hoory, J. Pelecanos, D. Nahamoo, "New Developments in Voice Biometrics for User Authentication", in Proc. Interspeech, 2011. H. Aronowitz, Y. A. Solewicz, “Speaker Recognition in TwoWire Test Sessions”, in Proc. Interspeech 2008, C. Kim and R. M. Stern, “Power normalized cepstral coefficients (PNCC) for robust speech recognition”, in Proc. ICASSP, 2012. W. Campbell, Z. Karam, "Simple and Efficient Speaker Comparison using Approximate KL Divergence", in Proc. Interspeech, 2010. H. Aronowitz, V. Aronowitz, "Efficient score normalization for speaker recognition", in Proc. ICASSP, 2010. L. Breiman, "Bagging predictors", Machine Learning 24 (2) 123–140, 1996. O. Plchot, L. Burget, H. Aronowitz, P. Majetka, "Audio Enhancing with DNN Autoencoders for Speaker Recognition", in Proc. ICASSP, 2016. H. Aronowitz, "Exploiting Supervector Structure for Speaker Recognition Trained on a Small Development Set", in Proc. Interspeech, 2015. H. Aronowitz, "Score Stabilization for Speaker Recognition Trained on a Small Development Set", in Interspeech, 2015. H. Aronowitz, "Speaker Recognition using Matched Filters", in Proc. ICASSP, 2016. D. Garcia-Romero and C. Y. Espy-Wilson, “Analysis of i-vector length normalization in speaker recognition systems,” in Proc. Interspeech. 2011. H. Aronowitz, A. Rendel, "Domain Adaptation for Text Dependent Speaker Recognition", in Proc. Interspeech, 2014.