2
RESEARCH NOTE 13-2
Survey Results: Impact of Student Loan Debt on Homeownership Trends and Vehicle Purchasing June 13, 2013
3
Research Partners • This project was funded by the One Wisconsin Institute, and was also
possible through partnerships with the ProgressNow Education network
• One Wisconsin Institute • One Wisconsin Institute is a 501(c)(3) statewide research and education organization of 60,000 online supporters that utilizes research, communications, rapid response and online organizing to achieve its vision for a Wisconsin with equal economic opportunity for all. The Institute’s research and staff have appeared in thousands of media articles at the national, state and local levels, including The Rachel Maddow Program, The Ed Show, The Melissa Harris-Parry Show, National Public Radio, The Thom Hartmann Program, The New York Times, USAToday and The Washington Post. • ProgressNow Education • The Institute is part of the national ProgressNow Education network of 21 statebased 501(c)(3) organizations improving communications strategy and delivery in the progressive movement. ProgressNow Education has state partners who are experts in research and communication issue campaigns in California, Colorado, Florida, Iowa, Georgia, Massachusetts, Michigan, Missouri, Minnesota, North Carolina, Nebraska, New Hampshire, New Mexico, Nevada, Ohio, Pennsylvania, Texas, Utah, Virginia, Washington and Wisconsin.
4
Major Findings • May 2013 Web Survey of 61,762 individuals, collected via email lists from a
network of not-for-profit organizations.
• Survey respondents reported an average length of repayment period of 21.1
years, but was typically longer for those with advanced degrees
• 20-year repayment limit forgiveness programs appear more likely to benefit borrowers with
Graduate Degrees than individuals with other levels of educational attainment
• Strong correlation between Student Loan debt and renting, rather than having
a mortgage or owning a house outright (barrier to broadly accepted policy goal of encouraging home ownership: “American Dream”) • Home ownership was 36.1 percentage points higher among survey respondents who have
already paid off their student loans across all income categories.
• Survey respondents with student loan debt were significantly more likely to
purchase a used vehicle, rather than a new vehicle, when compared to those without student Loan debt • May reduce new vehicle spending by as much as an estimated $6.4 billion annually in the US.
5
Length of Debt • Average current length of repayment period varies by level of education • 20-year repayment limit forgiveness programs appear more likely to benefit borrowers with
Graduate degrees than individuals with other levels of educational attainment
6
Estimates of Monthly Debt Payments • Among survey respondents with bachelors or advanced degrees, 55 percent
currently have a monthly student loan payment • Reported average monthly student loan amounts were $499 for individuals with bachelors degrees
and $653 for individuals with graduate or professional degrees
There are nearly 37 million student loan borrowers in the United States currently repaying a student loan (source: Federal Reserve Bank of New York)
7
Length of Debt Methods Points: • Length of repayment period was self-reported via the survey, and thus is not a
direct measurement of actual repayment periods such as might be calculated by the federal Department of Education using data from the NSLDS system. • Length of repayment was estimated for respondents who were last enrolled in 1997 or later to more accurately measure current financing environment. • This is to account for the SLMAR Act of 1996 – after which an increasing number of student loan debtors appear to have consolidated their loans (ie. Increased the payback term). • Work done by other researchers suggests that the proportionate number of individuals with student loan debt has increased over time, and we saw that as well in our sample. (This may be a function of the increase in cost of an education over time)
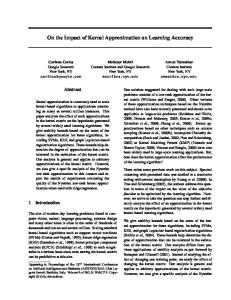
8
Impact on Homeownership • Survey respondents who indicated they had already paid off their student loan debt were more than
seven times more likely to own their homes free and clear • The pattern holds true for all income categories (although the proportion of renters increases at lower income levels).
9
Impact on Homeownership Methods Points: • Measurable impact of student loan debt on rate of renting, rather than home ownership, was statistically significant at every income level (95% confidence level). Confidence)Interval)Calculation)1)%)Renting Currently)Repaying Already)Paid)Off
Less)than)$25k Less)than)$25k
Sample)mean 59.3% 43.4%
Currently)Repaying Already)Paid)Off
$25k)=<)<)$50k $25k)=<)<)$50k
57.9% 27.5%
8493 0.48083 1005 0.46167
0.01023 0.02858
56.9% 24.7%
57.9% 27.5%
59.0% 30.4%
Currently)Repaying Already)Paid)Off
$50k)=<)<)$75k $50k)=<)<)$75k
44.0% 19.3%
7328 0.49979 1193 0.40596
0.01144 0.02306
42.9% 17.0%
44.0% 19.3%
45.1% 21.6%
Currently)Repaying Already)Paid)Off
$75k)=<)<)$100k $75k)=<)<)$100k
34.8% 12.8%
4065 0.48613 882 0.34183
0.01495 0.02259
33.3% 10.5%
34.8% 12.8%
36.3% 15.0%
Currently)Repaying Already)Paid)Off
$100k)=<)<)$150k $100k)=<)<)$150k
27.2% 8.9%
3229 0.45918 996 0.28969
0.01584 0.01801
25.6% 7.1%
27.2% 8.9%
28.8% 10.7%
Currently)Repaying Already)Paid)Off
$150k)or)more $150k)or)more
23.7% 7.3%
1088 0.43990 681 0.26577
0.02617 0.02000
21.0% 5.3%
23.7% 7.3%
26.3% 9.3%
source:)2013)Student)Loan)Debt)Survey)by)Corvus)Insights)LLC
n
Stdev =CONFIDENCE.T lower)bound 4505 0.47875 0.01398 57.9% 626 0.49839 0.03912 39.5%
mean upper)bound 59.3% 60.7% 43.4% 47.3%
10
Impact on Homeownership • Home ownership was 36.1 percentage points higher among survey respondents who have already
paid off their student loans in the $25k-$50k income category. • Survey respondents in this income category who indicated they had already paid off their student loan debt were more than seven times more likely to own their homes free and clear
11
Impact on Homeownership • Home ownership was 28.0 percentage points higher among survey respondents who have already
paid off their student loans in the $50k-$75k income category. • Survey respondents in this income category who indicated they had already paid off their student loan debt were nearly ten times more likely to own their homes free and clear
12
Impact on Homeownership • Home ownership was 25.0 percentage points higher among survey respondents who have already
paid off their student loans in the $75k-$100k income category. • Survey respondents in this income category who indicated they had already paid off their student loan debt were nearly ten times more likely to own their homes free and clear
13
New Car Purchasing • In every household income category, individuals who have already paid off a
student loan were more likely to purchase a new vehicle (as opposed to purchasing a used vehicle) during the last ten years.
14
New Car Purchasing • Measurable impact of Student Loan Debt on rate of New Vehicle purchasing
was statistically significant at every income level (95% confidence level). Confidence)Interval)Calculation)1)%)Buying)New)Car Currently)Repaying Already)Paid)Off
Less)than)$25k Less)than)$25k
Sample)mean )))))))))))0.19949 )))))))))))0.30925
Currently)Repaying Already)Paid)Off
$25k)=<)<)$50k $25k)=<)<)$50k
)))))))))))0.30567 )))))))))))0.38553
5604 760
0.46073 0.48704
0.01207 0.03468
29.4% 35.1%
30.6% 38.6%
31.8% 42.0%
Currently)Repaying Already)Paid)Off
$50k)=<)<)$75k $50k)=<)<)$75k
)))))))))))0.38130 )))))))))))0.48404
5358 971
0.48575 0.50000
0.01301 0.03149
36.8% 45.3%
38.1% 48.4%
39.4% 51.6%
Currently)Repaying Already)Paid)Off
$75k)=<)<)$100k $75k)=<)<)$100k
)))))))))))0.43467 )))))))))))0.52362
3161 762
0.49579 0.49977
0.01729 0.03554
41.7% 48.8%
43.5% 52.4%
45.2% 55.9%
Currently)Repaying Already)Paid)Off
$100k)=<)<)$150k $100k)=<)<)$150k
)))))))))))0.47479 )))))))))))0.60229
2578 875
0.49946 0.48971
0.01929 0.03249
45.5% 57.0%
47.5% 60.2%
49.4% 63.5%
Currently)Repaying Already)Paid)Off
$150k)or)more $150k)or)more
)))))))))))0.52403 )))))))))))0.67881
853 604
0.49972 0.46732
0.03358 0.03734
49.0% 64.1%
52.4% 67.9%
55.8% 71.6%
source:)2013)Student)Loan)Debt)Survey)by)Corvus)Insights)LLC
n 2346 346
Stdev =CONFIDENCE.T lower)bound 0.39970 0.01618 18.3% 0.46285 0.04894 26.0%
mean 19.9% 30.9%
upper)bound 21.6% 35.8%
15
New Car Purchasing • Individuals currently paying on a student loan are significantly more likely to
purchase a used, rather than a new vehicle. • Survey Respondents without a monthly student loan payment bought new and used vehicles at
essentially an equal frequency.
16
New Car Purchasing • Survey Respondents with student loan debt were much more likely to still be
paying on their last vehicle purchase. Of those who have purchased at least one vehicle in the last ten years: • 44.2% of those currently paying a student loan have already paid off their last vehicle purchase • 61.8% of those who have paid off their student loan have also paid off their last vehicle
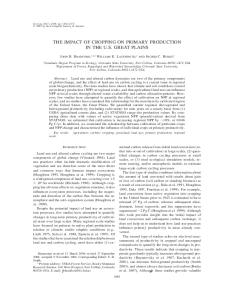
17
New Car Purchasing • Survey data suggest that student loan debt reduces annual aggregate New
vehicle spend by as much as $6.4 billion in the United States.
• Estimate calculated by: • Identifying sample average New/Used vehicle type, Purchase Year, and Model Year, within each income and student loan repayment status categories (“Currently paying on a student loan,” “Never had a student loan,” etc) • Calculating percentage of survey respondents who reported that they purchased a New Vehicle, which exhibited robust statistical differences across all household income categories under $150k • Collecting published auto industry data relative to top selling vehicle make and model, MSRP, average used car prices and depreciation • Extending sample means exhibited by subset who reported they “Never had a student loan” to the sample overall, and comparing the difference to unadjusted aggregate sample means • Calculate an estimated household vehicle purchase rate using the percentage of US households that have purchased a vehicle within the past ten years and adjusting by educational attainment and multicar households Estimate of vehicle spend based on publicly available price and value information for both New and Used Vehicles in recent years, and was calculated in order to generalize the potential impact beyond the sample of 61,762 survey respondents. • Estimate is necessarily conservative (lower dollar impact is estimated), because data were not available on educational attainment distribution within income categories (analysis used the US Census rate of 27.9% across all income categories), and excludes individuals who may have had a student loan but no Bachelor’s or Advanced Degree •
18
New Car Purchasing Estimated)Impact)of)Student)Loans)on)Vehicle)Spend)by)Household)Income Estimated)Vehicle)Spend)per) Household
Income)Category $150k&or&More $100k&=<&<&$150k $75k&=<&<&$100k $50k&=<&<$75k $25k&=<&<&$50k Less&than&$25k Total
n %%%%%%%%%%%%%%%%%%1,988 %%%%%%%%%%%%%%%%%%4,702 %%%%%%%%%%%%%%%%%%5,467 %%%%%%%%%%%%%%%%%%9,362 %%%%%%%%%%%%%%%10,608 %%%%%%%%%%%%%%%%%%7,264 %%%%%%%%%%%%%%%39,391
Estimated)US)Student)Loan) Sample) Estimated) Variance)per) Number)of)US) Debt)Households)that) Estimated)10Hyr) Estimated)Annual)Impact)))) Mean Spend)w/o)SLD Household Households)(2011) Purchased)Vehicle Financial)Impact (4)yr)avg)replacement)cycle) $%%%%%%%%%%%18,561 $%%%%%%%%%%%16,749 $%%%%%%%%%%%15,816 $%%%%%%%%%%%14,036 $%%%%%%%%%%%12,536 $%%%%%%%%%%%%%9,010 $%%%%%%%%%%%13,505
$%%%%%%%%%%%%%%%%%%18,916 $%%%%%%%%%%%%%%%%%%18,827 $%%%%%%%%%%%%%%%%%%18,042 $%%%%%%%%%%%%%%%%%%16,358 $%%%%%%%%%%%%%%%%%%13,879 $%%%%%%%%%%%%%%%%%%10,562 $%%%%%%%%%%%%%%%%%%15,279
$%%%%%%%%%%%%%%%%%%%%%%%355 $%%%%%%%%%%%%%%%%%%%2,078 $%%%%%%%%%%%%%%%%%%%2,226 $%%%%%%%%%%%%%%%%%%%2,322 $%%%%%%%%%%%%%%%%%%%1,343 $%%%%%%%%%%%%%%%%%%%1,553 $%%%%%%%%%%%%%%%%%%%1,775
%%%%%%%%%%%%%%%%%%%%%%%%%%10,018,782 %%%%%%%%%%%%%%%%%%%%%%%%%%13,864,597 %%%%%%%%%%%%%%%%%%%%%%%%%%13,503,035 %%%%%%%%%%%%%%%%%%%%%%%%%%20,697,584 %%%%%%%%%%%%%%%%%%%%%%%%%%28,087,658 %%%%%%%%%%%%%%%%%%%%%%%%%%28,820,069 %%%%%%%%%%%%%%%%%%%%%%%%114,991,725
%%%%%%%%%%%%%%%%%%%%%%%%%%%%%%%%%%%%%%%%%1,483,186 %%%%%%%%%%%%%%%%%%%%%%%%%%%%%%%%%%%%%%%%%2,062,478 %%%%%%%%%%%%%%%%%%%%%%%%%%%%%%%%%%%%%%%%%1,972,169 %%%%%%%%%%%%%%%%%%%%%%%%%%%%%%%%%%%%%%%%%2,889,565 %%%%%%%%%%%%%%%%%%%%%%%%%%%%%%%%%%%%%%%%%3,630,358 %%%%%%%%%%%%%%%%%%%%%%%%%%%%%%%%%%%%%%%%%3,016,634 %%%%%%%%%%%%%%%%%%%%%%%%%%%%%%%%%%%%%%%15,054,391
$%%%%%%%%%%%%%%%%%%%526,512,462 $%%%%%%%%%%%%%%%4,285,715,724 $%%%%%%%%%%%%%%%4,389,692,539 $%%%%%%%%%%%%%%%6,710,523,291 $%%%%%%%%%%%%%%%4,873,960,662 $%%%%%%%%%%%%%%%4,683,951,142 $%%%%%%%%%%%%%25,470,355,820
$%%%%%%%%%%%%%%%%%%%%%%%%%%%%%%131,628,115.42 $%%%%%%%%%%%%%%%%%%%%%%%%%%%%%%%%%1,071,428,931 $%%%%%%%%%%%%%%%%%%%%%%%%%%%%%%%%%1,097,423,135 $%%%%%%%%%%%%%%%%%%%%%%%%%%%%%%%%%1,677,630,823 $%%%%%%%%%%%%%%%%%%%%%%%%%%%%%%%%%1,218,490,166 $%%%%%%%%%%%%%%%%%%%%%%%%%%%%%%%%%1,170,987,785 $%%%%%%%%%%%%%%%%%%%%%%%%%%%%%%%%%6,367,588,955
Notes: Sample&Mean&is&the&estimated&average&aggregate&purchase&price&of&the&most&recent&vehicle&purchase&by&survey&respondents&within&household&income&categories&(source&Corvus&Insights) Average&purchase&price&calculated&based&on&sum&of&a)&blended&midpoint&of&published&MSRP's&for&top&ten&selling&new&vehicles&in&the&Year&of&Purchase;&and&b)&average&used&car&purchase&price&modified&by& Model&Year&depreciation&factor&(15%/annum)&(sources&include&Wall&Street&Journal,&edmunds,&autos.aol.com,&forbes.com,&money.cnn.com) Estimated&Spend&w/o&SLD&is&estimated&aggregate&purchase&price&based&on&ratio&of&New&vs.&Used&purchases,&Purchase&Year,&and&Model&Year&for&survey&respondents&who&"Never&Had&a&Student&Loan,"& extended&to&the&entire&sample& Number&of&US&Households&source:&factfinder.census.gov Estimated&US&Student&Loan&Debt&Households&that&Purchased&Vehicle&calculated&based&on&a&Corvus&Insights&estimates,&with&assumptions: 78%&of&households&purchased&a&vehicle&within&last&ten&years&(Corvus&Insights&research) 27.9%&of&Households&have&a&Bachelors&Degree&or&higher&(source&US&Census)& 60%&of&College&attendees¤tly&use&student&loans&to&fund&their&eduction&(source&Chronicle&of&Higher&Education) Annual&impact&is&calculated&assuming&a&4ayear&replacement&cycle,&based&on&sample&average&Purchase&Year&of&2009.&Survey&data&were&collected&during&May&2013
22
Methods • Data for Student Loans, Vehicle Purchasing and other household-level
information were collected via a web survey collected on-line during May 2013. • Survey link emailed to individuals who had opted in to an email list maintained by
one of twelve non-profit advocacy groups • Final sample size (eliminating opt-out observations): 61,762 • Sample demographics suggest oversampling of higher-income and more
educated individuals; this required stratification of key variables (e.g. household income) to address potential collection-associated error • Vehicle spend estimates were developed to improve generalizability of
economic impacts: sample Make and Model preferences exhibited strong regional characteristics that varied from national experience.
23
Methods • How did we estimate New vehicle spend? • Based on mean of the series of midpoints of published MSRP for the top ten-
selling vehicles for the sample Purchase Year (unweighted average of midpoints). Ford F-150 Truck: the Top Selling New Vehicle in the U.S.A for a remarkable 26 consecutive years. Model Year Example: 2012 (all vehicles)
24
Methods • How did we estimate Used vehicle spend? • Average 2012 Used Vehicle Purchase price (National Automobile Dealers
Association) modified by Mannheim Consulting’s Used Car Price Index, and mapped to Model Year sample means, factoring an industry “rule of thumb” standard depreciation of 15%/annum. Mannheim Consulting is a leading auto industry research firm.
index&source:&Mannheim&Consulting&Used&Car&Index $
17,267 source:http://www.nada.org/NR/rdonlyres/C1C58F5ACBE0EC4E1AC9B56C1C3025B5B452/0/NADADATA2012Final.pdf
Used Vehicle Model&Year&Depreciation&Estimate spend determined Mannheim&Used&Car&Index Relative&to&2012 Average&Purchase&Price 2011 2010 2009 2008 2007 2006 2005 2004 2003 2002 2001 2000 1999 by sample average 123.6 1 $&& & & & & & & & & & & & & & & 17,267 $&& & & 14,677 $&&12,475 $&&10,604 $&& &9,013 $&& &7,661 $&& &6,512 $&& &5,535 $&& &4,705 $&& &3,999 $&& &3,399 $&& &2,890 $&& &2,456 $&& &2,088 Purchase Year and Model Year 124.9 1.010517799 $&& & & & & & & & & & & & 17,448.61 $&&14,831 $&&12,607 $&&10,716 $&& &9,108 $&& &7,742 $&& &6,581 $&& &5,594 $&& &4,755 $&& &4,041 $&& &3,435 $&& &2,920 $&& &2,482 120.5 0.974919094 $&& & & & & & & & & & & & 16,833.93 $&&14,309 $&&12,163 $&&10,338 $&& &8,787 $&& &7,469 $&& &6,349 $&& &5,397 $&& &4,587 $&& &3,899 $&& &3,314 $&& &2,817 112.1 0.906957929 $&& & & & & & & & & & & & 15,660.44 $&&13,311 $&&11,315 $&& &9,617 $&& &8,175 $&& &6,949 $&& &5,906 $&& &5,020 $&& &4,267 $&& &3,627 $&& &3,083 106.7 0.863268608 $&& & & & & & & & & & & & 14,906.06 $&&12,670 $&&10,770 $&& &9,154 $&& &7,781 $&& &6,614 $&& &5,622 $&& &4,779 $&& &4,062 $&& &3,452 113.9 0.921521036 $&& & & & & & & & & & & & 15,911.90 $&&13,525 $&&11,496 $&& &9,772 $&& &8,306 $&& &7,060 $&& &6,001 $&& &5,101 $&& &4,336
Contact For more information about One Wisconsin Institute and the ProgressNow Education network Student Loan Debt campaign, contact: Scot Ross, Executive Director One Wisconsin Institute 608-204-0677
www.OneWisconsinInstitute.org