The Long-term Career Effects of Labor Market Entry during the Great Recession: Evidence from Japan’s “Lost Decade” Shota Araki, Takao Kato, Daiji Kawaguchi, and Hideo Owan* March 15, 2011 For the TPLS meeting in Kyoto, March 2012 Abstract Policy makers around the world face a challenge of assessing the long-term effects of the financial meltdown in the fall of 2008 and the subsequent Great Recession on the economic, political, and social life of each country, and develop effective policy responses. Unfortunately it has been only a few years since the current Great Recession started. As such we do not have sufficiently long data to carry out such a long-term impact assessment. This paper takes advantage of the fact that Japan experienced an equally severe and prolonged economic stagnation (if not more) two decades ago. We conduct an institutionally-informed econometric analysis of detailed personnel records from a large machine parts producer for all employees who joined the firm from 1991 to 2010, which includes Japan’s Great Recession. We find that new college graduates (who finished colleges and joined the labor market in the midst of Japan’s Great Recession) who enter the company during the recession did not suffer from slow promotion and benefitted from higher wages and bonus payment because of fewer rivals in the same cohort. Japan’s Great Recession is found to have little negative long-term effects on career of those who entered the labor market and found jobs in the midst of the severe downturn. Our findings imply that the burden of Japan’s Great Recession in terms of labor market outcomes was probably borne mostly by those who entered the labor market during the Great Recession AND failed to find regular jobs. (JEL codes: J24 and M5) *Shota Araki is a Ph.D. student, Hitotsubashi University (
[email protected]). Takao Kato is W.S. Schupf Professor of Economics and Far Eastern Studies, Colgate University (
[email protected] ); Research Fellow, IZA Bonn; Research Associate, Center on Japanese Economy and Business (Columbia Business School), Tokyo Center for Economic Research (University of Tokyo), and Center for Corporate Performance (Aarhus University). Daiji Kawaguchi is Associate Professor, Faculty of Economics, Hitotsubashi University (
[email protected]); Research Fellow, IZA Bonn; Research Associate, Tokyo Center for Economic Research; and Faculty Fellow, Research Institute of Economy, Trade and Industry. Hideo Owan is Professor in the Institute of Social Science, the University of Tokyo, Japan and Visiting Scholar, Stanford University (
[email protected]).
9
The Long-term Career Effects of Labor Market Entry during the Great Recession: Evidence from Japan’s “Lost Decade” I. Introduction One of the most pressing issues facing the U.S. is to assess the long-term effects of the financial meltdown in the fall of 2008 and the subsequent Great Recession on the economic, political, and social life of the country. To respond to the urgent need to inform policy makers on such an important issue, researchers have been undertaking a variety of research projects. A major challenge for such undertakings is the lack of data which cover a sufficiently long time period and hence enable researchers to assess the long-term consequences of the Great Recession. After all, it has been only a few years since the Great Recession began. Fortunately, there was another Great Recession across the Pacific two decades ago. At the end of 1980s, the financial and real estate bubble were burst rather violently in Japan, which set the country into a prolonged economic stagnation, or the “Lost Decade”. Notwithstanding some important differences between Japan’s lost decade and the Great Recession, there are some intriguing similarities (Koo, 2008). A number of serious attempts have been made to contrast the Great Recession to Japan’s “Lost Decade” in the 1990s, in search for historical lessons with regard to the causes and consequences of such severe and prolonged recession as well as appropriate policy responses (see, for instance, Hamada, Kashyap, and Weinstein, 2011 and Hoshi and Kashyap, 2010). This paper provides the first rigorous evidence on the long-term effects on career development of Japanese workers who entered the labor market during Japan’s Great 10
Recession. We do so by taking advantage of our unusual access to detailed personnel records of all workers who joined a large machine parts maker in Japan (hitherto called MachineParts) during 1991-2010.1 Most importantly in addition to standard personnel data on each worker, our data contain data on the size of the clearly-defined entry cohort (number of all workers who joined MachineParts as new college graduates in the same year) along with each worker’s job rank and annual evaluation in each subsequent year. Specifically our data will enable us to study career development of each worker over fifteen years since he/she joined the firm in the midst of Japan’s Great Recession (mid1990s). On our reading of the literature, this is really the first evidence on the long-term career effects of labor market entry during a Great Recession. As such, our findings should help U.S. policy makers make more informed decision on their public policy to address the long-term impact on American workers of the Great Recession. Though we are the first to provide evidence on the long-term career effects of labor market entry during a Great Recession of this magnitude, there is a rich literature on the long-term employment effects of labor market entry conditions. Such cohort effects are analyzed theoretically by Beaudry and NiNardo (1991) and Gibbons and Waldman (2006), Much of the empirical works focuses on cohort effects in wages (Oyer, 2006, von Wachter and Bender, 2006, Kahn, 2010, and Genda, Kondo and Ohta, 2010). On our reading of the literature, Kwon, Milgrom and Hwang (2010) is the only study to examine cohort effects in long-term career development (promotion). The case study part of their paper is probably the closest to our paper, and hence we will contrast
1
Due to the confidentiality agreement with the firm, we are not allowed to release the name of the firm.
11
our findings to their findings from the case study of insurance adjusters working for a large insurance firm in the U.S. In the next section, we will introduce our data in details, followed by the empirical strategy and results. The concluding remarks will be provided in the last section.
II. Data We collected human resource data from a Japanese machine part manufacturer which has about 8,000 employees within Japan and 24,600 employees worldwide as of March 2010. The dataset consists of detailed payroll information and evaluation records as well as the history of job assignment for all workers who ever worked for the firm’s Japanese plants including the headquarters during 1991-2010. Important employee characteristics available in the dataset include gender, age, tenure, educational level and marital status. The company has restrained its hiring and spun off some operations and, as a result, total employment declined by 35% from 1992 through 2004. Despite such a rough business environment it experienced, the company largely maintained its job structures and main human resource management policies, which is characterized by “skill rank system”. Between 1991 and 2010, roughly 40% of new hires had college degrees or higher and the 18% are new college graduates. For our current study, we focus on this group—those with a college degree who entered the firm as new graduates during the period. Women account for 15% of this group of new hires. Over the same period, the company also increased its hiring of mid-career job changers deviating from its long12
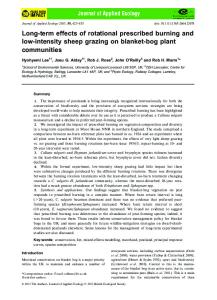
held practice of hiring only new graduates. In the following analysis, we divide observations into two samples by whether new college graduates hold science and engineering degree or social sciences and humanities degree. Those with science and engineering degrees are hired as engineers while those with social science and humanities degrees are hired as clerical, sales and managerial workers. AutoParts prepares separate career tracks for each worker. Reflecting their human resource management practices, we analyze two careers separately. Figure 1 shows the cohort size of new college graduates for each entry year. Since the dataset does not include the employees who quit before December 1990, there is truncation for the cohort before 1991. This is why our analyses only use the date in 1991 and after. As the figure shows, the cohort size shrank down from 51 in 1992 to 16 in 1993 for graduates of science and engineering measure — less than half of the peak mainly due to negative demand shock to the company. After four years of “hiring freeze”, the cohort size rebounded to 26 in 1998. After year 2000, the number of new hire was on a growing trend until the financial shock reduced new hire from 2009. Tracing the same trend, the new hire of graduates of social science and humanities major also shrank abruptly in 1994 and recovered in 1997. The growth of new hire was rather limited for this group of workers. As an initial look at the cohort size effect on promotion, we compared the composition of job ranks 10 years after the entry among the cohort groups of 19931998. As Table 1 shows, among graduates of science and engineering major, those who entered the company between 1994 and 1997 are twice more likely to be promoted to the rank of Shusa (vice supervisor) than those who entered the company before 1994 or 13
after 1996. Among graduates of social science and humanities major, those who entered the company between 1994 and 1996 and belong to small cohort group, are less likely to stay in 2nd grade. The selection of new entrants in years of smaller entry cohort may be more selective than other years because the market for new graduates is favorable to recruiting firms. To examine this possibility, we examine sex and educational background of new entrants by the year of entry. Table 2 shows, among science and engineering major graduates, very small fraction of entrants was female. Around 25 to 40 percent graduated from 3rd tier national university and around 15 to 40 percent graduated from 3rd tier private university. The fractions of female or graduates from good schools do not correlate systematically with the cohort size. Among graduates of social science and humanities major, the fraction of female is higher than the graduates of science and engineering major. Also the majority of new entrants are the graduates from private universities. Overall, it is difficult to find a systematic evidence that the fraction of female and the quality of school depend on the sizes of entry cohorts.
III. Empirical Strategy and Results We examine how worker’s cohort size (number of new college graduates who entered the firm in the same year) affects her promotion and compensation using data between 1991 and 2010. To examine the effect of cohort size on promotion, we estimate a proportional
14
hazard model of the worker’s time to be promoted to a certain rank as a function of her cohort size as well as her gender. The descriptive statistics of analysis sample is reported in Table 3. The analysis sample for graduates of science and engineering major contains about 56,000 person-month observations covering the period between 1991 and 2010. During the sample period, the cohort size varies between 14 and 117 reflecting the boom and bust periods of the company as we have already seen in Figure 1. The sample for graduates of social science and humanities major is about half in its size. In the survival analysis, we ignored one type of outcome, exit from the firm (or separations). If the probability of exit is correlated with cohort size, ignoring this option will pose potentially serious bias on our analysis. Fortunately, as shown in Table 4, our estimation of a probit model of the probability of exit as a function of cohort size and other controls confirms that the estimated marginal effect on the probability of exit of cohort size is small and highly insignificant, suggesting that ignoring the exit outcome may not pose serious bias.2 The estimated coefficients for proportional hazard model are reported in Table 5. Among the graduates of science and engineering major, the size of cohort is virtually
2
Though it is clearly beyond the scope of the paper, women are found to be significantly more apt to exit than men.
15
irrelevant to the time to be promoted. Increase of cohort size by 10 persons prolongs the time to be promoted to 2nd class by 0.1. In contrast, the estimated effects on the time to be promoted to 3rd class, vice-supervisor and supervisor are negative. Increase of cohort size by 10 persons shortens the time to be promoted to 3rd class, vice supervisor and supervisor by less than 0.4 percent. We also find the absence of cohort effect on the speed of promotion among graduates of social science and humanities major. Overall, new graduates who entered MachineParts during the Great Recession did not suffer nor benefit from smaller cohort size in terms of promotion. The finding that those who entered MachineParts during the great recession did not suffer from slower promotion can be explained by the better quality of entrants because the selection process might have been tougher during the recession period. To assess this possibility, we examine if workers who belong to smaller cohort graduated from better schools. Table 6 reports the estimation results of multinominal logit regression of school category on cohort size. The estimation results for graduates of science and engineering major shows that those who belong to larger entry cohort are less likely to graduate from national universities or 1st or 2nd tier private schools and more likely to graduate from 3rd tier private school. This result is consistent with the view that those who enter the company during the recession are better qualified. On
16
contrary, we do not find a systematic relationship between the cohort size and educational background among graduates for social science and humanities major. To control for the difference of the educational background that is correlated with cohort size, the dummy variables for educational background are included in the proportional hazard model. As reported in Table 7, after conditioning on the school a worker graduated, those who belong to larger cohorts take longer time to be promoted to 2nd class but the results reversed for the time to be promoted to 3rd class, vice supervisors or supervisor among graduates of science and engineering major. As expected, female workers take longer time to be promoted to 2nd and 3rd classes. Rather surprising at the first glance, those who graduated from better schools generally take longer time to be promoted. This indicates that MachineParts does not use educational background for promotion decision. Conditional on the selection into MachineParts, those workers graduated from elite schools do not have advantage over those workers from mediocre schools. In short, our proportional hazard estimates suggest that a new college graduate (who finished her college and joined MachineParts in the midst of Japan’s Great Recession) neither suffered nor benefitted from the cohort effect in promotion as a result of her reduced cohort size.
17
Our finding of the absence of cohort effect in promotion is in stark contrast to Kwon, Milgrom and Hwang (2010) who conduct a similar econometric case study of a U.S. firm, and find the positive cohort effect in promotion. We speculate that institutional differences in promotion tournament between the U.S. and Japan may account for such a sharp difference between the two studies. Specifically the contestant pool is more rigidly defined according to the year of entry to the firm in Japan than in the U.S., and hence the cohort size is tied to the size of the contestant pool more strictly in Japan than in the U.S. Furthermore, Japan’s celebrated “long-term” employment system makes it difficult for outsiders to compete for mid-level management positions in large firms in Japan (for Japan’s long-term employment and its recent changes, see, for example, Ono, 2010, Kambayashi and Kato, 2011 and Kawaguchi and Ueno, 2010). As such, the size of the contestant pool reflects the cohort size more strongly in Japan than in the U.S. We now turn to the cohort effect in wages. Table 8 shows the OLS estimates of the standard Mincerian wage equation augmented by the cohort size variable, or log of monthly wage as a function of cohort size, gender, tenure, and the type of schools, as well as year dummy variable. As shown above, entry cohort size does not affect the annual probability of promotion to higher job ranks. However, to see if we still observe
18
the cohort effect on wage when the cohort effect in promotion is accounted for, we repeat the same analysis, including job rank as an additional control variable. Without controlling for job rank, the estimated coefficient on cohort size is negative and statistically significant, but the size of the estimated coefficient suggests a negligible cohort effect on wage. When cohort size shrinks by 10 persons, the average worker’s monthly wage will be 0.2 percent higher among graduates of science and engineering major. When the cohort effect in promotion is accounted for (by including job rank as an additional control), as expected, the absolute value of the estimated coefficient on Cohort size falls further. Similarly, the estimated coefficient for the cohort size is virtually zeros among graduates of social science and humanities major. In sum, we did not find evidence for cohort size effect for monthly wages. Next, we repeat the same analysis of the cohort effects in wages, using bonus instead of monthly wages. The Japanese bonus payment system has attracted considerable attention and controversy, in particular the debate between those who stress that the bonus system makes the Japanese payment system more sensitive to firm performance (especially profitability) and those who argue that bonus is simply a disguised regular wage and that it is introduced largely for tax advantages.3 The long-
3
For the debate, see for example Freeman and Weitzman (1987), Ohashi (1989), Hashimoto (1990), Brunello (1991), Hart and Kawasaki (1999), and Kato and Kubo (2006).
19
standing debate over the nature of the Japanese bonus system can be extended to the cohort effect. If bonus is simply a disguised regular wage, on the one hand, we should expect to find negative cohort effects in bonus. On the other hand, if bonus is a form of “profit sharing” which is more sensitive to current firm performance, we are less likely to find negative cohort effects and perhaps we may even find positive cohort effects (or bonus tends to be lower for those who enter the labor market during the Great Recession since bonus is more sensitive to firm performance than regular wages). Table 9 summarizes the OLS estimates of the same Mincerian wage equation augmented by cohort size with one exception that bonus is used instead of monthly wages. The estimated coefficients on cohort size are negative and statistically significant. The magnitude of the coefficient is economically meaningful. When the cohort size increases by 10 persons, the bonus decreases by 11.6 percent among graduates of science and engineering major. After controlling for job rank and performance evaluation, the coefficient estimate falls by two thirds, yet it is statistically significant and economically meaningful. When the cohort size increases by 10 persons, the bonus amount decreases by 7.5 percent. We find similar magnitudes for graduates of social science and humanities major. As such, our cohort effect estimates tend to favor the view that the Japanese bonus system is disguised wages used as an adjustment
20
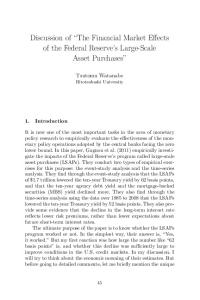
margin to compensate scarce workers. Again, our negative cohort effects in bonus payment are in sharp contrast to the positive cohort effects found for insurance adjusters in a large U.S. insurance firm by Kwon, Milgrom and Hwang (2010). To make sure that the contrasting result we found for a large Japanese manufacturing firm is not due to the fact that Kwon, Milgrom and Hwang (2010) use cohort dummy variables instead of cohort size directly, we repeated the same analysis, using cohort dummy variables instead of cohort size. The results are summarized in Figure 2, which is comparable to Figure 10 in Kwon, Milgrom and Hwang (2010). Reassuringly even when we use cohort dummy variables, we still find the NEGATIVE as opposed to positive cohort effects in wages among graduates of science and engineering major. Specifically, for those workers who joined MachineParts as new college graduates in 1994, 1995 and 1996, on the one hand, the size of their entry cohorts is substantially lower than other cohorts (except for cohort 2000). On the other hand, their regression-adjusted wages net of observable worker characteristics (or the estimated coefficients on the relevant cohort dummy variables) are substantially higher than other cohorts. Likewise, we observe the opposite pattern for those who joined MachineParts in 1991, 1992, 2007 and 2008, lower regression-adjusted wages and
21
larger cohort sizes. The figure also confirms that even if we account for the cohort effects in promotion, we still find the same patterns.
IV. Conclusions
Policy makers around the world face a challenge of assessing the long-term effects of the financial meltdown in the fall of 2008 and the subsequent Great Recession on the economic, political, and social life of each country, and develop effective policy responses. Unfortunately it has been only a few years since the current Great Recession started. As such we do not have sufficiently long data to carry out such a long-term impact assessment. This paper has taken advantage of the fact that Japan experienced an equally severe and prolonged economic stagnation (if not more) two decades ago. We have conducted an institutionally-informed econometric analysis of detailed personnel records from a large machine parts producer for all employees who joined the firm from 1991 to 2010, which includes Japan’s Great Recession.
We have found that new college graduates (who finished colleges and joined the labor market in the midst of Japan’s Great Recession) actually benefitted from the cohort effect in receiving higher bonus payment as a result of her reduced cohort size.
22
Therefore entering the labor market during Japan’s Great Recession benefitted Japanese workers in terms of obtaining higher bonus payment. Such negative cohort effects in bonus payment have been found to be still present even after rank and performance evaluation are accounted for.
Japan’s Great Recession has been found to have little negative long-term effects on career of those who entered the labor market and found jobs in the midst of the severe downturn. Our findings imply that the burden of Japan’s Great Recession in terms of labor market outcomes was probably borne mostly by those who entered the labor market during the Great Recession AND failed to find regular jobs.
23
References Beaudry, Paul and DiNardo, John. "The Effect of Implicit Contracts on the Movement of Wages over the Business Cycle: Evidence from Micro Data." Journal of Political Economy, 1991, 99(4), pp. 665-88. Genda, Yuji; Kondo, Ayako and Ohta, Souichi. "Long-Term Effects of a Recession at Labor Market Entry in Japan and the United States." Journal of Human Resources, 2010, 45(1), pp. 157-96. Gibbons, Robert and Waldman, Michael. "Enriching a Theory of Wage and Promotion Dynamics inside Firms." Journal of Labor Economics, 2006, 24(1), pp. 59-107. Hamada, Koichi; Kashyap, Anil and Weinstein, David eds. Japan’s Bubble, Deflation, and Stagnation. Cambridge, MA: MIT Press, 2011. Hoshi, Takeo and Kashyap, Anil K. "Will the U.S. Bank Recapitalization Succeed? Eight Lessons from Japan." Journal of Financial Economics, 97(3), pp. 398-417. Kahn, Lisa B. "The Long-Term Labor Market Consequences of Graduating from College in a Bad Economy." Labour Economics, 2010, 17(2), pp. 303-16. Kambayashi, Ryo and Kato, Takao. "The Japanese Employment System after the Bubble Burst: New Evidence," K. Hamada, A. Kashyap and D. Weinstein, Japan’s Bubble, Deflation, and Stagnation Cambridge, MA: MIT Press, 2011a, 217-62. Kato, Takao and Kubo, Katsuyuki. "Ceo Compensation and Firm Performance in Japan: Evidence from New Panel Data on Individual Ceo Pay." Journal of the Japanese and International Economies, 2006, 20(1), pp. 1-19. Kawaguchi, Daiji and Ueno, Yuko. "Trends of Job Stability in Japan," Paper presented by the Trans Pacific Labor Seminar. Santa Barbara, CA, 2010. Koo, Richard. The Holy Grail of Macroeconomics: Lessons from Japan's Great Recession. Wiley, 2009. Kwon, Illoong; Milgrom, Eva Meyersson and Hwang, Seiwoon. "Cohort Effects in Promotions and Wages: Evidence from Sweden and the United States." Journal of Human Resources, 2010, 45(3), pp. 772-808. Ono, Hiroshi. "Lifetime Employment in Japan: Concepts and Measurements." Journal of the Japanese & International Economies, 2010, 24(1), pp. 1-27. Oyer, Paul. "Initial Labor Market Conditions and Long-Term Outcomes for Economists." Journal of Economic Perspectives, 2006, 20(3), pp. 143-60.
24
Table 1: Job Rank and Compensation at 10 Years of Job Tenure Graduates of Science and Engineering Major Year of Entry Supervisor Vice Supervisor 3rd Grade 2nd Grade Observations
1993 0 21.43 73.57 4.76 42
1994 0 43.75 56.25 0 16
1995 0 45.45 54.55 0 11
1996 0 46.67 53.33 0 15
1997 0 42.86 57.14 0 7
1998 3.85 19.23 76.92 0 26
Graduates of Social Science and Humanities Major Year of Entry Supervisor Vice Supervisor 3rd Grade 2nd Grade Observations
1993 0 23.81 66.67 23.81 21
1994 0 10.00 90.00 0 10
1995 0 13.33 86.67 0 15
1996 0 12.50 87.50 0 8
1997 0 6.25 84.38 9.38 32
Note: Standard errors are in parenthesis. We cannot observe Summer bonus on 2003 July. Source: Personnel records provided by MachineParts
25
1998 0 13.16 78.95 7.89 38
Table 2: Characteristics of Entrants by Cohort Graduates of Science and Engineering Major Year of Entry Cohort Size Female Educational Background 1st Tier National Univ. 2nd Tier National Univ. 3rd Tier National Univ. 1st Tier Private Univ. 2nd Tier Private Univ. 3rd Tier Private Univ.
1993 53 0
1994 19 0
1995 14 0
1996 19 0.11
1997 15 0.07
1998 34 0
0.04 0.06 0.42 0.04 0.06 0.40
0 0.16 0.26 0.11 0.21 0.26
0 0 0.43 0.14 0.14 0.29
0.05 0 0.42 0.11 0.11 0.32
0.2 0.27 0.33 0 0 0.2
0.14 0.09 0.41 0.15 0.06 0.15
Graduates of Social Science and Humanities Major Year of Entry Cohort Size Female Educational Background 1st Tier National Univ. 2nd Tier National Univ. 3rd Tier National Univ. 1st Tier Private Univ. 2nd Tier Private Univ. 3rd Tier Private Univ.
1993 33 0.30
1994 13 0.15
1995 20 0.05
1996 16 0.31
1997 54 0.43
1998 63 0.30
0 0 0.12 0.12 0.36 0.39
0 0 0.15 0.23 0.23 0.38
0 0 0.15 0.10 0.45 0.30
0 0.06 0.06 0.13 0.19 0.56
0.06 0.02 0.06 0.20 0.26 0.40
0.03 0 0.16 0.16 0.30 0.35
Note: University classifications are followings: 1st tier national university:
26
Table 3: Descriptive Statistics, College Graduate White Collar, 1991‐2010, Wages Only Available 2003 and After
Graduates of Science and Engineering Major Variable
N
Mean
Cohort Size Female Tenure Monthly Wage Summer Bonus Winter Bonus Job Rank 1st Class 2nd Class 3rd Class Vice Supervisor Supervisor (Shusa) Vice Manager (2) Vice Manager (1) Manager (2) Manager (1) Educational Background 1st Tier National Univ. 2nd Tier National Univ. 3rd Tier National Univ. 1st Tier Private Univ. 2nd Tier Private Univ. 3rd Tier Private Univ.
56651 56651 56651 56651 5160 4622
64.56 0.04 6.58 254963 754387 831461
27.70 0.03 5.44 123897 340243 236994
56651 56651 56651 56651 56651 56651 56651 56651 56651
0.38 0.21 0.17 0.14 0.07 0.02 0.004 0.003 0.0007
0.48 0.40 0.38 0.35 0.25 0.15 0.06 0.06 0.03
0 0 0 0 0 0 0 0 0
1 1 1 1 1 1 1 1 1
56651 56651 56651 56651 56651 56651
0.06 0.08 0.36 0.05 0.10 0.35
0.24 0.28 0.48 0.21 0.30 0.13
0 0 0 0 0 0
1 1 1 1 1 1
27
Std. Dev.
Min
Max
14 117 0 1 0 19 0 451700 5000 2239000 5000 2280783
Graduates of Social Science and Humanities Major Variable
N
Mean
Cohort Size Female Tenure Monthly Wage Summer Bonus Winter Bonus Job Rank 1st Class 2nd Class 3rd Class Vice Supervisor Supervisor (Shusa) Vice Manager (2) Vice Manager (1) Manager (2) Manager (1) Educational Background 1st Tier National Univ. 2nd Tier National Univ. 3rd Tier National Univ. 1st Tier Private Univ. 2nd Tier Private Univ. 3rd Tier Private Univ.
28688 28688 28688 28688 2515 2384
37.11 0.11 8.48 235824 812243 846419
17.99 0.32 5.28 114384 303481 194453
28688 28688 28688 28688 28688 28688 28688 28688 28688
0.28 0.20 0.21 0.17 0.10 0.03 0.004 0.001 0
0.45 0.40 0.40 0.38 0.27 0.16 0.07 0.03 0
0 0 0 0 0 0 0 0 0
1 1 1 1 1 1 1 1 0
28688 28688 28688 28688 28688 28688
0.01 0.01 0.14 0.09 0.33 0.40
0.11 0.11 0.35 0.29 0.47 0.49
0 0 0 0 0 0
1 1 1 1 1 1
Source: Personnel records provided by MachineParts
28
Std. Dev.
Min
Max
4 63 0 1 0 19 0 418300 5000 1470137 5000 1556870
Table 4: Effect of Cohort Size on Quit, College Graduate White Collar 1991‐2010
Graduates of Natural Science and Engineering Major Dep. Var.
Separation Probit
Cohort Size(10 persons)
0.037 (0.028)
Female
Tenure
0.420 (0.124)
0.182 (0.058)
Tenure2 /100
-1.567 (0.420)
Psuedo R2
0.06
N
56651
Graduates of Social Science and Humanities Major Dep. Var.
Separation Probit
Cohort Size(10 persons)
0.014 (0.030)
Female
Tenure
0.569 (0.094)
0.062 (0.041)
Tenure2 /100
-0.750 (0.306)
Psuedo R2
0.09
N
28688
Source: Personnel records provided by MachineParts
Note: Specification includes year dummy variables but coefficients are not reported. Cohort size refers to the number of new college graduate entrant who entered the company in the same year.
29
Table 5: Effect of Cohort Size on Promotion, College Graduate White Collar 1991‐2010, Parametric Regression Survival‐Time Model with Weibull distribution, Coefficients
Graduates of Science and Engineering Major 2nd Class
3rd Class
(S.E) [exp(b)]
0.001 (0.0002) [1.001]
Female (S.E) [exp(b)] ߙො Observations Log-likelihood
Cohort Size (10 persons)
-0.002 (0.0002) [0.998]
Vice Supervisor -0.004 (0.0003) [0.996]
-0.002 (0.0004) [0.998]
0.375 (0.247) [1.455]
0.472 (0.456) [1.602]
-13.018 (709.478) [>0]
-12.727 (1385.993) [>0]
1.067 44606 -995.376
1.564 49299 -517.960
3.824 49308 -182.1632
6.253 51778 -81.124
Source: Personnel records provided by MachineParts
30
Supervisor
Graduates of Social Science and Humanities Major 2nd Class
3rd Class
(S.E) [exp(b)]
-0.007 (0.0006) [0.994]
Female (S.E) [exp(b)] ߙො Observations Log-likelihood
Cohort Size (10 persons)
-0.001 (0.0005) [0.998]
Vice Supervisor -0.0027 (0.0005) [0.997]
-0.0002 (0.0007) [0.9997]
0.753 (0.244) [2.125]
0.054 (0.307) [1.055]
-0.791 (0.418) [0.454]
-1.833 (1.007) [0.160]
1.303 21493 -300.9172
1.856 22986 -270.269
3.766 23259 -136.896
6.221 24851 -49.972
Source: Personnel records provided by MachineParts
31
Supervisor
Table 6: The Effect of Cohort Size on Educational Background, Multinominal Logit Estimated Coefficients Graduates of Science and Engineering Major M.E 1st Tier 2nd Tier 3rd Tier 1st Tier 2nd Tier National National National Private Private Cohort -0.006 -0.0006 -0.0005 -0.0001 -0.00006 Size (0.00004) (0.00004) (0.00007) (0.000032) (0.00005) Female 0.0079 -0.0027 -0.1130 -0.0144 0.0576 (0.0057) (0.0069) (0.0121) (0.0057) (0.0056) Note: N=56651, Log likelifood=-83300.209, Pseudo R2=0.0074. Graduates of Social Science and Humanities Major M.E 1st Tier 2nd Tier 3rd Tier 1st Tier National National National Private Cohort 0.00045 -0.00054 -0.00021 0.00046 Size (0.00005) (0.00005) (0.00011) (0.00010) Female 0.0023 0.0137 -0.0594 0.0790 (0.0019) (0.0017) (0.0076) (0.0043) Note: N=28688, Log likelifood=-38189.157, Pseudo R2=0.0128.
32
2nd Tier Private 0.00088 (0.00015) -0.1460 (0.0098)
Table 7: Effect of Cohort Size on Promotion, College Graduate White Collar 1991‐2010, Parametric Regression Survival‐Time Model with Weibull distribution, Coefficients
Graduates of Science and Engineering Major, School Controlled, Subjects=1029 2nd Class
3rd Class
(S.E) [exp(b)]
0.017 (0.002) [1.016]
Female (S.E) [exp(b)]
-0.019 (0.002) [0.981]
Vice Supervisor -0.042 (0.004) [0.959]
-0.192 (0.005) [0.980]
0.425 (0.249) [1.530]
0.483 (0.456) [1.620]
-13.565 (955.447) [>0.000]
-13.223 (1838.226) [>0.000]
1st Tier National
0.807 (0.224) [2.241]
1.244 (0.232) [3.472]
0.164 (0.348) [1.179]
1.073 (0.392) [2.924]
2nd Tier National
0.875 (0.191) [2.399]
1.017 (0.536) [2.767]
-0.153 (0.338) [0.858]
0.950 (0.384) [2.586]
3rd Tier National
0.592 (0.126) [1.807]
0.442 (0.228) [1.555]
0.256 (0.198) [1.292]
-0.140 (0.214) [0.869]
1st Tier Private
0.882 (0.241) [2.417]
1.003 (0.297) [2.727]
0.656 (0.373) [1.928]
0.796 (0.544) [2.217]
2nd Tier Private
0.671 (0.185) [1.955]
0.695 (0.246) [2.005]
-0.028 (0.322) [0.972]
0.488 (0.433) [1.628]
ߙො Observations Log-likelihood
1.106 44606 -974.975
1.630 49299 -499.623
3.870 49308 -179.520
6.580 51778 -73.829
Cohort Size (10 persons)
Supervisor
Social Science and Humanities Major, School Controlled, Subjects=463 2nd Class
3rd Class
(S.E) [exp(b)]
-0.066 (0.006) [0.935]
Female (S.E)
0.836 (0.260)
Cohort Size(10 persons)
33
-0.010 (0.005) [0.990]
Vice Supervisor -0.305 (0.006) [0.970]
Supervisor -0.001 (0.007) [0.990]
-0.115 (0.316)
-0.655 (0.429)
-1.893 (0.712)
[exp(b)]
[2.30]
[0.892]
[0.519]
[0.150]
1st Tier National
0.627 (0.730) [1.871]
1.492 (0.609) [4.448]
2.338 (0.635) [10.358]
-14.310 (1589.324) [>0]
2nd Tier National
-0.476 (0.748) [0.621]
2.100 (0.273) [8.169]
1.309 (0.738) [3..704]
-13.341 (1616.597) [>0]
3rd Tier National
0.089 (0.275) [1.093]
0.207 (0.228 [1.230]
0.702 (0.265) [2.020]
-0.059 (0.346) [0.942]
1st Tier Private
-0.189 (0.361) [0.828]
0.899 (0.279 [2.458]
1.247 (0.327) [3.483]
0.217 (0.447) [1.243]
2nd Tier Private
0.175 (0.209) [1.190]
-0.188 (0.227) [0.829]]
0.577 (0.223) [1.780]
-0.364 (0.320) [0.694]
1.312 21493 -299.700
1.953 22986 -257.977
4.052 23259 -123.967
6.292 24851 -47.745
ߙො Observations Log-likelihood
Source: Personnel records provided by MachineParts. The groups of universities are classified as following. 1st tier national university: Tokyo, Kyoto, TIT, Hitotsubashi, Osaka. 2nd tier national university: Hokkaido, Tohoku, Nagoya, Kyushu, Tsukuba, Kobe. 3rd tier national university: Other national universities. 1st tier private university: Keio, Waseda, Jochi (Sophia). 2nd tier private university: Meiji, Aoyama, Rikkyo (St. Paul’s), Chuo, Hosei, Kwansei Gakuin, Kansai, Doshisha, Ritsumeikan, Gakushuin, Nanzan. 3rd tier private university: Other private universities.
34
Table 8: Effect of Cohort Size on ln(Monthly Wage), College Graduate White Collar 1991‐2010 Graduates of Science and Engineering Major
Specification Cohort
Female
Tenure
Size(10 persons)
Without Rank
-0.0019
-0.020
0.044
R2 1st Tier 2nd Tier 3rd Tier 1st Tier 2nd National National National Private Tier Private -0.061 0.053 0.034 0.038 0.043 0.004 0.90
Tenure2 (/100)
(0.0001) (0.001) (0.0002) (0.001) With Rank
-0.0005
-0.015
(0.001)
(0.001)
0.016
-0.017
0.029
0.021
(0.0001) (0.001) (0.0002)
(0.001
(0.001)
(0.001)
(0.001) (0.001) (0.001) 0.027
0.024
(>0) (0.001)
0.001 0.96 (>0)
Note: N=51383. Year dummy variables are included. Graduates of Social Science and Humanities Major Specification Cohort
Female
Tenure
Tenure2 (/100)
-0.070
0.045
-0.051
Size(10 persons)
Without Rank
-0.0008
With Rank
R2 1st Tier 2nd Tier 3rd Tier 1st Tier 2nd National National National Private Tier Private 0.039 0.077 0.038 0.022 0.011 0.92
(0.0002) (0.001) (0.0003) (0.001)
(0.003)
(0.001)
(0.001)
(0.001) (0.001)
-0.0014
0.015
0.035
0.016
0.007
(0.002)
(0.001)
(0.001) (0.001)
-0.034
0.022
-0.036
(0.0001) (0.001) (0.0002) (0.0009) (0.002) Note: N=24176 Source: Personnel records provided by MachineParts
35
0.007
0.97
Table 9: Effect of Cohort Size on (Annual Bonus/Monthly Wage), College Graduate White Collar 2004‐2009 Graduates of Science and Engineering Major, N=4292
Cohort Size (10person)
Specification
Without Rank and Evaluation With Rank and Evaluation
Female
Tenure
Tenure2 (/100)
-0.116 -0.279 0.416 -1.886 ( 0.034) (0.332) (0.057) ( 0.341 ) -0.075 -0.335 0.685 -3.130 ( 0.037 ) (0.336) (0.089 ) ( 0.454 )
R2 1st Tier 2nd Tier 3rd Tier 1st Tier 2nd National National National Private Tier Private -0.221 -0.049 -0.228 -0.461 -0.097 0.11 (0.277) (0.242) (0.150) (0.306) (0.228) -0.172 -0.042 -0.165 -0.407 -0.142 0.13 (0.280) (0.244) (0.152) (0.310) (0.229)
Graduates of Social Science and Humanities Major, N=2089 Cohort Size (10person)
Specification
Without Rank and Evaluation With Rank and Evaluation
Female
Tenure
Tenure2 (/100)
-0.125 -0.346 0.417 -1.641 ( 0.059) (0.272) (0.065) ( 0.395 ) -0.108 -0.083 0.486 -2.243 ( 0.060 ) (0.305) (0.112) ( 0.556 )
R2 1st Tier 2nd Tier 3rd Tier 1st Tier 2nd National National National Private Tier Private -0.498 -0.531 -0.245 0.315 -0.170 0.11 (0.735) (0.768) (0.268) (0.326) (0.210) -0.341 -0.506 -0.395 0.241 -0.211 0.12 (0.737) (0.803) (0.274) (0.328) (0.212)
Note: Specification includes year dummy variable and Educational background dummy variables. In the specification with rank and evaluation, the interaction of Evaluation Dummy (A, B, C and D) ×Ability-based rank dummy variables are all included. Source: Personnel records provided by MachineParts
36
Figure 1: Size of Entry Cohort, College‐graduate White Collar
Graduates of Natural Science and Engineering Major
0
50
Frequency 100
150
1990
1995
2000
2005
2010
nyu_nen
0
20
Frequency 40
60
Graduates of Social Science and Humanities Major
1990
1995
2000
2005
nyu_nen
37
2010
Figure 2: Cohort Size and Cohort Specific Wage Effects, College Graduate White Collar 1991‐2010
-.06
Cohort Size
20
40
-.04
60
80
100
120
Wage Premium Rank Unad -.02 0 .02
Graduates of Science and Engineering Major
1990
1995
2000
2005
Cohort Wage Premium Rank Unadjusted
2010 Cohort Size
Red Line – Cohort Size, Blue Line – Cohort Specific Wage Effect without Controlling for Job Ranks
-.03
Cohort Size
20
40
-.02
60
80
100
120
Wage Premium Rank Adjus -.01 0 .01
Graduates of Social Science and Humanities Major
1990
1995
2000
2005
Cohort Wage Premium Rank Adjusted
2010
Cohort Size
Red Line – Cohort Size, Blue Line – Cohort Specific Wage Effect Controlling for Job Ranks Note: Cohort specific wage effect is the estimated coefficients for cohort dummy 38
variables in the regression of log of monthly wage on female dummy, tenure, tenure squared, year and cohort dummy variables.
39
Figure 3: Cohort Size and Cohort Specific Wage Effects, College Graduate White Collar 1991‐2010 Graduates of Social Science and Humanities Major
Cohort Size
0
-.06
-.04
20
40
60
Wage Premium Rank Unad -.02 0 .02
1990
1995
2000
2005
Cohort Wage Premium Rank Unadjusted
2010 Cohort Size
Cohort Size
0
-.02
-.01
20
0
40
60
Wage Premium Rank Adjus .01 .02 .03
Red Line – Cohort Size, Blue Line – Cohort Specific Wage Effect without Controlling for Job Ranks
1990
1995
2000
2005
Cohort Wage Premium Rank Adjusted
2010
Cohort Size
Red Line – Cohort Size, Blue Line – Cohort Specific Wage Effect Controlling for Job Ranks 40
Note: Cohort specific wage effect is the estimated coefficients for cohort dummy variables in the regression of log of monthly wage on female dummy, tenure, tenure squared, year and cohort dummy variables.
41
Appendix Table 1: Effect of Cohort Size on Promotion, College Graduate White Collar 1991-2010, Parametric Regression Survival-Time Model with Weibull distribution, Coefficients Graduates of Science and Engineering Major 2nd Class
3rd Class
Cohort Size(10 persons)
0.056
(S.E) [exp(b)]
Supervisor
0.055
Vice Supervisor -0.016
(0.004) [1.057]
(0.007) [1.056]
(0.005) [0.985]
(0.007) [0.974]
Cohort Size lag1 (10 persons)
-0.047
-0.084
-0.029
0.002
(S.E) [exp(b)]
(0.004) [0.953]
(0.007) [0.919]
(0.005) [0.972]
(0.777) [1.00]
Female (S.E) [exp(b)]
0.150 (0.196) [1.161]
-0.254 (0.455) [0.775]
-13.484 (712.444) [>0]
-12.271 (1255.53) [>0]
ߙො Observations Log-likelihood
1.267 40344 -855.04
2.334 45037 -372.103
4.705 45755 -122.614
6.666 49262 -60.207
Source: Personnel records provided by MachineParts
42
-0.027
Graduates of Social Science and Humanities Major 2nd Class
3rd Class
Cohort Size(10 persons)
-0.046
(S.E) [exp(b)]
Supervisor
0.031
Vice Supervisor 0.010
(0.007) [0.955]
(0.006) [1.031]
(0.006) [1.010]
(0.011) [0.974]
Cohort Size lag1 (10 persons)
-0.024
-0.040
-0.032
0.011
(S.E) [exp(b)]
(0.006) [0.976]
(0.006) [0.960]
(0.005) [0.968]
(0.011) [1.00]
Female (S.E) [exp(b)]
0.661 (0.247) [1.161]
-0.702 (0.319) [0.496]
-1.355 (0.421) [0.258]
-17.207 (2118.063) [>0]
ߙො Observations Log-likelihood
1.372 18479 -285.968
2.417 19575 -202.112
5.119 20239 -52.797
7.561 23196 -23.752
Source: Personnel records provided by MachineParts
43
-0.003
Appendix Table 2: Effect of Cohort Size on Promotion, College Graduate White Collar 1991-2010, Parametric Regression Survival-Time Model with Weibull distribution, Schools Controlled. Natural Science and Engineering Major, School Controlled 2nd Class
3rd Class
Cohort Size(10 persons) (S.E) [exp(b)]
0.056 (0.004) [1.057]
Cohort Size lag1 (10 persons) (S.E) [exp(b)]
0.055 (0.007) [1.057]
Vice Supervisor -0.015 (0.006) [0.985]
Supervisor -0.024 (0.008) [0.974]
-0.046
-0.082
-0.028
0.003
(0.004) [0.955]
(0.007) [0.921]
(0.006) [0.973]
(0.008) [1.00]
Female (S.E) [exp(b)]
0.226 (0.246) [1.25]
-0.229 (0.456) [0.796]
-13.419 (713.9464) [>0]
-12.441 (1476.66) [>0]
1st Tier National
0.569 (0.226) [1.766]
0.996 (0.244) [2.071]
0.187 (0.353) [1.206]
1.045 (0.460) [2.842]
2nd Tier National
0.653 (0.192) [1.922]
1.025 (0.228) [2.788]
0.047 (0.342) [1.048]
0.835 (0.444) [2.305]
3rd Tier National
0.426 (0.128) [1.531]
0.179 (0.175) [1.196]
0.191 (0.198) [1.211]
0.144 (0.260) [1.155]
1st Tier Private
0.371 (0.242) [1.448]
0.551 (0.298) [1.196]
0.453 (0.373) [1.573]
0.939 (0.560) [2.558]
2nd Tier Private
0.324 (0.186) [1.384]
0.461 (0.244) [1.736]
0.133 (0.326) [1.143]
0.361 (0.431) [1.435]
1.282 40344
2.422 45037
4.719 45755
6.952 49262
3rd Tier Private
ߙො Observations
44
Log-likelihood
-846.076
-357.104
Source: Personnel records provided by MachineParts
45
-121.671
-56.220
Social Science and Humanities Major, School Controlled 2nd Class
3rd Class
Cohort Size(10 persons) (S.E) [exp(b)]
-0.047 (0.007) [0.953]
Cohort Size lag1 (10 persons) (S.E) [exp(b)]
0.029 (0.006) [1.029]
Vice Supervisor 0.005 (0.006) [1.005]
Supervisor -0.002 (0.011) [0.974]
-0.025
-0.037
-0.029
0.012
(0.006) [0.975]
(0.006) [0.964]
(0.005) [0.971]
(0.012) [1.00]
Female (S.E) [exp(b)]
0.754 (0.260) [2.12]
-0.620 (0.323) [0.538]
-1.194 (0.429) [0.303]
-17.636 (2676.986) [>0]
1st Tier National
0.539 (0.735) [1.713]
0.369 (0.617) [1.446]
0.763 (0.635) [2.144]
-17.636 (9941.372) [>0]
2nd Tier National
-0.599 (0.746) [0.549]
1.407 (0.536) [4.084]
0.488 (0.738) [1.629]
-15.551 (8242.372) [>0]
3rd Tier National
0.027 (0.275) [1.027]
0.277 (0.276) [1.319]
0.539 (0.265) [1.714]
0.451 (0.457) [1.570]
1st Tier Private
-0.366 (0.363) [0.694]
0.396 (0.289) [1.486]
0.581 (0.327) [1.789]
0.382 (0.516) [1.453]
2nd Tier Private
0.136 (0.209) [1.146]
-0.210 (0.230) [0.811]
0.241 (0.223) [1.273]
-0.380 (0.318) [0.962]
1.382 18479 -284.310
2.457 19575 -197.169
5.190 20239 -49.755
7.561 23196 -23.752
3rd Tier Private
ߙො Observations Log-likelihood
Source: Personnel records provided by MachineParts
46