The Post-Crisis Relationship between Asia-Pacific Currencies and its Implications on the Common Asian Currency
Jeden O. Tolentino De La Salle University
Asia-Pacific Currencies
2
Abstract
This study explored the relationship between Asia-Pacific currencies in the decade that followed the Asian financial crisis of 1997. Applying the Johansen methodology on daily exchange rate data on ten Asia-Pacific currencies (Indonesian rupiah, Malaysian ringgit, Philippine peso, Singapore dollar, Thai baht, Chinese yuan, Japanese yen, South Korean won, Australian dollar, and New Zealand dollar) against the U.S. dollar from the end of the crisis to the present (1999 to 2008), it was found that the currencies are cointegrated. Thereafter, using pairwise Granger Causality tests, the direction and strength of the relationships among the currencies were analyzed and modeled. Finally, the implications of the findings on the proposed common Asian Currency as part of Asia-Pacific financial integration were discussed.
Asia-Pacific Currencies
3
The Post-Crisis Relationship between Asia-Pacific Currencies and its Implications on the Common Asian Currency
Since the Asian financial crisis of 1997, the monetary authorities of East Asian countries have become responsible for regional monetary coordination to prevent currency crises from arising and to manage currency crises when they do arise. The Association of Southeast Asian Nations (ASEAN) and three Northeast Asian countries, China, Japan, and South Korea – collectively known as ASEAN+3 – have been strengthening currency swap arrangements under the Chiang Mai Initiative (Ogawa and Kawasaki, 2007). Beyond this, however, ASEAN+3 are taking steps for coordinated exchange rate policies. There are plans to advance regional monetary coordination in East Asia, and eventually introduce a common Asian Currency in the future. Meanwhile, the Kuala Lumpur Declaration on the East Asia Summit has acknowledged that in a rapidly changing international environment, the economies of ASEAN+3, Australia, New Zealand, and India have become increasingly interlinked and interdependent (ASEAN Secretariat, 2005). As such, any discussion of a common Asian Currency should involve not only East Asia, but the greater Asia-Pacific region. The objective of this study is to establish, describe, and analyze the relationship between Asia-Pacific currencies with the vision of a common Asian Currency as the impetus. This study is organized as follows: first, previous works on Asia-Pacific currency cointegration will be reviewed; next, the data and methodology to be used will be described; then, the results of cointegration analysis will be presented; and finally, the implications of the results on the common Asian Currency will be discussed.
Asia-Pacific Currencies
4
Previous Works on Asia-Pacific Currency Cointegration
Several studies have been conducted to establish the relationship between the currencies of Asia-Pacific countries. The periods analyzed by these studies include the 1980s, the years before the Asian financial crisis, and the years during the Asian financial crisis. Not many studies, however, have been conducted that focus on the years after the crisis. The combinations of currencies analyzed by these studies, meanwhile, have not been common. The choice of currencies has largely depended on the particular study’s research problem.
Aggarwal and Mougoué (1993) assessed financial integration in Asia examining the cointegration in a set of five Asian currencies (the Japanese yen, the Hong Kong dollar, the Malaysian ringgit, the Philippine peso, and the Singapore dollar) for the last eight years of the 1980s. They found that the five currencies were cointegrated. This was confirmed in Aggarwal and Mougoué (1996), where the cointegration between the Japanese yen and two sets of Asian currencies – the “Tigers” (Hong Kong, South Korea, Singapore, and Taiwan) and the ASEANs (Malaysia, the Philippines, Thailand, and Singapore) – was established. This evidence of cointegration between the yen and other Asian currencies has important implications for understanding Asian financial integration. Chaudhry, Chatrath, and Kamath (1996), meanwhile, examined the comovement in the Japanese yen, the Australian dollar, the Singapore dollar, the Malaysian ringgit, and the New Zealand Dollar exchange rates during the late 1980s by
Asia-Pacific Currencies
5
employing cointegration tests. They also performed vector autoregressive (VAR) tests to determine the pairwise channels of influence among these series. The results from the VAR formulation fitted to the overall 1985 to 1989 interval suggested that the Japanese yen, the Australian dollar, and the Singapore Dollar influence the behavior of the other currencies. On the other hand, while the results from the cointegration tests provided evidence of integration of these currencies during the “target-zone” Louvre Accord interval (February 1987 to December 1989), they did not support integration for “managed-float” Plaza Accord interval (January 1985 to February 1987). Tse and Ng (1997) examined the cointegration of the currencies of seven Asian countries (Japan, Malaysia, the Philippines, Singapore, Thailand, South Korea, and Taiwan) and found that there is cointegration among the currencies. However, when the South Korean won and the new Taiwan dollar were excluded from the system, there was no cointegration detected. Fauzias, Azuddin, and Zaidi (2000) investigated the relationship between the main ASEAN currencies (the Thai baht, the Malaysian ringgit, the Singapore dollar, the Indonesian rupiah, and the Philippine Peso) by applying a cointegration test to determine the long run dynamics between the currencies. They also performed a causality test to determine the influence of each currency on the other currencies. They found that that there is strong evidence of cointegration for the periods before and during the Asian financial crisis. Their Granger Causality tests showed, meanwhile, that the Malaysian ringgit had the most significant causalities on the ASEAN currencies during the crisis.
Asia-Pacific Currencies
6
Kearney and Muckley (2002) used bilateral Japanese yen exchange rates (with the Australian dollar, the Chinese yuan, the Hong Kong dollar, the Indonesian rupiah, the South Korean won, the Malaysian ringgit, the New Zealand dollar, the Philippine peso, the Singaporean dollar, the Taiwan dollar, and the Thai baht) to examine the evidence of an emerging yen bloc in Australasia, North Asia, and Southeast Asia. They found strong evidence contrary to the notion of a yen bloc. Alba and Park (2004) examined Granger causality among the exchange rates of eight East Asian economies (Korea, Taiwan, Hong Kong, Singapore, Indonesia, Philippines, Thailand, and Malaysia) prior to the Asian financial crisis. They adopted Engle and Gau’s “official band” model, and used daily bilateral U.S. dollar exchange rate data during the period of January 1991 to July 1997. They found some empirical support for the presence of systematic relationships that are consistent with the contagious nature of the Asian financial crisis. Azali and Chin (2007) assessed financial integration in ASEAN+3 by examining the time-series stochastic behavior and cointegration in a set of eight ASEAN+3 currencies (the Indonesian rupiah, the Malaysian ringgit, the Philippine peso, the Singapore dollar, the Thai baht, the Chinese yuan, the Japanese yen, and the South Korean Won) in the pre-crisis, crisis, and post-crisis periods. The results of their cointegration analysis showed that the currencies are not cointegrated during the precrisis period, but cointegrated in the crisis and post-crisis periods.
Asia-Pacific Currencies
7
Data and Methodology
This study used daily exchange rate data of the currencies of ten Asia-Pacific countries (Indonesian rupiah, Malaysian ringgit, Philippine peso, Singapore dollar, Thai baht, Chinese yuan, Japanese yen, South Korean won, Australian dollar, and New Zealand dollar) against the U.S. dollar. The countries were chosen on the basis of their participation in ASEAN, ASEAN+3, and the East Asia Summit. The period covered by the study is from 1 January 1999 (after the Asian financial crisis ended) to 30 June 2008 (present day). The source of the data is the historical currency exchange rates from OANDA Corporation (http://www.oanda.com). The relationship between the ten Asia-Pacific currencies was established, described, and analyzed using various cointegration techniques. This involved first determining the order of integration of the time series exchange rate data to ensure stationarity. For this, the Augmented Dickey-Fuller test for unit root was used. Next, testing was performed to determine whether the exchange rates are cointegrated, both as pairs of currencies and as a system of ten currencies. For this, the Johansen test for cointegration was used. Once it was been established that there are cointegrating relationships between the exchange rates, testing was performed to determine causation between the exchange rates of the currencies included in the study. For this, pairwise Granger Causality tests were used.
Asia-Pacific Currencies
8
Results and Discussion
The results of this study are presented as follows: (1) descriptive statistics; (2) tests for stationarity; (3) tests for cointegration; and (4) tests for causation.
Descriptive Statistics
Presented here are the summary statistics of each of the ten exchange rate time series. Presented in Appendix A, meanwhile, are the time series plots.
Indonesian Rupiah
The rupiah is the official currency of the Republic of Indonesia. Issued and controlled by Bank Indonesia, the ISO 4217 code for the Indonesian rupiah is IDR.
Table 1 Summary Statistics for IDR-USD Exchange Rate, 1 January 1999 – 30 June 2008 Mean
9,068.0000
Maximum
Median
9,107.0000
Standard deviation
Minimum
6,650.0000
Coefficient of variation
12,069.0000 834.7400 0.0920
Asia-Pacific Currencies
9
Malaysian Ringgit
The ringgit is the official currency of the Federation of Malaysia. Issued and controlled by Bank Negara Malaysia, the ISO 4217 code for the Malaysian ringgit is MYR.
Table 2 Summary Statistics for MYR-USD Exchange Rate, 1 January 1999 to 30 June 2008 Mean
3.7193
Maximum
3.9180
Median
3.8001
Standard deviation
0.1631
Minimum
3.1342
Coefficient of variation
0.0439
Philippine Peso
The peso is the official currency of the Philippines. Issued and controlled by the Bangko Sentral ng Pilipinas, the ISO 4217 code for the Philippine peso is PHP.
Table 3 Summary Statistics for PHP-USD Exchange Rate, 1 January 1999 to 30 June 2008 Mean
49.5480
Maximum
56.6200
Median
51.2550
Standard deviation
5.7049
Minimum
37.5800
Coefficient of variation
0.1151
Asia-Pacific Currencies
10
Singapore Dollar
The dollar is the official currency of the Republic of Singapore. Issued and controlled by the Monetary Authority of Singapore, the ISO 4217 code for the Singapore dollar is SGD.
Table 4 Summary Statistics for SGD-USD Exchange Rate, 1 January 1999 to 30 June 2008 Mean
1.6729
Maximum
1.8550
Median
1.6996
Standard deviation
0.1117
Minimum
1.3500
Coefficient of variation
0.0668
Thai Baht
The baht is the official currency of the Kingdom of Thailand. Issued and controlled by the Bank of Thailand, the ISO 4217 code for the Thai baht is THB.
Table 5 Summary Statistics for THB-USD Exchange Rate, 1 January 1999 to 30 June 2008 Mean
39.4070
Maximum
45.8300
Median
39.7080
Standard deviation
3.8683
Minimum
29.6720
Coefficient of variation
0.0982
Asia-Pacific Currencies
11
Chinese Yuan
The yuan is the official currency of the People’s Republic of China. Issued and controlled by the People’s Bank of China, the ISO 4217 code for the Chinese yuan is CNY.
Table 6 Summary Statistics for CNY-USD Exchange Rate, 1 January 1999 to 30 June 2008 Mean
8.1093
Maximum
8.3169
Median
8.2788
Standard deviation
0.3280
Minimum
6.8718
Coefficient of variation
0.0405
Japanese Yen
The yen is the official currency of Japan. Issued and controlled by the Bank of Japan, the ISO 4217 code for the Japanese yen is JPY.
Table 7 Summary Statistics for JPY-USD Exchange Rate, 1 January 1999 to 30 June 2008 Mean
114.6700
Maximum
Median
115.5500
Standard deviation
7.2451
Coefficient of variation
0.0632
Minimum
97.3000
134.8100
Asia-Pacific Currencies
12
South Korean Won
The won is the official currency of the Republic of Korea. Issued and controlled by the Bank of Korea, the ISO 4217 code for the South Korean won is KRW.
Table 8 Summary Statistics for KRW-USD Exchange Rate, 1 January 1999 to 30 June 2008 Mean
1119.5000
Maximum
Median
1150.5000
Standard deviation
Minimum
899.6900
Coefficient of variation
1369.0000 121.5000 0.1085
Australian Dollar
The dollar is the official currency of the Commonwealth of Australia. Issued and controlled by the Reserve Bank of Australia, the ISO 4217 code for the Australian dollar is AUD.
Table 9 Summary Statistics for AUD-USD Exchange Rate, 1 January 1999 to 30 June 2008 Mean
1.5086
Maximum
2.0946
Median
1.4728
Standard deviation
0.2646
Minimum
1.0394
Coefficient of variation
0.1754
Asia-Pacific Currencies
13
New Zealand Dollar
The dollar is the official currency of New Zealand. Issued and controlled by the Reserve Bank of New Zealand, the ISO 4217 code for the New Zealand dollar is NZD.
Table 10 Summary Statistics for NZD-USD Exchange Rate, 1 January 1999 to 30 June 2008 Mean
1.7719
Maximum
2.5467
Median
1.6818
Standard deviation
0.3756
Minimum
1.2246
Coefficient of variation
0.2120
Asia-Pacific Currencies
14
Tests for Stationarity
The order of integration of each of the ten time series was determined using the Augmented Dickey-Fuller (ADF) test for unit root. The results of this test are presented in Table 11 (for ASEAN-5 currencies) and Table 12 (for other Asia-Pacific currencies).
Table 11 Results of Augmented Dickey-Fuller Test for Unit Root, ASEAN-5 Currencies Test with Constant
Test with Constant and Trend
Currency Level
First Difference
Level
First Difference
Indonesian
-3.1290; 30 lags
-9.6592; 30 lags
-3.3460; 30 lags
-9.6566; 30 lags
Rupiah
[0.0245] *
[4.067x10 ] ***
[0.0590]
[1.96x10 ] ***
Malaysian
1.5344; 29 lags
-11.6101; 28 lags
-0.2166; 29 lags
-11.8752; 28 lags
Ringgit
[0.9994]
[1.955x10 ] ***
[0.9927]
[7.604x10 ] ***
-1.8545; 27 lags
-10.4310; 26 lags
-1.1183; 27 lags
-10.7528; 26 lags
[0.3543]
[1.356x10 ] ***
[0.9247]
[6.553x10 ] ***
1.1903; 30 lags
-10.7424; 30 lags
-0.9556; 30 lags
-11.0404; 30 lags
[0.9982]
[1.324x10 ] ***
[0.9482]
[3.836x10 ] ***
-0.9393; 27 lags
-10.0377; 26 lags
-2.1261; 27 lags
-10.1300; 26 lags
[0.7763]
[2.513x10 ] ***
[0.5306]
[2.539x10 ] ***
-18
-24
-18
-28
Philippine Peso -20
-23
Singapore Dollar -21
-24
Thai Baht
Note:
-19
Figures in brackets [ ] denote p-values * significant at
= .05; ** significant at
= .01; *** significant at
= .005
-20
Asia-Pacific Currencies
15
Table 12 Results of Augmented Dickey-Fuller Test for Unit Root, Other Asia-Pacific Currencies Test with Constant
Test with Constant and Trend
Currency Level
First Difference
Level
First Difference
8.0631; 26 lags
-7.9350; 27 lags
5.7510; 26 lags
-9.6724; 27 lags
[1.0000]
[7.745x10 ] ***
[1.000]
[1.700x10 ] ***
-2.2107; 30 lags
-10.8605; 29 lags
-2.2724; 30 lags
-10.8659; 29 lags
[0.2025]
[5.462x10 ] ***
[0.4486]
[2.161x10 ] ***
South Korean
-1.0724; 28 lags
-10.9227; 27 lags
-1.8527; 28 lags
-10.9211; 27 lags
Won
[0.7289]
[3.427x10 ] ***
[0.6789]
[1.253x10 ] ***
0.0630; 27 lags
-10.7787; 30 lags
-1.8860; 27 lags
-10.9002; 30 lags
[0.9629]
[1.008x10 ] ***
[0.6618]
[1.540x10 ] ***
New Zealand
-0.4786; 27 lags
-10.7601; 26 lags
-2.2293; 27 lags
-10.7969; 26 lags
Dollar
[0.8930]
[1.159x10 ] ***
[0.4726]
[4.256x10 ] ***
Chinese Yuan -13
-18
Japanese Yen -22
-22
-23
-23
Australian Dollar
Note:
-21
-21
-23
-23
Figures in brackets [ ] denote p-values * significant at
= .05; ** significant at
= .01; *** significant at
= .005
The results indicate that each of the ten currencies are integrated of order 1, I(1). This means that the time series (log-transformed) have to be differenced once before they become stationary. Since the ten time series are all I(1), cointegration analysis can now be used to establish relationships between the exchange rates of the currencies of the ten Asia-Pacific countries.
Asia-Pacific Currencies
16
Tests for Cointegration
The equilibrium relationship between the ten exchange rates, both pairwise and as a system, is established using Johansen test for cointegration.
Pairwise Relationships between Exchange Rates
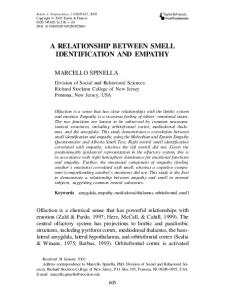
Figure 1. Number of cointegrating relationships.
The results of bivariate Johansen tests for cointegration (presented in Appendix B) revealed that during the period analyzed in this study, the Chinese yuan was cointegrated with all the other nine Asia-Pacific currencies. The Philippine peso had the second most cointegrating relationships with five.
Asia-Pacific Currencies
17
System Relationships between Exchange Rates
Table 13 Results of Multivariate Johansen Test for Cointegration (2 lags) p-value
p-value
Rank
Eigenvalue
0
0.055870
448.5900
0.0000 ***
199.3200
0.0000 ***
1
0.027570
249.2700
0.0000 ***
96.9280
0.0000 ***
2
0.011553
152.3400
0.1144
40.2890
0.4933
3
0.010304
112.0500
0.2493
35.9090
0.4192
4
0.007179
76.1400
0.5035
24.9780
0.7699
5
0.004941
51.1620
0.5887
17.1730
0.9051
6
0.004245
33.9890
0.5072
14.7490
0.7667
7
0.003005
19.2390
0.4867
10.4340
0.7085
8
0.001587
8.8054
0.3907
5.5081
0.6803
9
0.000951
3.2974
0.0694
3.2974
0.0694
Note:
* significant at
trace
= .05; ** significant at
max
= .01; *** significant at
= .005
The results of the multivariate Johansen test for cointegration reveal that, apart from several pairwise relationships, there is also a long-run equilibrium relationship among them when taken as a whole system. The trace ( (
max)
trace)
and maximum eigenvalue
test statistics reveal that there are two cointegrating vectors in the system.
Asia-Pacific Currencies
18
Tests for Causality
After determining the presence of cointegrating vectors, pairwise Granger Causality tests were used to identify the direction of causality among the exchange rates of the ten Asia-Pacific currencies. The causal relationships are presented graphically here, and statistically in Appendix C.
Indonesian Rupiah
Figure 2. Causal relationships of Indonesian rupiah with Asia-Pacific currencies.
PHP
KRW
JPY
IDR
NZD
There is a strong (significant at
AUD
= .01) unidirectional causal relationship running
from the Indonesian rupiah to the Japanese yen and the Australian dollar, and a moderate (significant at
= .05) unidirectional causal relationship running from the
Indonesian rupiah to the Philippine peso and the New Zealand dollar. Meanwhile, there
Asia-Pacific Currencies is a weak (significant at
19
= .10) bidirectional causal relationship between the
Indonesian rupiah and the Korean won.
Malaysian Ringgit
Figure 3. Causal relationships of Malaysian ringgit with Asia-Pacific currencies.
PHP
SGD
THB
MYR
AUD
KRW
CNY
There is a strong unidirectional causal relationship running to the Malaysian ringgit from the Philippine peso and the Thai Baht, and a weak unidirectional causal relationship running to the Malaysian ringgit from the Australian dollar. Meanwhile, there is a bidirectional causal relationship between the Malaysian ringgit and the Singapore dollar, the Chinese yuan, and the Korean Won. All three currencies strongly Grangercause the Malaysian ringgit, but the Malaysian ringgit only weakly Granger-causes the Singapore dollar and the Korean won, and only moderately Granger-causes the Chinese yuan.
Asia-Pacific Currencies
20
Philippine Peso
Figure 4. Causal relationships of Philippine peso with Asia-Pacific currencies.
SGD
IDR
MYR
PHP
CNY
AUD
KRW
THB JPY NZD
There is a strong unidirectional causal relationship running to the Philippine peso from the Singapore dollar, the Thai baht, the Japanese Yen, and the New Zealand dollar, and a moderate unidirectional causal relationship running to the Philippine peso from the Indonesian rupiah and the Australian dollar. Meanwhile, there is a strong unidirectional causal relationship running from the Philippine peso to the Malaysian ringgit and the South Korean won, and a weak unidirectional causal relationship running from the Philippine peso to the Chinese yuan.
Asia-Pacific Currencies
21
Singapore Dollar
Figure 5. Causal relationships of Singapore dollar with Asia-Pacific currencies.
AUD
NZD
MYR
PHP
SGD
THB
CNY
KRW
There is a strong unidirectional causal relationship running to the Singapore dollar from the Australian dollar and the New Zealand dollar. Meanwhile, there is a strong unidirectional causal relationship running from the Singapore dollar to the Philippine peso, the Thai Baht, and the South Korean won. There is also a bidirectional causal relationship between the Singapore dollar and the Malaysian ringgit and the Chinese yuan. The Singapore dollar has a strong causal effect on both currencies, but the Malaysian ringgit only weakly Granger-causes the Singapore dollar, and the Chinese yuan only moderately Granger-causes the Singapore dollar.
Asia-Pacific Currencies
22
Thai Baht
Figure 6. Causal relationships of Thai baht with Asia-Pacific currencies.
SGD
KRW
MYR
JPY
THB
PHP
AUD
NZD
CNY
There is a strong unidirectional causal relationship running to the Thai baht from the Singapore dollar and the Australian dollar. Meanwhile, there is a strong unidirectional causal relationship running from the Thai baht to the Malaysian ringgit, the Philippine peso, and the Chinese yuan. There is also a moderate bidirectional causal relationship between the Thai baht and the Japanese yen. Bidirectional causal relationships also exist between the Thai baht and the Korean won and the New Zealand dollar. The Thai baht strongly Granger-causes the Korean won and moderately Granger-causes the New Zealand dollar. The Korean won weakly Granger-causes the Thai baht, while the New Zealand dollar strongly Granger-causes the Thai baht.
Asia-Pacific Currencies
23
Chinese Yuan
Figure 7. Causal relationships of Chinese yuan with Asia-Pacific currencies.
PHP
MYR
KRW
THB
CNY
AUD
JPY
SGD
NZD
There is a strong unidirectional causal relationship running to the Chinese yuan from the Thai Baht, the Japanese yen, the Australian dollar, and the New Zealand dollar, a moderate unidirectional causal relationship running to the Chinese yuan from the South Korean won, and a weak unidirectional causal relationship running to the Chinese yuan from the Philippine peso. There is also a bidirectional causal relationship between the Chinese yuan and the Malaysian ringgit and the Singapore dollar. The Chinese yuan strongly Granger-causes the Malaysian Ringgit, but only moderately Granger-causes the Singapore dollar. The Singapore dollar strongly Granger-causes the Chinese yuan, while the Malaysian Ringgit moderately Granger-causes the Chinese yuan.
Asia-Pacific Currencies
24
Japanese Yen
Figure 8. Causal relationships of Japanese yen with Asia-Pacific currencies.
THB
PHP CNY
IDR
JPY KRW AUD
NZD
There is a strong unidirectional causal relationship running to the Japanese yen from the Indonesian rupiah. Meanwhile, there is a strong unidirectional causal relationship running from the Japanese yen to the Chinese yuan and the South Korean won, and a moderate unidirectional causal relationship running from the Japanese yen to the Philippine peso and the New Zealand dollar. There is also a moderate bidirectional causal relationship between the Japanese yen and the Thai baht. A bidirectional causal relationship also exists between the Japanese yen and the Australian dollar. The Japanese yen strongly Granger-causes the Australian dollar, while the Australian dollar only weakly Granger-causes the Japanese yen.
Asia-Pacific Currencies
25
South Korean Won
Figure 9. Causal relationships of South Korean won with Asia-Pacific currencies.
PHP
MYR
JPY
KRW
IDR
THB
CNY
SGD AUD NZD
There is a strong unidirectional causal relationship running to the South Korean won from the Philippine peso, the Singapore dollar, the Japanese yen, the Australian dollar, and the New Zealand dollar. Meanwhile, there is a moderate unidirectional causal relationship running from the South Korean won to the Chinese yuan. There is also a weak bidirectional causal relationship between the South Korean won and the Indonesian rupiah. Bidirectional causal relationships also exist between the South Korean won and Malaysian ringgit and the Thai baht. The South Korean won strongly Granger-causes the Malaysian ringgit and weakly Granger-causes the Thai baht. The Malaysian ringgit weakly Granger-causes the South Korean won, while the Thai baht strongly Granger-causes the South Korean won.
Asia-Pacific Currencies
26
Australian Dollar
Figure 10. Causal relationships of Australian dollar with Asia-Pacific currencies.
IDR
JPY
SGD THB
NZD
AUD CNY
MYR
PHP
KRW
There is a strong unidirectional causal relationship running to the Australian dollar from the Indonesian ringgit, and a weak unidirectional causal relationship running to the Australian dollar from the New Zealand dollar. Meanwhile, there is a strong unidirectional causal relationship running from the Australian dollar to the Singapore dollar, the Thai baht, the Chinese yuan, and the South Korean won, a moderate unidirectional causal relationship running from the Australian dollar to the Philippine peso, and a weak unidirectional causal relationship running from the Australian dollar to the Malaysian ringgit. There is also a bidirectional causal relationship between the Australian Dollar and the Japanese yen. The Australian dollar weakly Granger-causes the Japanese yen, while the Japanese yen strongly Granger-causes the Australian Dollar.
Asia-Pacific Currencies
27
New Zealand Dollar
Figure 11. Causal relationships of New Zealand dollar with Asia-Pacific currencies.
IDR
CNY
PHP SGD
NZD THB JPY
AUD
KRW
There is a moderate unidirectional causal relationship running to the New Zealand dollar from the Indonesian ringgit and the Japanese yen. Meanwhile, there is a strong unidirectional causal relationship running from the New Zealand dollar to the Philippine peso, the Singapore dollar, the Thai baht, and the South Korean won, a moderate unidirectional causal relationship running from the New Zealand dollar to the Chinese yuan, and a weak unidirectional causal relationship running from the New Zealand dollar to the Australian dollar.
Asia-Pacific Currencies
28
Implications on the Asian Currency Unit
Chow, Kriz, Mariano, and Tan (2007) posed four questions that must be addressed regarding the structure of a regional monetary unit based on a currency basket.
1. Which national currencies are to be included? 2. For those countries that are to be included, what weight are they to be accorded and how are these weights to be determined? 3. What will be the protocol for revising the basket structure, either in terms of currencies, weights, or weighting schemes? 4. How will national currencies be defined vis-à-vis the currency basket and what structure will be accorded to these relationships?
The results presented by this study may contribute to the resolution of the first two questions.
Which national currencies are to be included?
Not all of the currencies of the 16 members of the East Asia Summit may enter the currency basket, at least in the beginning. The differences in monetary policies might be too big to completely reconcile. This study specifically limited the number currencies to ten: the Indonesian rupiah, the Malaysian ringgit, the Philippine peso, the
Asia-Pacific Currencies
29
Singapore dollar, the Thai baht, the Chinese yuan, the Japanese yen, the South Korean won, the Australian dollar, and the New Zealand dollar. Based on the results of the cointegration analysis, there exists a long-run equilibrium relationship among them. They can, therefore, make up the initial currency basket for the regional monetary unit that will serve as the basis of the Asian Currency. Ultimately, the currencies of the other five ASEAN members (Brunei Darussalam, Cambodia, Laos, Myanmar, and Vietnam) will have to be included, but maybe only when the common Asian Currency Unit has been introduced. The question now is whether to include India, if at all. Is India needed to balance the rapid emergence of China? Or are Japan, Australia, and New Zealand enough to ensure this?
For those countries that are to be included, what weight are they to be accorded and how are these weights to be determined?
Chow et al. (2007) proposed three alternative weighting schemes for the regional monetary unit: (1) weights based on GDP; (2) weights based on trade shares; and (3) weights based on financial openness index. Aside from these three, the influence of a particular currency on the other currencies in the system (in this case, the currency basket) also needs to be considered. This study presented the causal relationships between ten Asia-Pacific currencies. However, these relationships evolve through time, and what might be an influential currency now, might not be an influential currency by the time the Asian Currency is introduced.
Asia-Pacific Currencies
30
Conclusion
As the economies of the countries in the Asia-Pacific become more and more interdependent after the Asian financial crisis, there is strengthening motivation towards a common Asian currency. While the establishment of a “euro” for the Asia-Pacific region is still a long ways off, this study established, described, and analyzed the relationship between Asia-Pacific currencies and discussed the implications of this on the common Asian Currency. This study also sought to answer several questions that need to be addressed regarding the structure of a regional monetary unit that will serve as the basis of the common Asian currency. However, the work is by no means complete.
Asia-Pacific Currencies
31
References
Aggarwal, R., & Mougoué, M. (1993). Cointegration among Southeast Asian and Japanese currencies Preliminary evidence of a Yen bloc? Economics Letters, 41(2), 161-166. Abstract retrieved July 15, 2008, from ScienceDirect. Aggarwal, R., & Mougoué, M. (1996). Cointegration among Asian currencies: Evidence of the increasing influence of the Japanese yen. Japan and the World Economy, 8(3), 291-308. Abstract retrieved July 15, 2008, from ScienceDirect. Alba, J. D., & Park, D. H. (2004). Granger causality among pre-crisis East Asian exchange rates. Retrieved July 15, 2008, from http://repec.org/esFEAM04/up.18551.1080711410.pdf Association of Southeast Asian Nations [ASEAN] Secretariat. (2005). Kuala Lumpur Declaration on the East Asia Summit. Retrieved July 15, 2008, from http://www.aseansec.org/18098.htm Azali, M., & Chin, L. (2007, August). Cointegration among ASEAN+3 currencies. Paper presented at the Singapore Economic Review Conference 2007, Singapore. Chaudhry, M., Chatrath, A., & Kamath, R. (1996). The cointegration experience of eastern currencies: Evidence from the 1980s. Finance India, 10(1), 49-59. Chow, H. K., Kriz, P. N., Mariano, R. S., & Tan, A. H. H. (2007). Toward greater financial stability in the Asian region: Exploring steps to create regional monetary units. Retrieved July 15, 2008, from http://www.aseansec.org/20730.pdf
Asia-Pacific Currencies
32
Fauzias, M. N., Azuddin, Y., & Zaidi, I. (2000). Cointegration test on ASEAN currencies before and during the currency turmoil. Retrieved July 15, 2008, from http://pkukmweb.ukm.my/~fep/pdf/Fauzias-Azuddin-Zaidi.pdf Kearney, C., & Muckley, C. (2002). Is Australasia, North and Southeast Asia becoming a yen block? Retrieved July 15, 2008, from http://ssrn.com/bstrct=364680 Ogawa, E., & Kawasaki, K. (2007). East Asian currency cooperation. Retrieved July 15, 2008, from http://aric.adb.org/pdf/seminarseries/SS10paper_East_Asian_Currency.pdf Tse, Y. K., & Ng, L. K. (1997). The cointegration of Asian currencies revisited. Japan and the World Economy, 9(1), 109-114. Abstract retrieved July 15, 2008, from ScienceDirect.
Asia-Pacific Currencies Appendix A Time Series Plots of Exchange Rates, 1 January 1998 – 30 June 2008
Indonesian Rupiah-U.S. Dollar
33
Asia-Pacific Currencies Malaysian Ringgit-U.S. Dollar
34
Asia-Pacific Currencies Philippine Peso-U.S. Dollar
35
Asia-Pacific Currencies Singapore Dollar-U.S. Dollar
36
Asia-Pacific Currencies Thai Baht-U.S. Dollar
37
Asia-Pacific Currencies Chinese Yuan-U.S. Dollar
38
Asia-Pacific Currencies Japanese Yen-U.S. Dollar
39
Asia-Pacific Currencies South Korean Won-U.S. Dollar
40
Asia-Pacific Currencies Australian Dollar-U.S. Dollar
41
Asia-Pacific Currencies New Zealand Dollar-U.S. Dollar
42
Asia-Pacific Currencies
43
Appendix B Results of Bivariate Johansen Tests for Cointegration
Indonesian Rupiah and Malaysian Ringgit
Note:
Rank
Eigenvalue
0
0.001972
8.6934
0.4016
6.8350
0.5171
1
0.000537
1.8584
0.1728
1.8584
0.1728
trace
p-value
max
p-value
This test was run using seven lags determined by using Schwartz Bayesian information criterion.
Indonesian Rupiah and Philippine Peso
Note:
Rank
Eigenvalue
0
0.002718
12.485
0.1359
9.4358
0.2573
1
0.000879
3.0492
0.0808 *
3.0492
0.0808 *
trace
p-value
max
p-value
This test was run using two lags determined by using Schwartz Bayesian information criterion.
Indonesian Rupiah and Singapore Dollar
Note:
Rank
Eigenvalue
0
0.002517
10.4470
0.2523
8.7405
0.3156
1
0.000492
1.7063
0.1915
1.7063
0.1915
trace
p-value
max
p-value
This test was run using one lag determined by using Schwartz Bayesian information criterion.
Asia-Pacific Currencies Indonesian Rupiah and Thai Baht
Note:
Rank
Eigenvalue
0
0.002520
9.3352
0.3415
8.7501
0.3148
1
0.000169
0.5851
0.4443
0.5851
0.4443
trace
p-value
max
p-value
This test was run using one lag determined by using Schwartz Bayesian information criterion.
Indonesian Rupiah and Chinese Yuan
Note:
Rank
Eigenvalue
0
0.023315
90.0100
0.0000 ***
81.8160
0.0000 ***
1
0.002360
8.1939
0.0042 ***
8.1939
0.0042 ***
trace
p-value
max
p-value
This test was run using one lag determined by using Schwartz Bayesian information criterion.
Indonesian Rupiah and Japanese Yen
Note:
Rank
Eigenvalue
0
0.004683
24.9760
0.0011 ***
16.2780
0.0216 **
1
0.002505
8.6982
0.0032 ***
8.6982
0.0032 ***
trace
p-value
max
p-value
This test was run using one lag determined by using Schwartz Bayesian information criterion.
Indonesian Rupiah and South Korean Won
Note:
Rank
Eigenvalue
0
0.002455
9.8561
0.2974
8.5181
0.3361
1
0.000386
1.3380
0.2474
1.3380
0.2474
trace
p-value
max
p-value
This test was run using four lags determined by using Schwartz Bayesian information criterion.
44
Asia-Pacific Currencies
45
Indonesian Rupiah and Australian Dollar
Note:
Rank
Eigenvalue
0
0.002498
1
1.7876x10
-6
trace
p-value
max
p-value
8.6793
0.4029
8.6731
0.3217
0.0062
0.9372
0.0062
0.9373
This test was run using one lag determined by using Schwartz Bayesian information criterion.
Indonesian Rupiah and New Zealand Dollar
Note:
Rank
Eigenvalue
0
0.002494
1
5.1271x10
-5
trace
p-value
max
p-value
8.8372
0.3876
8.6594
0.3230
0.1778
0.6733
0.1778
0.6733
This test was run using one lag determined by using Schwartz Bayesian information criterion.
Malaysian Ringgit and Philippine Peso
Note:
Rank
Eigenvalue
0
0.002037
8.7640
0.3947
7.0589
0.4908
1
0.000492
1.7051
0.1916
1.7051
0.1916
trace
p-value
max
p-value
This test was run using seven lags determined by using Schwartz Bayesian information criterion.
Malaysian Ringgit and Singapore Dollar
Note:
Rank
Eigenvalue
0
0.002039
11.2120
0.2018
7.0655
0.4900
1
0.001197
4.1469
0.0417 **
4.1469
0.0417 **
trace
p-value
max
p-value
This test was run using seven lags determined by using Schwartz Bayesian information criterion.
Asia-Pacific Currencies
46
Malaysian Ringgit and Thai Baht
Note:
Rank
Eigenvalue
0
0.002405
1
4.9037x10
-5
trace
p-value
max
p-value
8.5063
0.4201
8.3366
0.3535
0.1698
0.6803
0.1698
0.6803
This test was run using seven lags determined by using Schwartz Bayesian information criterion.
Malaysian Ringgit and Chinese Yuan
Note:
Rank
Eigenvalue
0
0.027021
104.9200
0.0000 ***
94.8350
0.0000 ***
1
0.002909
10.0850
0.0015 ***
10.0850
0.0015 ***
trace
p-value
max
p-value
This test was run using seven lags determined by using Schwartz Bayesian information criterion.
Malaysian Ringgit and Japanese Yen
Note:
Rank
Eigenvalue
0
0.002298
8.8185
0.3894
7.9634
0.3909
1
0.000247
0.8551
0.3551
0.8551
0.3551
trace
p-value
max
p-value
This test was run using seven lags determined by using Schwartz Bayesian information criterion.
Malaysian Ringgit and South Korean Won
Note:
Rank
Eigenvalue
0
0.002988
14.7050
0.0642
10.36
0.1927
1
0.001254
4.3453
0.0371 **
4.3453
0.0371 **
trace
p-value
max
p-value
This test was run using seven lags determined by using Schwartz Bayesian information criterion.
Asia-Pacific Currencies
47
Malaysian Ringgit and Australian Dollar
Note:
Rank
Eigenvalue
0
0.000900
4.6173
0.8443
3.1182
0.9283
1
0.000433
1.4991
0.2208
1.4991
0.2208
trace
p-value
max
p-value
This test was run using seven lags determined by using Schwartz Bayesian information criterion.
Malaysian Ringgit and New Zealand Dollar
Note:
Rank
Eigenvalue
0
0.001045
1
2.9545x10
-5
trace
p-value
max
p-value
3.7203
0.9177
3.6180
0.8887
0.1023
0.7491
0.1023
0.7491
This test was run using seven lags determined by using Schwartz Bayesian information criterion.
Philippine Peso and Singapore Dollar
Note:
Rank
Eigenvalue
0
0.002246
1
9.3511x10
-5
trace
p-value
max
p-value
8.1188
0.4601
7.7946
0.4086
0.3242
0.5691
0.3242
0.5691
This test was run using two lags determined by using Schwartz Bayesian information criterion.
Philippine Peso and Thai Baht
Note:
Rank
Eigenvalue
0
0.003396
13.798
0.0880 *
11.795
0.1190
1
0.000578
2.0029
0.1570
2.0029
0.1570
trace
p-value
max
p-value
This test was run using two lags determined by using Schwartz Bayesian information criterion.
Asia-Pacific Currencies Philippine Peso and Chinese Yuan
Note:
Rank
Eigenvalue
0
0.023055
85.5020
0.0000 ***
80.8680
0.0000 ***
1
0.001336
4.6334
0.0314 **
4.6334
0.0314 **
trace
p-value
max
p-value
This test was run using two lags determined by using Schwartz Bayesian information criterion.
Philippine Peso and Japanese Yen
Note:
Rank
Eigenvalue
0
0.002322
11.7440
0.1716
8.0593
0.3811
1
0.001062
3.6849
0.0549 *
3.6849
0.0549 *
trace
p-value
max
p-value
This test was run using two lags determined by using Schwartz Bayesian information criterion.
Philippine Peso and South Korean Won
Note:
Rank
Eigenvalue
0
0.002461
10.9710
0.2168
8.5381
0.3342
1
0.000702
2.4326
0.1188
2.4326
0.1188
trace
p-value
max
p-value
This test was run using four lags determined by using Schwartz Bayesian information criterion.
Philippine Peso and Australian Dollar
Note:
Rank
Eigenvalue
0
0.002196
7.9870
0.4740
7.6231
0.4271
1
0.000105
0.3639
0.5464
0.3639
0.5464
trace
p-value
max
p-value
This test was run using two lags determined by using Schwartz Bayesian information criterion.
48
Asia-Pacific Currencies Philippine Peso and New Zealand Dollar
Note:
Rank
Eigenvalue
0
0.002361
11.4890
0.1856
8.1944
0.3675
1
0.000950
3.2948
0.0695 *
3.2948
0.0695 *
trace
p-value
max
p-value
This test was run using two lags determined by using Schwartz Bayesian information criterion.
Singapore Dollar and Thai Baht
Note:
Rank
Eigenvalue
0
0.001564
7.0595
0.5770
5.4294
0.6900
1
0.000470
1.6301
0.2017
1.6301
0.2017
trace
p-value
max
p-value
This test was run using one lag determined by using Schwartz Bayesian information criterion.
Singapore Dollar and Chinese Yuan
Note:
Rank
Eigenvalue
0
0.023034
85.8050
0.0000 ***
80.7940
0.0000 ***
1
0.001444
5.0111
0.0252 **
5.0111
0.0252 **
trace
p-value
max
p-value
This test was run using two lags determined by using Schwartz Bayesian information criterion.
Singapore Dollar and Japanese Yen
Note:
Rank
Eigenvalue
0
0.002253
8.8780
0.3837
7.8228
0.4057
1
0.000304
1.0552
0.3043
1.0552
0.3043
trace
p-value
max
p-value
This test was run using one lag determined by using Schwartz Bayesian information criterion.
49
Asia-Pacific Currencies Singapore Dollar and South Korean Won
Note:
Rank
Eigenvalue
0
0.002078
7.5726
0.5192
7.2059
0.4738
1
0.000106
0.3667
0.5448
0.3667
0.5448
trace
p-value
max
p-value
This test was run using four lags determined by using Schwartz Bayesian information criterion.
Singapore Dollar and Australian Dollar
Note:
Rank
Eigenvalue
0
0.002301
1
3.6908x10
-5
trace
p-value
max
p-value
8.1176
0.4602
7.9896
0.3882
0.1280
0.7205
0.1280
0.7205
This test was run using one lag determined by using Schwartz Bayesian information criterion.
Singapore Dollar and New Zealand Dollar
Note:
Rank
Eigenvalue
0
0.001820
6.9517
0.5893
6.3188
0.5797
1
0.000183
0.6330
0.4263
0.6330
0.4263
trace
p-value
max
p-value
This test was run using one lag determined by using Schwartz Bayesian information criterion.
Thai Baht and Chinese Yuan
Note:
Rank
Eigenvalue
0
0.023279
83.3590
0.0000 ***
81.6860
0.0000 ***
1
0.000482
1.6725
0.1959
1.6725
0.1959
trace
p-value
max
p-value
This test was run using one lag determined by using Schwartz Bayesian information criterion.
50
Asia-Pacific Currencies Thai Baht and Japanese Yen
Note:
Rank
Eigenvalue
0
0.002600
10.6740
0.2364
9.0267
0.2906
1
0.000475
1.6477
0.1993
1.6477
0.1993
trace
p-value
max
p-value
This test was run using one lag determined by using Schwartz Bayesian information criterion.
Thai Baht and South Korean Won
Note:
Rank
Eigenvalue
0
0.001949
7.8614
0.4876
6.7574
0.5264
1
0.000319
1.1039
0.2934
1.1039
0.2934
trace
p-value
max
p-value
This test was run using five lags determined by using Schwartz Bayesian information criterion.
Thai Baht and Australian Dollar
Note:
Rank
Eigenvalue
0
0.002316
1
1.5872x10
-5
trace
p-value
max
p-value
8.0968
0.4624
8.0417
0.3829
0.0550
0.8145
0.0550
0.8145
This test was run using one lag determined by using Schwartz Bayesian information criterion.
Thai Baht and New Zealand Dollar
Note:
Rank
Eigenvalue
0
0.002004
7.3436
0.5448
6.9569
0.5027
1
0.000112
0.3867
0.5340
0.3867
0.5340
trace
p-value
max
p-value
This test was run using one lag determined by using Schwartz Bayesian information criterion.
51
Asia-Pacific Currencies Chinese Yuan and Japanese Yen
Note:
Rank
Eigenvalue
0
0.023220
86.8620
0.0000 ***
81.4780
0.0000 ***
1
0.001551
5.3835
0.0203 **
5.3835
0.0203 **
trace
p-value
max
p-value
This test was run using one lag determined by using Schwartz Bayesian information criterion.
Chinese Yuan and South Korean Won
Note:
Rank
Eigenvalue
0
0.029178
1
1.3641x10
-5
trace
p-value
max
p-value
102.6500
0.0000 ***
102.6100
0.0000 ***
0.0473
0.8279
0.0473
0.8279
This test was run using four lags determined by using Schwartz Bayesian information criterion.
Chinese Yuan and Australian Dollar
Note:
Rank
Eigenvalue
0
0.023623
83.8470
0.0000 ***
82.9060
0.0000 ***
1
0.000271
0.9407
0.3321
0.9407
0.3321
trace
p-value
max
p-value
This test was run using one lag determined by using Schwartz Bayesian information criterion.
Chinese Yuan and New Zealand Dollar
Note:
Rank
Eigenvalue
0
0.023711
1
3.9497x10
-5
trace
p-value
max
p-value
83.359
0.0000 ***
83.222
0.0000 ***
0.13698
0.7113
0.13698
0.7113
This test was run using one lag determined by using Schwartz Bayesian information criterion.
52
Asia-Pacific Currencies Japanese Yen and South Korean Won
Note:
Rank
Eigenvalue
0
0.001791
7.6017
0.5160
6.2124
0.5929
1
0.000401
1.3893
0.2385
1.3893
0.2385
trace
p-value
max
p-value
This test was run using four lags determined by using Schwartz Bayesian information criterion.
Japanese Yen and Australian Dollar
Note:
Rank
Eigenvalue
0
0.003256
1
7.1251x10
-5
trace
p-value
max
p-value
11.5570
0.1818
11.3100
0.1407
0.2471
0.6191
0.2471
0.6191
This test was run using one lag determined by using Schwartz Bayesian information criterion.
Japanese Yen and New Zealand Dollar
Note:
Rank
Eigenvalue
0
0.003013
11.2930
0.1969
10.4650
0.1863
1
0.000239
0.8288
0.3626
0.8288
0.3626
trace
p-value
max
p-value
This test was run using one lag determined by using Schwartz Bayesian information criterion.
South Korean Won and Australian Dollar
Note:
Rank
Eigenvalue
0
0.001291
1
2.2213x10
-6
trace
p-value
max
p-value
4.4820
0.8567
4.4743
0.8028
0.0077
0.9301
0.0077
0.9301
This test was run using four lags determined by using Schwartz Bayesian information criterion.
53
Asia-Pacific Currencies South Korean Won and New Zealand Dollar
Note:
Rank
Eigenvalue
0
0.001785
1
9.9270x10
-5
trace
p-value
max
p-value
6.5357
0.6372
6.1917
0.5954
0.34399
0.5575
0.34399
0.5575
This test was run using four lags determined by using Schwartz Bayesian information criterion.
Australian Dollar and New Zealand Dollar
Note:
Rank
Eigenvalue
0
0.001772
7.3438
0.5447
6.1512
0.6004
1
0.000344
1.1926
0.2748
1.1926
0.2748
trace
p-value
max
p-value
This test was run using one lag determined by using Schwartz Bayesian information criterion.
54
Appendix C Results of Pairwise Granger Causality Tests
Dep.
Independent Variable
Var.
IDR
IDR
--
MYR
PHP
SGD
THB
CNY
JPY
KRW
AUD
NZD
0.1643
0.5149
1.1781
0.4544
0.0076
1.0546
2.7344
0.1244
0.0870
[0.8485]
[0.5976]
[0.3080]
[0.6349]
[0.9925]
[0.3485]
[0.0651]
[0.8830]
[0.9167]
6.0578
12.9098
6.8735
58.5102
0.0346
6.0311
2.9546
2.2411
[0.0024]***
[0.0000]***
[0.0010]***
[0.0000]***
[0.9660]
[0.0024]***
[0.0522]
[0.1065]
8.1961
11.0875
1.3060
3.7453
2.0027
3.5452
4.9093
[0.0003]***
[0.0000]***
[0.2710]
[0.0237]*
[0.1351]
[0.0290]*
[0.0074]**
0.3512
4.2553
2.0091
0.6011
9.7348
9.0243
[0.7039]
[0.0143]*
[0.1343]
[0.5483]
[0.0001]***
[0.0001]***
1.0941
4.3996
2.5020
7.5130
6.5880
[0.3350]
[0.0124]*
[0.0821]
[0.0006]***
[0.0014]***
6.9314
4.4563
6.9485
3.5568
[0.0010]***
[0.0117]*
[0.0010]***
[0.0286]*
0.3094
2.5678
1.9778
[0.7339]
[0.0769]
[0.1385]
8.5299
9.5910
[0.0002]***
[0.0001]***
0.6446
MYR
-[0.5249] 3.0205
PHP
1.2583 --
[0.0489]*
[0.2843]
1.8212
2.4827
SGD
0.6240 --
[0.1620]
[0.0837]
[0.5359]
0.7510
0.7563
1.4708
THB
7.7316 --
[0.4720]
[0.4695]
[0.2299]
[0.0004]***
1.2292
3.3879
2.5826
25.8406
CNY
8.6017 --
[0.2926]
[0.0339]*
[0.0757]
[0.0000]***
[0.0002]***
4.8214
0.7767
0.7437
1.4376
4.5061
JPY
1.4040 --
[0.0081]**
[0.4600]
[0.4754]
[0.2376]
[0.0111]*
[0.2458]
2.5677
2.3222
6.8877
26.1635
13.5308
0.5295
KRW
12.9563 --
[0.0769]
[0.0982]
[0.0010]***
[0.0000]***
[0.0000]***
[0.5889]
[0.0000]***
4.6553
0.7944
0.9502
0.0726
1.7441
0.9147
7.3766
AUD
0.3373
2.9431 --
[0.0096]**
[0.4519]
0.3867
[0.9299]
0.1750
[0.4007]
[0.0006]***
[0.7137]
3.0005
0.0309
2.1650
0.3469
3.6304
0.1305
3.2603
0.3677
0.8824
[0.0499]*
[0.9696]
[0.1149]
[0.7069]
[0.0266]*
[0.8777]
[0.0385]*
[0.6924]
[0.4139]
NZD
[0.0528]
--
Note:
* significant at
= .05; ** significant at
= .01; *** significant at
= .005