THE RELATIONSHIP BETWEEN SYNAESTHESIA AND CREATIVITY. Catherine M. Mulvenna1, Edward. M. Hubbard2, Vilayanur S. Ramachandran2, Frank E. Pollick.1 1DEPARTMENT 2DEPARTMENT
OF PSYCHOLOGY, UNIVERSITY OF GLASGOW,UK; OF PSYCHOLOGY, UNIVERSITY OF CALIFORNIA, SAN DIEGO, USA.
[email protected]
Synaesthesia has been a controversial topic of research both in the attempt to define what it is, and what the consequences are for the individual who experiences it.
Results:
hyper-connectivity between sensory centres of the brain (Ramachandran & Hubbard, 2001b).
scores of synaesthetes and nonsynaesthetes can be observed. •No significant difference (p=.993) between
These would be of significant interest if found to be indicative of the differing neuronal
the experimenter and two independent
organisation.
raters is indicative of high inter-rater reliability.
Rater 1 60
Rater 2
50 40
Materials: •Synaesthesia Questionnaire (SQ) (Jones, 1976) This defines synaesthesia and asks responders both direct and open-ended questions about
S
NS 85 28.8 6.48 4.11 78 24 91 34 100 0 0
100
0
Participants: 445 undergraduate students of Glasgow University (335 female, mean age 19 years), - from which 4 potential colour-grapheme synaesthetes and 4 individuals with no synaesthesia experiences were isolated who were matched on: 1) Age 2) gender 3)year 4) faculty 5) subject of lecture 6) time of lecture attended.
Methods: •Synaesthesia Questionnaires (Jones, 1976) were distributed and retrieved from undergraduates during lectures. •Respondents who reported experiences strongly and clearly indicative of synaesthesia, and matched controls who reported never having synaesthetic experiences took the Test of Genuineness. •Recorded the consistency of 100 colour associations of a randomised list of words numbers and letters across a ten-week period. Previous use of this test has shown synaesthetes score ~90% and non-synaesthetes ~35% (Baron-Cohen et al., 1993). •The potential synaesthetes were not given any warning of the retest, while the matched controls were informed that they would be repeating the same test again in ten weeks.
52 33
FLUENCY
2
3 4
Synaesthetes
1 2 3 4 NonSynaesthetes
69
63 60
20
FLEXIBILITY
ORIGINALITY
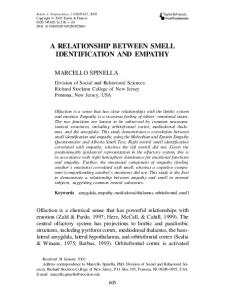
•Synaesthetes scored higher than non-synaesthetes on all three measures of creativity •We did a 3(levels of creativity) x 2 (synaesthetes verses non-synaesthetes) mixed design
Table 1. Descriptive Statistics of Test of Genuineness Consistency scores.
ANOVA, which produced main effects of synaesthesia, [F(1,6) = 22.47, p<.005], and of
•Synaesthetes score higher and there is no overlap between the groups’ scores, while variance is low and similar.
synaesthesia, [F(2, 12)=7.41, p<.01].
PHASE 2: TESTING FOR CREATIVITY
•Test of Genuineness (TOG) (Baron-Cohen et al., 1993) This quantifies the consistency of word-colour associations over time.
80
10
S: Synaesthete NS: Non-Synaesthete
potential experineces.
100
20
0
Mean SD Minimum Maximum % above 70% % below 50%
120
40
1
PHASE 1: IDENTIFYING THE SYNAESTHETES
FIGURE 2. Mean Creativity Scores for Synaesthetes and NonSynaesthetes.
30
1989).
165
148
140
Experimenter
70
•One example of behavioural difference is their above average levels of creativity (Domino,
•Here, we compare three measures of creativity between synaesthetes and matched controls.
Non-Synaesthete 160
80
% consistency score
•A clear distinction between the consistency
Synaesthete
180
90
FIGURE 1. Consistency scores on the Test of Genuineness.
•The most recent neurological theories of synaesthesia postulate a genetic mutation causing
•Atypical behavioural patterns in synaesthetes have been observed (Cytowic, 1989/2002)
Results:
100
Creativity Score
INTRODUCTION:
creativity type, [F(2,12)=20.44, p<.001], and an interaction between creativity type and
•For the interaction, synaesthetes scored significantly higher than non-synaesthetes (p>.005 for fluency and originality) but for flexibility there was no significant difference. •There was a simple main effect of level of creativity for synaesthetes [F(2, 12) = 22.596, p<.005] but not for non-synaesthetes [F(2,12) = 2.252, p=.147]. Post-hoc Tukey test revealed significant differences for the synaesthetic participants for comparisons of flexibility compared to fluency and originality score means (p<0.05).
Materials: The Torrance Test of Creative Thinking - FORM A (TTCTA) (Torrance et al., 1992).
CONCLUSIONS: •The statistical analysis indicates that the synaesthetes performed significantly higher than their
Participants: Four synaesthetes and Four matched non-synaesthetes from phase 1, all female undergraduates, mean age 19.
Methods: •Participants’ creative abilities were measured with the TTCTA (Torrance et al., 1992) and they were not told the reason for or nature of the test. •Each instruction was read orally, participants recorded their own responses, and time limits recorded with a stopwatch for each of the seven activities of the test.
matched controls on fluency and originality but not on flexibility. • Results support Domino’s (1989) claim that synaesthetes have higher levels of creativity than non-synaesthetes. •Results also support the theory that synaesthetes may have atypical behavioural traits (Cytowic, 1989), which could be indicative of their specific neural patterns such as hyper-connectivity between the sensory areas of the brain (Ramachandran & Hubbard, 2001b).
References Baron-Cohen, S., Harrison, J., Goldstein, L. H. & Wyke, M. (1993). Coloured Speech Perception: Is synaesthesia what happens when modularity breaks down? Perception, 22(4) 419-426.
•The seven sets of responses for each participant were evaluated and rated for:
Cytowic, R. E. (1989/2002). Synesthesia: a union of the senses. New York: Springer-Verlag.
• Flexibility: total number of 109 possible categories used by a participant.
Domino, G. (1989). Synesthesia and creativity in fine art students: an empirical look. Creativity Research Journal, 1, 7-29.
•Fluency: total number of relevant responses given. No maximum limit.
Ramachandran, V. S. & Hubbard, E. M. (2001a). Psychophysical investigations into the neural basis of synesthesia. Proceedings of the Royal Society of London, B, 258, 979-83.
•Originality: the marks, as defined by the TTCTA, for creativity of responses. No maximum limit.
Ramachandran, V. S. & Hubbard, E. M. (2001b). Synaesthesia – A window into perception, thought and language. Journal of Consciousness Studies, 8(12), 3-34. Torrance, E. P., Ball, O. E., Safter, H. T. (1992). Torrance Test of Creative Thinking. Bensville, III, Scholastic Testing Service. This research was funded by a grant from the ESRC to CMM, and from NIMH to EMH