The Voting Rights of Ex-Felons and Election Outcomes in the United States∗ Tilman Klumpp†
Hugo M. Mialon‡
Michael A. Williams§
March 2017
Abstract Approximately one in forty adult U.S. citizens has lost their right to vote, either temporarily or permanently, as a result of a felony conviction. Because laws restricting voting by felons and ex-felons disproportionately affect minorities, and minorities tend to vote for Democratic candidates, it has been hypothesized that felony disenfranchisement hurts Democratic candidates in elections, thus helping Republican candidates. We test this hypothesis using variation in felony disenfranchisement laws across U.S. states and over time. During the 2000s, a number of states restored the voting rights of ex-felons. Using difference-indifferences regressions, we estimate the effect of laws reenfranchising ex-felons on the vote shares of major party candidates in elections for seats to the U.S. House of Representatives. We argue that the regression estimates provide an upper bound for the true effect of restoring voting rights to ex-felons on the vote shares of major party candidates. Using this upper bound, no House majority would have been reversed in any year between 1998 and 2012, had all states allowed ex-felons to vote. Keywords: Voting rights; election law; felony disenfranchisement; U.S. Congress. JEL codes: D72, K19
∗ We
thank Xuejuan Su for helpful comments, and Grace Baek, Leslie Park, and Michaela Patzner for excellent research assistance. Tilman Klumpp would like to thank Kai Konrad and the Max Plack Institute for Tax Law and Public Finance (Munich) for their hospitality and support during the winter of 2017, when this paper was completed. Tilman Klumpp acknowledges financial support by the Social Sciences and Humanities Research Council of Canada. † University
of Alberta. Department of Economics, 9-20 Tory Building, Edmonton, AB, T6G 2H4, Canada.–
[email protected]. ‡ Emory
University. Department of Economics, 317 Rich Building, 1602 Fishburne Dr., Atlanta, GA 30322, USA.
[email protected]. § Competition Economics, LLC. 2000 Powell Street, Suite 510, Emeryville, CA 94608, USA. ——————
[email protected].
1
Introduction
A felony conviction in the United States usually implies a loss of voting rights. At present, 48 U.S. states and the District of Columbia prohibit voting while incarcerated for a felony offense; 35 states prohibit persons on parole or probation from voting; and twelve states impose voting restrictions on at least some categories of ex-offenders who have completed their sentence. We investigate the hypothesis that excluding felons from the right to vote changes the vote shares of major party candidates in elections. This hypothesis is motivated by two observations. First, while felony disenfranchisement laws affect approximately one in forty American adults, they disproportionately restrict voting by racial minorities. For example, approximately one in every thirteen black adults in the U.S. currently cannot vote as the result of a felony conviction, and in three states (Florida, Kentucky, and Virginia) more than one in five black adults is disenfranchised.1 Second, since the 1970s minorities have voted overwhelmingly for Democratic candidates in national elections. For example, at least 83% of African-Americans voters voted for the Democratic candidate in every presidential election since 1976, while no Democratic presidential candidate was able to attract more than 48% of the white vote in any election during that period.2 Based on these facts, it may seem reasonable to conjecture that felony voting restrictions hurt Democrats at the polls, and help Republicans. The problem with this conjecture, however, is that it relies on two unproven assumptions: First, that disenfranchised felons, if given the right to vote, would turn out to vote in large enough numbers to affect election outcomes. Second, that conditional on voting, a felon’s decision of who to vote for is similar to the choice made by a non-felon of the same race. In an influential paper, Uggen and Manza (2002) examined whether U.S. national elections between 1978 and 2000 would have produced different winners if all disenfranchised felons had been allowed to vote, under the assumption that the counterfactual turnout and voting decisions of disenfranchised felons would have been the same as the decisions of registered voters with the same socio-demographic characteristics (which were predicted from voter surveys using regression analysis).3 They estimated that removing felony voting restrictions in the United States would have increased the number of Democrats elected to the U.S. Senate in every election between 1978 and 2000, and that “if disenfranchised felons in Florida had been permitted to vote [in the 2000 presidential election], Democrat Gore would certainly have carried the state, and the election” (p. 792). A number of authors have since questioned these estimates and the assumptions on which they are based. Miles (2004) compared the turnout rates (estimated from voter surveys) of African-American males—the group most likely to be convicted of a felony—to those of whites 1 Source:
The Sentencing Project (www.sentencingproject.org). University of Connecticut, Roper Center for Public Opinion Research, www.ropercenter.uconn.edu/ polls/us-elections/how-groups-voted. 3 In other words, turnout and voting behavior was assumed to be uncorrelated with felony status, holding constant an individual’s race, age, marital status, etc. 2 Source:
1
and females, in states that barred ex-felons from voting and in states that did not. He found no statistically significant effect of post-sentence voting restrictions on the turnout rate of black males during the period 1986–2000, suggesting that these restrictions were likely not binding for affected individuals. Haselswerdt (2009) arrived at a similar conclusion, finding that, in a sample of 660 New York ex-felons, only 5 percent voted in the 2004 elections. However, using data from the National Longitudinal Survey of Youth, Hjalmarsson and Lopez (2010) estimated that 26 percent of ever-incarcerated persons voted in the 2004 elections. Similarly, by matching offender records with voter registration files in five states, Burch (2011) estimated that 22% of ex-felons voted in the 2008 elections.4 Although these estimates differ from one another substantially, they are all well below the turnout rates in the general voting-eligible population,5 which suggests that the impact of felony voting restrictions on election outcomes might be more limited than the effect computed by Uggen and Manza (2002). Our analysis follows a more direct strategy to estimate the effect of felony voting restrictions on election outcomes. We utilize a wave of actual policy changes that affected felon voting rights in a number of U.S. states between 1998 and 2012. During this period, several states tightened their voting restrictions, but many others relaxed them. For example, the most severe restriction— a lifelong ban from voting following a felony conviction—was imposed by ten U.S. states at the beginning of our sample. By 2005, this number had fallen to two states, before rising again to three in 2011. The resulting variation in the scope and severity of felony disenfranchisement laws, over time and across jurisdictions, offers an opportunity to estimate the effect of these laws on the outcomes of national elections without having to make assumptions about, or estimate, turnout rates by previously disenfranchised individuals. As most changes in disenfranchisement laws in the 1990s and 2000s concerned the voting rights of ex-felons (as opposed to those in prison, on probation, or on parole), we focus on post-sentence voting restrictions only. Post-sentence restrictions account for approximately four out of five disenfranchised individuals in states that impose them. Using FEC election data, we estimate the impact of removing post-sentence voting bans on the outcomes of elections for seats in the U.S. House of Representative between 1998 and 2012. We find that reenfranchising ex-felons increased the vote share of Democratic candidates in House elections by several percentage points. When plausibly exogenous controls for the number of candidates and the presence of an incumbent in election races are included in the regressions, the estimated effect size ranges from a 0.6 percentage points increase in Democratic vote share associated with laws that restored the voting rights of some ex-felons, to a nearly 4 Burch
(2011) also suggests that “turnout among felons . . . is certainly lower than that of similar individuals with low socioeconomic status from the general population” (p. 701). Furthermore, Burch (2012) argues that, even though black ex-felons who register to vote overwhelmingly register as Democrats, the ex-felon population in several states (including Florida) contains enough whites of low socioeconomic status—a group that has tended to vote Republican in recent elections—for rights restoration to result in a net gain for Republican candidates in these states. 5 More than 51 percent of the voting-eligible age population voted in every presidential election since 1948, and more than 38 percent voted in every midterm election. (Source: www.electproject.org/national-1789-present.)
2
four percentage points increase associated with laws that restored the voting rights of all exfelons. While these estimates seem to support the hypothesis that felony disenfranchisement laws disproportionately restrict voting by individuals who would have voted for Democratic candidates, none are statistically significant at the 10% level. Moreover, we show that the even these (non-significant) estimates imply an implausibly large number of disenfranchised ex-felons who had their rights restored, or implausibly high rates at which ex-felons turn out to vote, and vote for Democrats. We emphasize that our dataset includes every election race for U.S. House of Representatives that occurred over a 14-year period, and covers every change in state felony disenfranchisement laws. However, given the limited number of states that changed their ex-felon voting restrictions, the fact that only 435 congressional elections take place every two years, and that many other factors (some of which we control for) influence election outcomes, any remotely plausible effect of ex-felon voting bans on vote shares is too small to yield regression estimates that are significantly different from zero in the election data. Our estimates, although not significant, provide an upper bound for the true size of the effect of felony disenfranchisement laws in House elections between 1998 and 2012. We calculate that an effect equal to this upper bound would have resulted in Democrats winning between zero and four additional seats in every House election between 1998 and 2012, had ex-felons been allowed to vote in all states—gains that would not have been sufficient to change the majority from Republican to Democrat in any year in which Republicans held a House majority. Thus, even if felony disenfranchisement does affect vote shares, its impact is too small to affect aggregate political outcomes in the context of elections to the U.S. House of Representatives. The remainder of the paper proceeds as follows. In Section 2 we review changes in felony disenfranchisement laws that were enacted in several states between 1998 and 2012. In Section 3 we describe our dataset. In Section 4 we develop our empirical approach, which consists of a basic difference-in-differences regression framework to estimate the effect of felon voting rights on vote shares, and a set of “calibration tests” that we use to assess the plausibility of the regression estimates. We present our results in Section 5. Section 6 concludes. An Appendix contains a detailed description of the changes in ex-felon voting rights that occurred in the United States between 2000 and 2011.
2
Felony Disenfranchisement in the United States
The practice of felony disenfranchisement in the United States dates back to the colonial period, but its present-day legal foundation is the Fourteenth Amendment to the U.S. Constitution, passed in 1868. While generally known for its equal protection clause, the Fourteenth Amendment allows states to deny the right to vote to citizens convicted of “participation in rebellion, or other crime.” Behrens (2004) and Ziegler (2011) provide comprehensive reviews of the legal and political history of felony disenfranchisement in the United States, to which we briefly return at the end
3
of this section. In the meantime, we focus on recent developments in felon voting rights that occurred from the late 1990s to early 2010s. State felony disenfranchisement laws differ in many dimensions, including which felons are barred from voting and what options (if any) for voting rights restoration are available to individuals convicted of a felony. Felony voting restrictions can be categorized as those that apply to felons in prison, felons released on probation or parole, and ex-felons who have completed their sentence. Nearly all states prohibit voting by prisoners (as does the District of Columbia). In 1997, only Massachusetts, Maine, Utah, and Vermont allowed the incarcerated to vote. Utah and Massachusetts adopted laws barring prisoners from voting in 1998 and 2000, respectively, leaving Maine and Vermont as the only states that currently allow their prisoners to vote. Thirty-five states currently restrict parolees from voting, and thirty-one states restrict offenders on probation from voting. Changes occurred in 2001, when Connecticut lifted its voting bans for offenders on probation; in 2006, when Rhode Island lifted its voting bans for offenders on probation or parole; and in 2012, when South Dakota instituted a voting ban on offenders on probation.6 Most recent changes in felony disenfranchisement laws affected the voting rights of ex-felons. This category can be further subdivided into two types of restrictions. We speak of a full voting ban if a state has a general rule excluding ex-felons from voting for life. In some cases, states provide a narrow path for ex-felons to regain their voting rights by petitioning the state’s parole board or governor, typically in conjunction with seeking a pardon or executive clemency. However, if this process is unlikely to be successful, or is not utilized by most ex-felons, we continue to classify the legal regime as a full voting ban. On the other hand, a state has a partial voting ban if a clearly defined subgroup of ex-felons is eligible to vote when certain conditions are met or become eligible to apply for the restoration of voting rights through a non-discretionary process. The criteria that define the subgroup vary from state to state and may include the nature of the crime, whether the individual is a first-time or repeat offender, and the time passed since completion of the sentence. At the end of the 1990s, fourteen states had post-sentence voting bans. In ten of these states—Alabama, Delaware, Florida, Iowa, Kentucky, Nebraska, Nevada, New Mexico, Virginia, and Wyoming—the post-sentence restriction was a lifelong voting ban with no possibility of reinstatement of voting rights. Delaware lifted its ban in 2000 and replaced it with a partial ban. In the following year, New Mexico completely removed any post-sentence restrictions. In 2003, Alabama, Nevada, and Wyoming replaced their full bans with partial bans, and in 2004 Florida did the same. In 2005, Iowa eliminated its full post-sentence voting ban, while Nebraska replaced its full ban with a partial ban. In 2007, Maryland eliminated its partial post-sentence 6 Probation is generally applied to punish persons convicted of lesser crimes and first-time offenders. An individual who is placed on probation does not enter prison unless he offends again or otherwise violates the terms of his probation. An individual who entered prison but is released before the full sentence is served (e.g., for good behavior) is placed on parole. All states that allow voting while on parole also allow voting while on probation. For most states the converse is true as well. The only states that currently allow voting while on probation but not parole are California, Colorado, New York, and Connecticut.
4
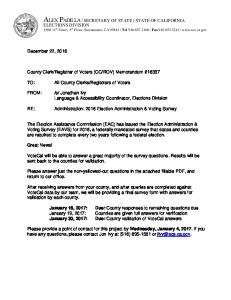
ban. Finally, in 2011 Iowa reinstituted a full post-sentence voting ban; however, that ban applied only to newly released convicts, resulting in a de-facto partial ban in 2011 and later. At the end of 2012, twelve states had some post-sentence voting restrictions on their books, but only two of these states—Kentucky and Virginia—barred all convicted felons from voting for life throughout the 1998–2012 period. Figure 1 shows the prevalence of post-sentence voting restrictions, in terms of both the number of states and the number of congressional districts in which they apply, in the United States for each year between 1998 to 2012. In the Appendix, we provide more information about how we classified voting restrictions in each state that changed them. The post-sentence category is important not only because it saw the most changes, but also because it affects more individuals than any other category. For example, while approximately 2.5 million individuals were either serving a prison sentence or were released on parole in the U.S. in 2010, more than twice as many individuals (5.2 million) were ex-felons who had completed their sentence (Shannon et al. 2010). In the same year, 45% of the disenfranchised U.S. population were ex-felons, despite the fact that only eleven states had post-sentence voting restrictions in 2010. Within these eleven states ex-felons accounted for 78% of the disenfranchised (Uggen et al. 2012). Moreover, assuming that at least some convicted criminals are successfully rehabilitated and reintegrated into society, the group of ex-felons may also be more likely to vote in elections, relative to the other categories of disenfranchised citizens. States change their felony voting restrictions either through executive order or through legislative action. In Figure 1 we indicate the party affiliation of the state’s governor at the time the change was enacted, as well as the party in control of the state Senate and state House or Assembly. Blue state labels indicate Democratic governorship or Senate/House control, and red state labels indicate Republican governorship or Senate/House control. Five of the nine changes that lifted previous voting restrictions occurred under Democratic governors, and four under Republican governors. Control of the Senate rested with Democrats in three of these cases, and with Republicans in four cases. Similarly, Democrats controlled the House in four instances, and Republicans in four instances. There are two main reasons why legislators and governors of both parties have supported the restoration of voting rights. First, the political history of felony voting restrictions in the United States is closely tied to larger questions of civil rights. For example, Behrens (2004, p. 246) notes: “The connection between felon disfranchisement and race is strong. The first wave of changes in felon disfranchisement laws occurred soon after the Civil War, corresponding with the extension of voting rights to minority groups in the Constitution, and much of the discourse of the era evidences the clear and conscious intent to disfranchise minorities in this manner.” While this intent may no longer exist today, its consequences outlasted the Reconstruction era. For example, in 1998 (the year our dataset begins), in congressional districts in which all felons, including the incarcerated, were allowed to vote, an average of 3.5% of the population was African-American. In the same year, this average was 10.5% in districts where prisoners were banned from voting;
5
13.0% in districts where prisoners and those on probation or parole were banned from voting; and 16.3% in districts where convicted criminals could be banned from voting for life. Given the racially tainted history of felony voting restrictions, and its lasting reminders, policy makers may view the restoration of voting rights as a worthy cause that transcends party politics. Second, independent of their political affiliation, policy makers increasingly view restoration of voting rights as one in a larger set of measures to reform the criminal justice system, aimed at increasing an offender’s chance of rehabilitation and reducing the rate of recidivism (P´erez et al. Figure 1: Voting rights of ex-felons in the United States, 1998–2012. 50 No restrictions 15
NM IA MD DE
10
States
IA
NM
AL NV WY
Partial ban FL
5
IA NE
Full ban
Congressional districts
Full ban 25
Partial ban
50 (RA)
75 (RA)
(RA)
100
No restrictions 435 1998
2000
2002
2004
2006
2008
2010
2012
Notes: States that changed their felony disenfranchisement laws are noted in the year the new restrictions went into effect. Colored dots indicate: Party of the governor; Senate majority; House/Assembly majority (in year of change, blue = Democrat, red = Republican). Iowa’s Senate was split between Democrats and Republicans in 2005. Nebraska’s legislature is unicameral and non-partisan (gray). (RA) = Re-apportionment following decennial census.
6
2015). For example, convicted felons in Florida may not only lose their right to vote, but also many other rights, including the right to obtain and hold state licenses necessary to work in a number of jobs. From the perspective of an affected individual, the loss of such rights can have far more severe, and far more immediate, consequences than the loss of voting rights. Florida’s decision to restore the voting rights to certain groups of ex-felons in 2004 was part of an effort to restore a larger set of rights, with the clear objective to help the affected individuals reintegrate into society. The rehabilitation perspective applies, in particular, to ex-felons who have completed their sentence, as well as felons on parole or probation, who are permitted to live in the community during part or all of their sentence. The majority of legal changes affecting individuals in these categories has, in fact, been in the direction of granting greater voting rights.
3
Data and Sample Selection
In order to test whether felony disenfranchisement laws take a disproportionate share of votes away from Democratic candidates, as has been hypothesized, we constructed a dataset linking voting rights and election returns in the United States. In this section we describe our data sources, sample selection procedure, and construction of variables used in the analysis. Based on the classification criteria discussed in the previous section, we created two indicator variables that represent post-sentence voting rights in a given state and year. The first variable, AllowAllst , equals one if state s in year t had no post-sentence voting restrictions, that is, if it allowed voting by all ex-felons. The second variable, AllowPartialst , equals one if state s in year t had a partial post-sentence voting ban, that is, if it allowed voting by some but not all ex-felons. If state s had a full post-sentence voting ban in year t, then AllowPartialst = AllowAllst = 0. These variables are the main explanatory variables in our regressions. We then downloaded race-level election data for all 435 voting seats in the U.S. House of Representatives between 1998 to 2012 from the website of the Federal Election Commission (“FEC”). As this period covers eight national elections, we have information on 8 × 435 = 3, 480 election races.7 An election race consists of all elections associated with a given House seat in a given election year, including primary, general, and (if necessary) runoff elections. For each such race, the FEC dataset contains the names of all candidates who ran for office or who received at least one vote as write-in candidates, as well as their incumbency status, party affiliation, and number of votes received in each election. We focus on general elections, for which approximately 769 million votes are recorded in the FEC data during 1998–2012. We excluded approximately 1.6 percent of these votes. First, with one exception to be explained below (see Footnote 11), we excluded votes for write-in candidates with no verifiable party affiliation. Such candidates did not officially run for office 7 The FEC tables are available at www.fec.gov/pubrec/electionresults.shtml. For 1998–2012, they also contain 257 races for seats in the U.S. Senate, as well as 4 × 50 = 200 state-by-state results for Presidential elections. Due to the small sample sizes for Senate and Presidential elections, we focus on House races only.
7
and, generally, received a negligible number of votes per candidate. In those instances where a write-in candidate was also an official candidate on the ballot, we allocated the write-in votes to the party that appeared for this candidate on his or her official ballot entry. Second, the state of Nevada allows its citizens to vote for “None of these candidates.” It is not unusual for this option to receive a substantial number of votes; however, because these votes are not for an actual candidate we excluded them as well. The remaining votes are for candidates who appear on the ballot as either party candidates or independents, and a political party label or the label “Independent” is assigned to each of these candidates by the FEC. We made the following adjustments to this assignment. First, some states allow for electoral fusion, meaning that multiple parties nominate the same candidate, whose name then appears multiple times on the same ballot (once for each party).8 For such candidates, we computed the combined votes across parties, and assigned this total to the party under whose label the candidate received the most votes (in all cases, this was either the Republican or Democratic party). Second, some candidates’ party is recorded as “Republican/Democrat” or “Democrat/Republican.” In these cases, we used the party whose primary the candidate had entered as the candidate’s party (this determination could always be made unambiguously). Third, in Minnesota the official name of the Democratic party is “Democratic-Farmer-Labor Party” (“DFL”), and in North Dakota the official name of the Democratic party is “Democratic Nonpartisan-League Party” (“NPL”). In these states, we counted votes for DFL and NPL candidates as votes for Democrats. Finally, we made three discretionary changes to a candidate’s party affiliation. We changed the party label of Vermont candidate Bernie Sanders from “Independent” to “Democrat” in the 1998, 2000, 2002, and 2004 elections;9 we changed the party label of Virginia candidate Virgil Goode from “Independent” to “Republican” in the 2000 elections;10 and we changed the party label of Texas candidate Shelley Sekula-Gibbs from “Write-In” to “Republican” in the 2006 election.11 8 The
most prominent state to use electoral fusion is New York. represented Vermont’s at-large congressional district as an Independent until 2007, when he became Vermont’s junior U.S. Senator. Sanders caucused with congressional Democrats during both his time in the House and the Senate, and was not opposed by a Democrat in all but the 2004 elections (where he was opposed by Democratic candidate Larry Drown, who received less than eight percent of all votes). For these reasons, we classify Sanders as a Democrat in our dataset. 10 Goode ran in, and won, Virginia’s 5th district as a Democrat in 1996 and 1998. In 2000, he ran in the same district as an Independent, and won. He then ran as a Republican in 2002, 2004, 2006, and 2008, when he lost. When Goode ran as an Independent in 2000, he was unopposed by a Republican but was opposed by a Democrat. For these reasons, we classify Goode as a Republican in the 2000 election. 11 In 2006, Sekula-Gibbs was a write-in candidate in Texas’ 22nd district, a seat previously held by former House majority leader Tom DeLay (R). Under indictment for money laundering, DeLay resigned from his post as House majority leader in 2005. He nevertheless ran for reelection and won the Republican nomination in March 2006. However, the following month DeLay withdrew from the race after a former aide had pleaded guilty to corruption charges related to the Jack Abramoff lobbying scandal. By then, it was legally too late to nominate a replacement candidate for DeLay, forcing the Texas Republican party to “nominate” a write-in candidate, Sekula-Gibbs, to run against Democratic nominee Nick Lampson, who later won the race with 52 percent of the vote. (See, e.g, en.wikipedia.org/wiki/Texas’ 22nd congressional district elections, 2006.) 9 Sanders
8
After these adjustments were made, 48.1 percent of the approximately 757 million remaining votes went to Republican candidates and 49.1 percent went to Democratic candidates, with the remainder going to third-party candidates and independents. We then computed the following measure of Democratic vote share for each of the 3, 480 individual elections in our sample: ρist =
VistD , VistD +VistR
(1)
where VistD and VistR are the number of general election votes cast for Democratic and Republican candidates, respectively, in congressional district i in state s in year t. Note that the corresponding vote share for Republican candidates is 1 − ρist , which means that changes in ρist reflect shifts in vote share among the two major parties. At least one major party candidate ran in every election in our dataset, so (1) is well defined. Furthermore, with one exception, a Democratic candidate won office if and only if ρist > 0.5.12 We use the vote share measure ρist as the main outcome variable in our regressions.13 Lastly, for each election we constructed the following race-level control variables from the FEC data: Two dummy variables indicating if a Democratic (Republican) candidate ran in the general election; two dummy variables indicating if a Democratic (Republican) incumbent ran in the general election; and three count variables indicating the number of all candidates as well as the number of Democratic (Republican) candidates in a race, including candidates who competed in the primary elections. For each state and election year, we also included an indicator for Democratic governorship as well as a standard set of demographic variables.14 Table 1 shows summary statistics (mean, standard deviation, minimum, and maximum) of our outcome variable, explanatory variables, and race-level control variables. The unit of observation is a congressional district in a state in a given election year. We report two sets of statistics: One for the full dataset of 3, 480 observations, and one for a restricted sample of 2, 175 observations that cover the years 2002–2010 only. The reason we examine a restricted sample is the reapportionment of congressional districts, and redrawing of district boundaries within states, that occurs after each decennial census. The process by which district boundaries are redrawn is 12 The exception was the 2002 election in Louisiana’s 5th congressional district. Because Louisiana does not have primary elections, several candidates of the same party are allowed to compete in the same general election. In this case, four Republican candidates won a total of 68 percent of the vote, but none of them a majority. This forced a runoff election between the top two vote getters, Republican candidate Lee Fletcher and Democratic candidate Rodney Alexander, which Alexander won narrowly with 50.28 percent of the vote. 13 We also constructed two additional vote share measures, σ D = V D /V and σ R = V R /V where V is the ist ist ist ist ist ist ist number of all general election votes in district i in state s in year t (including votes for third-party and independent candidates), and ran our regressions with these outcome variables as well. Because third-party and independent candidates received very few votes relative to candidates of the two major parties, our results did not change in a major way. 14 Demographic characteristics are obtained from the U.S. Census Bureau and include: Percent population aged 15–29/30–44; percent African-American; percent high school/some college/bachelor degree; percent unemployed; and median personal income in 2012 dollars.
9
Table 1: Summary statistics. 1998–2012 (N = 3, 480)
2002–2010 (N = 2, 175)
Mean Std. dev. Min. Max.
Mean Std. dev. Min. Max.
Main variables: Democratic vote share (ρ) All ex-felons can vote (AllowAll) Some ex-felons can vote (AllowSome) No ex-felons can vote
.517 .802 .119 .078
.251 .399 .323 .271
0 0 0 0
1 1 1 1
.528 .805 .132 .063
.245 .396 .339 .243
0 0 0 0
1 1 1 1
.931 .926 .453 .449 4.202 1.503 1.686
.253 .259 .498 .487 2.476 1.182 1.504
0 0 0 0 1 0 0
1 1 1 1 22 15 13
.941 .928 .483 .438 4.172 1.505 1.706
.235 .259 .500 .496 2.532 1.175 1.528
0 0 0 0 1 0 0
1 1 1 1 22 15 13
Race-level control variables: D candidate running R candidate running D incumbent R incumbent # of all candidates* # of D candidates* # of R candidates*
D = Democrat, R = Republican. * including primary elections
highly politicized in many states, meaning that changes in district boundaries are not exogenous to voter preferences and election outcomes. This does not affect our analysis unless we include congressional district fixed effects in our regressions to capture unobserved heterogeneity across districts. For such regressions, we remove the 1998, 2000, and 2012 elections from the data and focus on the five elections that took place between 2002 and 2010, during which time the number of congressional districts in each state was constant and district boundaries were fixed. As discussed above, ex-felons have full voting rights in a majority of congressional districts. Over the full length of our dataset, all ex-felons could vote in 80.2 percent of districts on average; some (but not all) ex-felons could vote in 11.9 percent of districts on average; and all ex-felons were barred from voting in 7.8 percent of districts on average. In the 2002–2010 subsample, these fractions shift to 80.5, 13.2, and 6.3 percent, respectively. These changes are not surprising: Given the trend toward greater voting rights, by excluding two early elections but only one later election from the data, the legal regimes are, on average, more permissive in the restricted sample. Nevertheless, the variation in the voting rights variables is comparable over both time frames.15 15 This is also true for changes in these variables. Note that, when using the restricted sample, we must exclude from the analysis three legal changes that took place outside of the 2002–2010 period: The lifting of felony voting restrictions in Delaware and New Mexico in 2000 and 2001, respectively, and the reinstatement of Iowa’s voting felony ban in 2011. However, these changes affected a total of only eight congressional districts. On the other hand, seven states had legal changes that went into effect during 2002–2010, and these states account for a total of 52 congressional districts. Thus, out of the 60 observations for which AllowSomest and/or AllowAllst changed relative to the previous election year, the 2002–2010 time frame covers 87 percent.
10
All other variables are similarly distributed in the full and restricted sample. Democrats won slightly more than half of the votes cast for major party candidates on average, while Republicans won slightly less than half. While a candidate from each major party entered in a majority of races, the fraction of uncontested races in which only one major party candidate entered is not negligible ((1−.931) + (1−.926) = 14.2 percent in the full sample). Furthermore, an incumbent office holder ran for reelection in a large majority of races (.453 + .449 = 90.2 percent in the full sample).
4
Empirical Approach
Our empirical approach is based on a linear regression model to estimate the effects of ex-felon voting rights on Democratic vote share, using the panel dataset described in the previous section. Below we describe this model and discuss identification of our key variables. We then introduce a simple “structural” model of felon voting in elections. This model gives rise to a number of calibration tests that we use to assess the plausibility of our reduced form estimates.
4.1
Regression model
In our regression framework, the general election vote share of the Democratic candidate in congressional district i in state s in year t are described by the following equation: ρist = β1 AllowAllst + β2 AllowSomest + γXist + δ Zst + αs + µt + θs t + εist ,
(2)
where Xist is a vector containing our race-level controls, Zst is a vector of state-year level controls (governor’s party and demographic characteristics), αs are state fixed effects, µt are election year fixed effects, θs t are state-specific linear time trends, and εist is the error term. Congressional district fixed effects can be included in the estimation of (2), by replacing αs with αis . The coefficients β1 and β2 represent the effects of ex-felon voting rights on the vote shares of Democratic candidates running for a seat in the House of Representatives. Specifically, the coefficient β1 represents the effect of granting voting rights to all ex-felons, by eliminating a full post-sentence voting ban. β2 represents the effect of granting voting rights to some, but not all, ex-felons, by replacing a full post-sentence voting ban with a partial ban. In Figure 1, the first change corresponds to a move from the dark gray area in the center of the graph to the unshaded area on the outside, and the second changes corresponds to a move from the dark gray center area to the light gray area adjacent to it. After controlling for observed heterogeneity through Xist and Zst and detrending via θs t, identification of β1 and β2 rests on the following assumptions. First, any remaining systematic unobserved heterogeneity across states (or districts) remains constant over time and can thus be captured by the state (or district) fixed effects. Second, any remaining systematic unobserved
11
heterogeneity over time remains constant across states, so that it can be captured by the election year fixed effects. When these assumptions are satisfied, β1 and β2 are identified through difference-in-differences, and unbiased estimates can be obtained via ordinary least squares. A potential endogeneity issue arises if a state’s decision to change felon voting rights depends on election outcomes in that state. Selection into different legal regimes based solely on the level of party’s support in the electorate does not bias the OLS estimates of β1 and β2 , as such level differences are accounted for by the inclusion of state fixed effects. On the other hand, if selection was based on different trends in states’ voting patterns, the OLS estimates for β1 and β2 would be biased. For example, if some state’s demographic composition was changing in a way that increases support for the Democratic party, and Democratic policy makers systematically adopt more permissive felon voting regimes, estimation of (2) may reveal a correlation between felon voting rights and Democratic vote share which does not represent a causal relationship, or represents a causal relationship in the reverse direction. To address this issue, we included in our regression equation population characteristics and the party of the governor in a given state and election year (Zst ), as well as state-specific linear time trends (θs t). More importantly, to verify that self-selection effects did not bias our results, we examined the history of each of the relevant state laws (see the Appendix for details). Changes in state voting laws generally have been in the direction of granting greater voting rights. Laws granting greater voting rights to felons and ex-felons have been passed in traditionally “blue” and “red” states; have been passed by both Democratic and Republican legislatures; and have been signed by both Democratic and Republican governors. The histories of reenfranchising laws reveal debates regarding the importance of protecting equal rights of all citizens versus ethical concerns that some individuals should have their voting rights restricted or removed because of their crimes. Notably absent from the public debates have been expressions of concerns that changes in voting laws will benefit one party or hurt another.16 We interpret these facts as indicating a relatively non-partisan effort over the past two decades to increase the enfranchisement of felons and, in particular, ex-felons. Overall, we see no indication that voting patterns, or changes in voting patterns, played a decisive role in any state’s decision to change its felony disenfranchisement laws.
4.2
Calibration tests
Provided the regression model (2) can be estimated without bias, we can use the coefficient estimates from this regression to investigate certain underlying structural characteristics of elections. For example, we can ask the following question: Assuming X percent of disenfranchised ex-felons had their rights restored, at what rate would they have to had turned out to vote, and how would they have to had voted, in order to have generated the changes in vote shares estimated in 16 The only exception we found was a statement by an Alabama Republican party official that his party opposed the restoration of ex-felon voting rights because “felon’s don’t tend to vote Republican.” (Source: S24.)
12
the regression model? Similarly, we can ask: Assuming Y percent of ex-felons vote if eligible, and vote for a given political party, how many ex-felons would need to have had their voting rights restored in order to produce the estimated effects? We may then assess whether these implied values are realistic or plausible. We now develop a simple model of ex-felon voting in elections that enables us to perform such calibrations. Because the structural parameters are non-linear in the reduced-form estimates, we do not suggest this method as an alternative to more direct approaches of estimating felon voting behavior or the percentage of disenfranchised individuals. However, the calibrations serve as a simple and useful plausibility check for our regression results, and they allow us to connect our estimates of vote share responses to recent research on felon turnout rates. Let f be the population of ex-felons in a state that disenfranchises all ex-felons. Let τn f be the turnout rate among non-felons, and let τ f be the turnout rate among ex-felons, if they are allowed to vote. Let pn f be the propensity of non-felons to vote for a Democratic candidate instead of a Republican (we ignore other parties here), and let p f be the same propensity for ex-felons. In a state that does not allow its ex-felons to vote, Democratic vote share is ρ f ull ban = pn f . If the state eliminates its full voting ban, Democratic vote share becomes ρno ban =
(1 − f ) · τn f pn f + f · τ f p f . (1 − f ) · τn f + f · τ f
Thus, lifting the ban increases Democratic vote share by β1 = ρno ban − ρ f ull ban =
f rd , 1 − f (1 − r)
(3)
where r = τ f /τn f and d = p f − pn f . If, instead, the state replaces its full voting ban with a partial ban, and a fraction λ of ex-felons are eligible to vote under the partial ban, Democratic vote share becomes (1 − f ) · τn f pn f + λ f · τ f p f ρ partial ban = (1 − f ) · τn f + λ f · τ f and the increase in vote share of Democratic candidates is β2 = ρ partial ban − ρ f ull ban =
λ f rd . 1 − f (1 − λ r)
(4)
(Note that d > 0 and λ ∈ (0, 1) implies β1 > β2 > 0.) If we estimate (2) and take the point estimates βˆ1 and βˆ2 as values for β1 and β2 , we can solve (3)–(4) for any two of the four parameters f , λ , r, and d. For example, if we know (or have estimates of) the policy parameters f and λ , we can solve for the behavioral parameters as follows: 1 − f βˆ2 − λ βˆ1 1−α r = · , d = βˆ1 βˆ2 · . ˆ ˆ ˆ λf β1 − β2 β2 − λ βˆ1
13
Since p f ≤ 1 the parameter d cannot be larger than 1 − pn f , and it is straightforward to show that this implies λ ≤ βˆ2 (1 − pn f − βˆ1 )/βˆ1 (1 − pn f − βˆ2 ). Furthermore, it is highly implausible that τ f > τn f , that is, that ex-felons have higher turnout rates than non-felons. Hence, we should assume that r ≤ 1, and this is the case if and only if λ ≥ (1 − f )βˆ2 /(βˆ1 − f βˆ2 ). Thus, given f and pn f the sensible range for λ is βˆ2 − f βˆ2 βˆ2 1 − pn f − βˆ1 ≤ λ ≤ . βˆ1 − f βˆ2 βˆ1 1 − pn f − βˆ2 This range is narrow. As an illustration, suppose we estimated βˆ1 = 0.015 and βˆ2 = 0.01. Then, assuming that 7.5 percent of the voting-age population were disenfranchised in states that had full bans before they changed their laws ( f = 0.075, which is within the range reported in Uggen et al. 2012), and that pn f = 0.5, the interval of possible values for λ is [0.6491, 0.6599].17 By setting λ equal to the lower end of this range we get a lower bound on d equal to 0.2, and by setting λ equal to the upper end we get a lower bound on r equal to 0.3814. Thus, to produce Democratic vote share gains as measured by the estimated coefficients βˆ1 = 0.015 and βˆ2 = 0.01, the propensity to vote for Democrats must be at least 20 percentage points higher among ex-felons than among non-felons, and this lower estimate applies under the assumption that ex-felons turn out to vote at exactly the same rate as non-felons. Similarly, the turnout rate of ex-felons must be at least 38.1 percent of the turnout rate of non-felons to produce the estimated effects, and this estimate applies under the assumptions that all ex-felons vote for Democrats. Finally, we can also go the other way around. That is, we can make assumptions about the values of the behavioral parameters r and d—by taking estimates from existing studies, for example—and compute the implied policy parameters f =
βˆ1 , rd + βˆ1 (1 − r)
λ =
βˆ2 d − βˆ1 βˆ1 d − βˆ2
that are consistent with a given (βˆ1 , βˆ2 )-pair, under these assumptions. For example, suppose that ex-felons are half as likely to vote compared to non-felons (r = 0.5), and that 85 percent of ex-felons vote for Democrats if they vote (this propensity would be consistent with the voting behavior of African-American voters in presidential elections). If 50 percent of non-felons vote for Democrats, we get d = 0.35. Under these assumptions, the estimates of βˆ1 = 0.015 and βˆ2 = 0.01 imply f = 0.082 and λ = 0.657. In other words, 8.2 percent of individuals must be disenfranchised in states with full voting bans for these estimates to be consistent with the
17 This
means that, in states with 7.5 percent ex-felons, a typical partial voting ban should disenfranchise roughly one-third of the individuals in this group in order to be consistent with the given estimates. If accurate corrections statistics are available, it is theoretically possible to verify whether partial voting bans in the states are consistent with this, or any other, range of λ -values.
14
behavioral assumptions. Again in this case, the calibrated value of f = 0.082 is rather large but still within the range of values reported in Uggen et al. (2012).
5
Results
Table 2 contains the OLS estimates for the regression model (2). The table has six columns, divided into two sets of three. The first set (columns 1–3) contains results based on regressions that include state fixed effects but not district fixed effects, using the full 1998–2012 time frame. The second set (columns 4–6) shows results based on regressions that include district fixed effects, using the 2002–2010 election years only. Within each set, the left column does not contain any race-level controls, and the center column contains the full set of race-level controls. The right column contains results for estimations restricted only to those elections in which a candidate from each major party was running. Let us look at columns 1 and 4 first. Using the full 1998-2012 period, in states that replaced a full post-sentence ban with a partial ban, and thus allowed some ex-felons to vote, Democratic candidates saw a statistically significant increase in general election vote share of 3.98 percentage points, relative to Republican candidates (βˆ1 = 0.0398). When district fixed effects are added and the sample is restricted to 2002–2010, the effect size increases to 5.37 percentage points and becomes significant at the 1 percent level. However, the β2 -coefficients are not statistically significant in either column 1 or column 4. Moreover, βˆ1 is smaller in magnitude than βˆ2 in column 1, and of the opposite sign in column 4. This appears inconsistent with the structural arguments developed in the previous section—if allowing some, but not all, ex-felons to vote increases Democratic vote share, then one should expect that allowing all ex-felons to vote has at least the same effect. When our race-level variables are included (columns 2 and 5), model fit improves considerably. Furthermore, the presence of an incumbent, the number of candidates, and whether or not at least one candidate from each major party entered the race, are highly significant predictors of ρ. However, both Allow variables are now insignificant. While changes in felony disenfranchisement laws could, theoretically, affect the decisions of candidates to enter election races or the decisions of incumbents to seek reelection, we believe that a causal effect in this direction is highly improbable. Elections for seats in the U.S. House of Representatives are high-profile affairs, and the payoff associated with winning a House seat is considerable. For example, Diermeier et al. (2005) estimate the monetary value of winning a seat in the House of Representatives to be more than $616, 000 in 1995 dollars (which equates to $790, 000 in 2005 dollars, and to $960, 000 in 2015 dollars). It is very unlikely that a candidate’s decision to compete for a prize of this magnitude would depend on whether ex-felons are permitted to vote in the candidate’s state. Thus, any correlation between voting rights and our race-level control variables is unlikely to indicate a causal effect.
15
Table 2: Effects of ex-felon voting rights on Democratic vote share in U.S. House elections. 1998–2012 (1) AllowAll (βˆ1 ) AllowSome (βˆ2 )
∗∗∗
−.0257∗∗∗
(.0325)∗∗∗
.0398∗∗∗
(.0185)∗∗∗
.0064∗∗∗
(.0156)∗∗∗ (.0078)∗∗∗
2002–2010 (3)
∗∗∗
.0355∗∗∗
(.0261)∗∗∗
.0119∗∗∗
(.0186)∗∗∗
(4)
∗∗∗
−.0328∗∗∗ (.0358)∗∗∗
.0537∗∗∗
(.0197)∗∗∗
.1629∗∗∗
(.0092)∗∗∗
(.0023)∗∗∗
.0139∗∗∗
# of D candidates
(.0033)∗∗∗ (.0041)∗∗∗
(.0090)∗∗∗
R running
.0305∗∗∗
(.0431)∗∗∗
.0238∗∗∗
(.0250)∗∗∗
.0630∗∗∗
(.0130)∗∗∗ (.0081)∗∗∗
.0047∗∗∗ −.0027∗∗∗
(.0018)∗∗∗
(.0026)∗∗∗
.0221∗∗∗
.0141∗∗∗
(.0028)∗∗∗
(.0034)∗∗∗
(.0020)∗∗∗
.0043∗∗∗
(.0028)∗∗∗
−.0236∗∗∗ −.0025∗∗∗
(.0032)∗∗∗
(.0043)∗∗∗
.3250∗∗∗
D running
.0156∗∗∗
(.0485)∗∗∗
(6) ∗∗∗
−.1534∗∗∗ −.0717∗∗∗
(.0088)∗∗∗
−.0231∗∗∗ −.0123∗∗∗
# of R candidates
.0396∗∗∗
(.0408)∗∗∗
(.0077)∗∗∗
.0041∗∗∗ −.0058∗∗∗
# of candidates
(5) ∗∗∗
.1658∗∗∗
(.0080)∗∗∗
−.1539∗∗∗ −.1499∗∗∗
R incumbent
N R2
.0350∗∗∗
(.0238)∗∗∗
.1648∗∗∗
D incumbent
Congressional district FEs Contested races only
(2)
∗∗∗
(.0028)∗∗∗
.3161∗∗∗
(.0093)∗∗∗
(.0090)∗∗∗
−.2909∗∗∗
−.2693∗∗∗
(.0126)∗∗∗
(.0121)∗∗∗
No∗∗∗ No∗∗∗
No∗∗∗ No∗∗∗
No∗∗∗ Yes∗∗∗
Yes∗∗∗ No∗∗∗
Yes∗∗∗ No∗∗∗
Yes∗∗∗ Yes∗∗∗
3, 480∗∗∗ .1489∗∗∗
3, 480∗∗∗ .8846∗∗∗
2, 988∗∗∗ .7463∗∗∗
2, 175∗∗∗ .7935∗∗∗
2, 175∗∗∗ .9576∗∗∗
1, 890∗∗∗ .9297∗∗∗
Notes: All regressions include election year fixed effects, state fixed effects, state-year demographic controls, and state-specific linear time trends. Numbers in parantheses are robust standard errors adjusted for clustering on states. Stars denote statistical significance: ∗ significant at 10%; ∗∗ significant at 5%; ∗∗∗ significant at 1%.
If a candidate from a major party is not running in a race, then that candidate’s party must necessarily have a zero vote share, and this is the case in 492 elections in our dataset. In the vast majority (98 percent) of these uncontested elections, the unopposed candidate was an incumbent. The decision to not challenge current office holders may reflect a general incumbency advantage that has been documented in the literature (e.g., Abramowitz et al. 2006), or it could simply indicate that a number of congressional districts are very “safe” districts for one of the two major parties. Regardless of the reason why some elections are uncontested, in such elections our outcome variable ρ is either zero or one and hence cannot respond to changes in any other variable, including changes in felony disenfranchisement laws. It is, therefore, not surprising that the most important vote share predictor in columns 2 and 5 is the pair of variables indicating whether a candidate from each of the major parties was actually in the race (“D running” and “R running”). As a robustness check, we also estimated the model without the uncontested elections in the sample. The results of these regressions are reported columns 3 and 6 and are consistent
16
with those in columns 2 and 5. While βˆ2 increases in columns 3 and 6 relative to columns 2 and 5, βˆ1 and βˆ2 are still not statistically significant at conventional levels. Despite not being statistically significant, the estimates for the Allow variables in columns 2, 3, 5, and 6 of Table 2 are of the expected sign and always such that βˆ1 > βˆ2 . Hence, they are consistent with the structural framework developed of Section 4.2, which makes it possible to apply our calibration tests developed therein to assess whether the measured effect size is, in principle, reasonable. Table 3 contains two such tests. Table 3: Structural parameters implied by regression results. A. Implied disenfranchised population, assuming turnout/voting behavior Low turnout/voting scenario r = 0.45, d = 0.2 (2) (3) (5) (6) f = λ =
.320 .156
.324 .153
.354 .343
High turnout/voting scenario r = 0.9, d = 0.4 (2) (3) (5) (6)
.286 .751
f = λ =
.096 .170
.098 .167
.109 .369
.084 .767
B. Implied bounds on turnout/voting behavior, assuming disenfranchised population Low population scenario f = 0.06, pn f = 0.4 (2) (3) (5) (6) r ≥ d ≥
.971 .583
.985 .592
(1.11) (.660)
High population scenario f = 0.12, pn f = 0.4 (2) (3) (5) (6) r ≥ d ≥
.839 .501
.454 .292
.461 .296
.518 .330
.393 .254
In panel A, we consider two scenarios regarding ex-felon voting behavior. In the low turnout/voting scenario, ex-felons turn out to vote at half the rate of non-felons and are twenty percentage points more likely to vote for Democrats than non-felons. These assumptions are roughly consistent with the turnout estimate in Hjalmarsson and Lopez (2010) and the voter registration patterns discussed in Burch (2011).18 In the high turnout/voting scenario, these numbers are 90 percent and 40 percentage points, respectively. We then compute, for each scenario, the implied values for f (the fraction of disenfranchised ex-felons) and λ (the fraction of ex-felons who can vote under a partial ban) associated with the estimates in columns 2, 3, 5, and 6 of Table 2. The values for f implied by our estimates in the low scenario are clearly 18 Hjalmarsson and Lopez (2010) estimated that 26 percent of ex-felons voted in the 2004 presidential election, which is the highest among the existing estimates of felon turnout. 60 percent of the voting-eligible population voted in 2004 (www.electproject.org/national-1789-present), making r = 0.45 a slightly generous assumption. Burch (2011) found that 56 percent of ex-felons who were registered to vote in North Carolina in 2008 were registered as Democrats, and 23 percent were registered as Republicans. .56/(.56 + .23) = 0.71, and assuming an equal split of Republicans and Democrats among non-felons, we get d ≈ 0.2.
17
unrealistic, as between 28 and 35 percent of the population would have to be disenfranchised in order for rights restoration to produce the estimated gains in Democratic vote share. The high scenario begins to produce more reasonable values for f , ranging from 8 to 11 percent, with 17 to 77 percent of ex-felons having their rights restored under a partial ban. These numbers are within the range of estimates reported in Uggen et al. (2012) and not inconceivable, considering that the state of Florida, which still disenfranchises the most ex-felons at an estimated rate of more than 10 percent of the population, contributed over 40 percent of the variation in felony voting laws in our dataset (25 of 60 observations in which felony voting rights changed relative to the previous election year are Florida elections). However, the behavioral assumptions in this scenario are extremely optimistic and exceed all presently available estimates of ex-felon turnout. Panel B contains two scenarios regarding the size of the ex-felon population. In the low population scenario, we assume that six percent of the population consists of disenfranchised ex-felons and that non-felons vote for Democrats with a probability of 40 percent. This is below the 51.7 percent average in our dataset, and instead reflects the average vote share of Democratic candidates in states that had, or continue to have, full ex-felon voting bans. Under these assumptions, the estimates βˆ1 and βˆ2 imply that ex-felons are at lest 84 percent as likely to vote than non-felons and that ex-felons are at least 50 percentage points more likely to vote for Democrats than non-felons. The largest estimates are either impossible (d ≥ .66) or extremely implausible (r ≥ 1.11). We get more realistic numbers in the high population scenario, which assumes a 12 percent population share of ex-felons. For our estimates to be consistent with this assumption, ex-felons need to turn out at roughly half the rate of non-felons (assuming they all vote for Democrats if they vote); likewise, ex-felons need to be about 30 percentage points more likely to vote for Democrats (assuming they all turn out to vote). Even these bounds may seem optimistic, and the assumed population share of ex-felons is outside of the range of common estimates of the ex-felon population in any state. Where does this leave us? Recall that, for a regression estimate to reach a certain threshold of statistical significance, its standard error must be sufficiently small or its magnitude must be sufficiently large. In our case, βˆ1 and βˆ2 are not significant (at the 10% level) in the regressions with race-level control variables. We cannot realistically hope to obtain smaller standard errors by measuring election outcomes more precisely or by using more data—we already used every House election that took place over a 14-year period covering every recent change in state felony disenfranchisement laws. At the same time, the estimated effect sizes of βˆ1 and βˆ2 already imply disenfranchisement rates that exceed commonly available estimates, or felon turnout and voting behavior that is highly improbable. Thus, any statistically significant estimate of β1 and β2 obtained from our dataset would have been likely to produce even less plausible values. The true effect of felony disenfranchisement on vote shares—if one exists—must, therefore, be smaller than our point estimates.
18
Table 4: Counterfactual election outcomes if all states allow ex-felon voting. Election year
Congress
Seat distribution D - R - I
Adjusted seat distribution D - R
Needed for D majority
1998 2000 2002 2004 2006 2008 2010 2012
106th 107th 108th 109th 110th 111th 112th 113th
211 - 223 - 1 212 - 221 - 2 205 - 229 - 1 202 - 232 - 1 233 - 202 - 0 257 - 178 - 0 193 - 242 - 0 201 - 234 - 0
212 - 223 213 - 222 206 - 229 203 - 232 233 - 202 257 - 178 193 - 242 201 - 234
+6 +5 +12 +15
+25 +17
Counterfactual gains for Democrats (2) (3) (5) (6)
+1 +1
+2 +3
+2 +3
+4 +1 +3 +3
+3 +1 +2 +2
+4 +1 +2 +2
+1 +3 +3 +3 +2 +1
Notes: Seat distribution is at beginning of each Congress. Adjusted seat distribution is obtained by allocating Independents to major parties (see Footnote 9 and Footnote 10). 218 seats needed for majority; majority party in bold.
Taking our regression estimates as upper bounds, we can compute how many elections Democratic candidates would have won in a given year, under the counterfactual hypothesis that no state disenfranchised its ex-felons. That is, we can compute a counterfactual vote share C by adding βˆ to ρ in every instance where AllowSome = AllowSome = 0, and measure ρist 1 ist st st ˆ ˆ β1 − β2 to ρist in every instance where AllowSomest = 1 and AllowAllst = 0. We can then compute the number of seats Democrats would have won in election year t under the counterfactual regime, C > 0.5), and compare this number to the actual number of seats won by by calculating ∑is I(ρist Democrats in year t.19 Table 4 shows the seats Democrats would have gained this way, over the actual seats they won, based on each of the four regression estimates reported in columns 2, 3, 5, and 6 of Table 2. Similar to Uggen and Manza’s (2002) calculations for the U.S. Senate, ours show that Democrats would have won additional seats in the House of Representatives in most years, had ex-felons been allowed to vote in every state. However, for none of our estimates would Democrats have won enough additional seats to change a Republican majority into a Democratic majority in any year in which Republicans held a House majority. We conclude that felony disenfranchisement—even if it has the effect we estimated, which we know is likely too high—has little or no impact on aggregate political outcomes.
19 In 2002, we must add one to this number to account for the runoff election in Louisiana’s 5th district; see Footnote 12.
19
6
Conclusion
To our knowledge, this paper is the first to utilize changes in felony voting restrictions in order to estimate the impact of such restrictions on election outcomes. Focusing on elections for seats to the U.S. House of Representatives, we found a positive but statistically non-significant effect of ex-felon voting rights on the vote share of Democratic candidates. Even this effect implies implausible values of the number of ex-felons who had their voting rights restored, their turnout rates, or their political preferences. Taking our estimates as upper bounds on the effect of restoring voting rights on vote shares, we concluded that no House majority would have changed in any year between 1998 and 2012, had all ex-felons been allowed to vote in all states. We end this paper with two remarks. First, despite our conclusion that the voting rights of ex-felons are of little consequence for aggregate political outcomes, they matter to at least some individuals with criminal convictions. Manza and Uggen (2006) (ch. 6) show that many felons have a genuine desire to reintegrate into the community after serving their sentences, and consider civic participation an important part of the process of reintegration. The changes in felony disenfranchisement laws we examined are evidence of a growing consensus that lifelong voting bans are not only ethically problematic, but also stand in the way of efforts to reduce recidivism. Yet, ten states still restrict voting by some individuals with past felony convictions, and two states disenfranchise all ex-felons. Our finding that rights restoration has no tangible effects on election outcomes removes one potential political obstacle from reforming the criminal justice system towards one that places a greater emphasis on rehabilitation. Second, while a low voter turnout rate among ex-felons is one probable reason we did not find a stronger reenfranchisement effect, the question of why felons are less likely to vote is far from settled. Some authors recently suggested a causal link from relevant government policies to voting. Examining participation decisions following Iowa’s 2005 decision to restore ex-felon voting rights, Meredith and Morse (2015) showed that many ex-felons were unaware that their voting rights had been restored, and that receiving information about rights restoration increased the likelihood that an ex-felon voted. This suggests that the actual process of rights restoration is a factor on which ex-felon turnout depends. More broadly, Weaver and Lerman (2010) argued that contact with the criminal justice system causes a decline in several aspects of civic participation, including voting in elections. They note that, for affected individuals, “the criminal justice system is a primary site of civic education” (p. 2), and that government activity—in particular, the administration of the criminal justice system—can “serve to demobilize and dissuade citizens from engaging in political life” (p. 15). These are policy issues of great importance, and beyond the scope of our analysis. However, it is not inconceivable that, under different government policies toward criminal justice in general, political outcomes could change in more significant ways than we estimated.
20
Appendix: Detailed Description of Changes in Ex-Felon Voting Rights In Table 5, we summarize the legal changes that affected the voting rights of ex-felons in several states between 2000 and 2011 and explain how we classified a state’s legal regime in a given year in our dataset. We also provide information about the political background behind each change, which we collected from state and local news sources. Table 5: Changes in ex-felon voting restrictions by state. Delaware Legal change: Senate bill/ constitutional amendment Effective year: 2000 Before: No person convicted of a felony could vote After: Ex-felons can apply to have their voting rights restored after five years of completion of their sentences, including time on probation or parole. Exceptions: Persons convicted of murder, sex offenses, and federal bribery. Classification: Full ban before 2000; partial ban 2000 and after
New Mexico Legal change: Senate bill Effective year: 2001 Before: No person convicted of a felony could vote (unless pardoned) After: Ex-felons have their voting rights restored automatically after completion of their sentences, including time on probation or parole Classification: Full ban before 2001; no ban 2001 and after
Background: As of early 2000, Delaware did not allow any person convicted of a felony to vote. Critics of the practice pointed to statistics showing that the restriction barred one in five African-American men in Delaware from voting. In January 2000, Democratic Senator Margaret Henry proposed a bill that would end the restriction by granting voting rights to ex-felons convicted of lesser crimes after five years of completion of their sentences, including time on probation and parole. On June 28, 2000, by a 16-to-5 vote in the Senate, Delaware amended the state’s constitution restoring the right to vote for the group of individuals described in the bill. At the time, there were 20, 500 convicted felons in the state. The bill did not require Governor Tom Carper’s signature as it was a constitutional amendment. A companion bill also required that individuals applying to have their rights restored show they had paid all court-ordered fines and restitution. The amendment did not pass without criticism. According to Democratic Senate President Tom Sharp, the law allows “a whole host of people who commit heinous crimes who now we’re going to say, ‘Oh, that’s OK, we’re going to let you vote.’ ” However, a coalition of civic organizations, evangelical Christians, and labor union activists was able to overcome the opposition, leading to the bill’s passage. (Sources: S40, S41.) Background: Before 2001, New Mexico did not allow any person convicted of a felony to vote unless the person received a pardon. New Mexico ranked seventh among all states in the number of disenfranchised voters, despite having only four percent of the U.S. population. Among black voters, a total of 24.1 percent were disenfranchised. Hispanics and Native Americans were also disproportionately affected by felony voter bans. For example, while Hispanics made up 40 percent of the population, they constituted 60 percent of the state’s prisoners. It was estimated that 50, 000 New Mexicans were barred from voting because of the state’s felony ban. In March 2001, the New Mexico state legislature adopted Senate Bill 204, sponsored by Senate President Richard Romero, which repealed the lifetime ban on ex-felon voting. Republican Governor Gary Johnson signed the bill into law allowing both state and federal felons to register to vote after serving their prison terns and all conditions of probation or parole. The law went into effect on July 1, 2001. (Sources: S3, S20, S28, S39.)
21
Table 5: Changes in ex-felon voting restrictions by state (continued). Alabama Legal change: House bill Effective year: 2003 Before: No person convicted of a felony could vote (unless pardoned) After: Ex-felons can apply to have their voting rights restored after completion of their sentences, including time on probation or parole. No pardon required. Exceptions: Persons convicted of murder, rape, treason, possession of pornography with intent to distribute. Classification: Full ban before 2003; partial ban 2003 and after
Nevada Legal changes: Assembly bills Effective years: 2001, 2003 Before 2001: No person convicted of a felony could vote 2001–2002: Persons convicted of a felony could petition parole board for restoration of voting rights, but the process was ineffective 2003 and after: Ex-felons have their voting rights restored automatically after completion of their sentences for first-offense, nonviolent crimes. Petition process is required for other ex-felons.
Background: Prior to 2003, felons in Alabama had to apply to the state parole board in order to have their voting rights reinstated after completing their sentence. The process involved seeking a pardon and could take several years. In May 2003, Democratic State Representative Yvonne Kennedy sponsored a bill that would automatically restore the voting rights of ex-felons convicted of lesser crimes after completing their sentences, including any time on parole or probation, and paying all fines and restitution. The House voted for the bill with a 56-to-46 majority and it passed the Senate 21-to-9. However, in June 2003, Governor Bob Riley vetoed the bill, stating he was opposed to automatically restoring voting rights to ex-felons, and “the burden should remain on those ex-felons who are truly serious about having their rights reinstated.” Alabama Republican Party Chairman Marty Connors went further, stating that “we’re opposed to [restoring voting rights] because felons don’t tend to vote Republican.” The veto was widely criticized by groups such as the National Campaign to Restore Voting Rights in a state where 14 percent of African-Americans were disenfranchised because of felony convictions, compared to the statewide average of 6 percent for all racial groups. Governor Riley and AfricanAmerican legislators eventually agreed on a compromise bill to streamline the restoration of voting rights of ex-felons. Ex-felons would still have to apply to the Board of Pardons and Paroles; however, the process would only take 60 days and would no longer require seeking a pardon. The compromised bill passed the House 47-to-42 and the Senate 21-to-11 in September 2003. Governor Riley signed the bill into law the following month. (Sources: S18, S19, S24, S29, S30, S32, S35, S38.) Background: Pior to 2001, Nevada permanently denied felons the right to vote. In 2001, the Nevada legislature passed Assembly Bill 328, which allowed ex-felons to petition the state parole board to have their voting rights restored. However, in a meeting of the Assembly Judiciary Committee in March 2003, Democratic Assemblywoman Chris Giunchigliani (a co-sponsor of AB 328) described the new process as ineffective and argued that Nevada should follow the national trend of easing the restoration process. In April 2003, the Nevada Assembly voted 32-to-10 to pass AB 337, and in late May 2003, a modified bill, AB 55, passed the Senate. The legislation automatically restored the voting rights of those convicted of first-time nonviolent crimes after completion of their sentences. Repeat offenders and anyone committed of violent crimes would still have to petition the state to have their voting rights restored. Republican Governor Kenny Guinn signed the legislation into law. (Sources: S22, S23, S31, S42.)
Classification: Full ban before 2003; partial ban 2003 and after
22
Table 5: Changes in ex-felon voting restrictions by state (continued). Wyoming Legal change: Senate bill Effective year: 2003 Before: Convicted felons could appeal to governor to have their voting rights restored, but were unlikely to be successful After: Ex-felons can apply to parole board to have their voting rights restored five years after completion of their sentences, including time on probation or parole, as long as they had no further convictions.
Background: Prior to 2003 Wyoming permanently denied exfelons the right to vote. Convicted felons could appeal to the governor to have their voting rights restored, however, according to Democratic State Senator Keith Goodenough such appeals were unlikely to succeed under former Republican Governor Jim Geringer’s administration. Senate File 65 would allow felons convicted of nonviolent offenses to apply to the parole board to have their voting rights reinstated five years after completing their prison sentence or probation, as long as they had not been convicted of any additional felonies. The Senate Judiciary committee supported the bill on a 4-to-1 vote and Democratic Governor David Freudenthal signed it into law in March 2003. (Sources: S4, S5.)
Classification: Full ban before 2003; partial ban 2003 and after Florida Legal change: Court order, executive action Effective year: 2004 Before: Persons convicted of a felony could petition the state for restoration of voting rights, but the process was lengthy, arbitrary, and unlikely to result in restoration After: Immediate restoration of voting rights of eligible felons released between 2992 and 2001. Automatic restoration for those convicted of minor crimes after five years of completion of sentence, including time on probation and parole. Restoration of the rights of any felon who is crime-free for 15 years. Classification: Full ban before 2004; partial ban 2004 and after
Background: In 2003, Florida ex-felons were required to complete a “Restoration of Civil Rights” application, and only the governor and the Executive Clemency Board had the power to restore a convict’s voting rights. After the contested 2000 presidential election, a group of African-American legislatures and the ACLU filed suit on behalf of the estimated 614, 000 Floridians who had completed their sentences but were ineligible to vote. The court ordered the Department of Corrections to assist approximately 125, 000 ex-felons who were released between 1992 and 2001 in applying for rights restoration. In June 2004, Republican Governor Jeb Bush announced the state had deemed 22, 000 of these ex-felons eligible for restoration of voting rights without a hearing (the remainder was found in other categories, including those in prison, deceased, or who already had their rights restored). Only felons who committed non-serious crimes were granted clemency without a hearing. Following the election in November 2004, Republican Attorney General Charlie Crist announced that the state was considering allowing some felons who had committed minor crimes to automatically get their voting rights restored without going through the full clemency process. Finally, at a meeting of the Executive Clemency Board, Bush and the elected cabinet officials approved three major changes: First, eliminate some factors that automatically disqualify a felon from requesting clemency without a hearing (such as denial of a previous clemency petition); second, automatically restore the rights of felons who have not committed a crime for five years unless they were convicted a specific violent crime; third, automatically restore the rights of any felon who is crime-free for 15 years. (Sources: S8, S10, S14, S21, S27, S34, S37.)
23
Table 5: Changes in ex-felon voting restrictions by state (continued). Iowa Legal changes: Executive orders Effective years: 2005 (restoration); 2011 (rescission) Before 2005: No person convicted of a felony could vote (unless pardoned) 2005–2010: Automatic restoration after completion of sentence, including time on probation and parole 2011 and after: No person released from prison, parole, or probation after 2010 could vote (unless pardoned) Classification: Full ban before 2005; no ban 2005–2010; partial ban 2011 and after
Nebraska Legal change: Legislative bill Effective year: 2005 Before: No person convicted of a felony could vote (unless pardoned) After: Automatic restoration two years after completion of sentence, including time on probation and parole Classification: Full ban before 2005; partial ban 2005 and after
Background: Prior to 2005, any person in Iowa convicted of an “infamous crime” was banned from voting; these crimes included felonies and aggravated misdemeanors. The only method of restoring voting rights was by the lengthy process of petitioning the governor and requesting executive clemency. For example, between taking office in 2001 and 2005 Democratic Governor Tom Vilsack restored the voting rights of 2, 100 exfelons, while an estimated 80, 000 ex-felons were banned from voting, including one out of every four African-American men in Iowa. In June 2005, Governor Vilsack announced he would sign an executive order to restore voting rights to all convicted felons who had completed their sentences, including any time on parole or probation, stating: “When you’ve paid your debt to society, you need to be reconnected to society.” Governor Vilsack signed the order on July 5, 2005. While payment of restitution and court fees were originally part of the restoration process, Governor Vilsack dropped that requirement. Muscatine County Attorney Gary Allison filed an unsuccessful lawsuit challenging the executive order. In 2011, Republican Governor Terry Branstad signed an executive order rescinding Governor Vilsack’s automatic process of granting voting rights to felons. Convicted felons would again need to petition the governor to have their rights restored. However, the rescission would not affect the voting rights of those who already had their voting rights restored, and would restrict the voting rights of future released convicts. (Sources: S7, S11, S12, S13, S17, S33, S36, S45, S46.) Background: Prior to 2005, all persons with felony convictions were prohibited from voting in Nebraska unless they were able to secure a pardon, which generally was not approved until ten years after a prison sentence was completed. In 2003, the Pardons Board only issued 69 pardons, while estimates of the size of Nebraska’s ex-felon population varied from 9, 000 to 53, 000 according to former Secretary of State John Gale. Similarly, according to the Sentencing Project, an advocacy group for exconvicts, while approximately 44, 000 ex-felons were potentially eligible for voting rights restoration, only 343 had their rights restored. In 2005, State Senator DiAnna Schimek sponsored Legislative Bill 53, which would restore ex-felons’ voting rights two years after completion of their sentence. Republican Governor Heineman opposed the bill, stating that restoring felons’ voting rights was unfair to the victims of their crimes. The legislation passed in the Nebraska legislature in March 2005. Governor Heineman vetoed the bill, stating, “I firmly believe that any restoration of rights should be considered thoughtfully on a case-by-case basis, which is precisely what occurs under our state’s current constitutional process.” However, the legislature overrode the veto with a 36-to-11 margin and the bill became law on June 2, 2005. (Sources: S1, S6, S16, S25, S26.)
24
Table 5: Changes in ex-felon voting restrictions by state (continued). Maryland Legal changes: House, Senate bills Effective years: 2002, 2007 Before 2002: Persons convicted twice permanently lost right to vote 2002–2006: Tiered approach to voting rights restauration 2007 and after: Automatic restoration after completion of sentence Classification: Partial ban before 2007; no ban 2007 and after
Background: Before 2002, persons convicted of a felony twice permanently lost their right to vote in Maryland. In 2002, the state replaced this restriction with a tiered approach: Persons convicted of one “infamous crime” (including such categories as fraud and corruption) could register to vote after completing their sentence; those convicted of two or more nonviolent crimes could register to vote three years after completion of their sentences; any felon convicted of violent crime twice was permanently barred from voting. In 2006, Democratic Assembly Delegate Salima Siler Marriott first sponsored a measure to give all former felons the right to vote as soon as they were released; however, the proposed legislation was heavily opposed by Republican Governor Robert Ehrlich. In February 2007, a House bill was introduced that would allow all first-time offenders to vote immediately after release from prison, and a Senate bill was introduced that would remove the waiting time for second-time offenders. In March 2007, the House bill passed on a 78-to-60 vote and the Senate bill passed on a 28-to-19 vote. In April 2007, Democratic Governor Martin O’Malley signed SB 488 and HB 554, which restored the right to vote for all felons after completing their sentences. Advocates said that more than 50, 000 Marylanders would be eligible to vote as a result of the legislation. (Sources: S2, S9, S15, S43, S44.)
Sources S1: “Developments on the 38th Day of the First Session of the 99th Nebraska State Legislature, Thursday, March 3, 2005.” The Associated Press State & Local Wire, March 3, 2005. S2: “Bill Restoring Felon Voting Rights Closer to Final Passage.” The Associated Press State & Local Wire, March 23, 2007. S3: Baker, Deborah. “Means’ Felony Conviction Could be Legal Hurdle in Bid for Governor.” The Associated Press State & Local Wire, May 29, 2001. S4: Bates, Suzanne. “Bill Reinstates Felons’ Right to Vote.” The Associated Press State & Local Wire, January 29, 2003. S5: Bates, Suzanne. “Governor Signs Voting Rights for Felons Bill.” The Associated Press State & Local Wire, March 5, 2003. S6: Bauer, Scott. “Pardons Board Considers Restoring Voting Rights to Felons.” The Associated Press State & Local Wire, September 30, 2004. S7: Beaumont, Thomas. “Secretary of State Urges Branstad to Rescind Rule on Iowa Felons’ Voting Rights.” Des Moines Register, January 13, 2011. S8: Bousquet, Steve. “State Eases Clemency Process.” St. Petersburg Times, December 10, 2004. S9: Brewington, Kelly. “Rally Seeks Vote for More Ex-offenders.” The Baltimore Sun, January 17, 2006. S10: Flemming, Paul. “55 Felons Get Rights Restored.” Florida Today, June 18, 2004. S11: Foley, Ryan. “Iowa Law Restricting Felons’ Voting May Impact Race.” The Associated Press State & Local Wire, July 23, 2004.
25
S12: Glover, Mike. “Iowa Gov. to Restore Felons’ Voting Rights.” Associated Press Online, June 17, 2005. S13: Glover, Mike. “Judge Rules in Governor’s Favor on Felon Voting Rights.” The Associated Press State & Local Wire, October 28, 2005. S14: Goodnough, Abby. “Florida Reports Progress In Re-enfranchising Felons.” The New York Times, June 18, 2004. S15: Green, Andrew. “Felons Gain Right to Vote.” The Baltimore Sun, April 25, 2007. S16: Hicks, Nancy. “Senators Applaud Legislative Actions.” Lincoln Journal Star, March 3, 2005. S17: “Our View—State Shouldn’t Mess Around with Voting Rights.” Iowa City Press-Citizen, January 8, 2011. S18: Johnson, Bob. “House Passes Bill to Give Former Felons Voting Rights.” The Associated Press State & Local Wire, May 6, 2003. S19: Johnson, Bob. “Felon Voting Rights Included in Parole Expansion Bill.” The Associated Press State & Local Wire, September 17, 2003. S20: Katz, Jesse. “For Many Ex-cons, Ban in Voting Can Be for Life.” Los Angeles Times, April 2, 2000 S21: Kennedy, John. “20,000 Felons May Get to Vote Nov. 2.” Orlando Sentinel, June 18, 2004. S22: Kieckhefer, Ben. “Nevada Bill Would Help Restore Felons’ Civil Rights.” The Associated Press State & Local Wire, March 26, 2003. S23: Kieckhefer, Ben. “Nevada Assembly OK’s Bill Restoring Felons’ Rights.” The Associated Press State & Local Wire, April 21, 2003. S24: Krajick, Kevin. “Why Can’t Ex-Felons Vote?” The Washington Post, August 18, 2004. S25: “Legislature 2005.” Lincoln Journal Star, February 15, 2005. S26: “Speedy Return of Voter Rights to Ex-cons.” Lincoln Journal Star, February 22, 2005. S27: “Coalition Aims to Restore Voting Rights of Disenfranchised Ex-felons.” Miami Times, March 26, 2003. S28: Rapoport, Miles. “Restoring the Vote.” The American Prospect, August 13, 2001. S29: Rawls, Phillip. “Voter ID, Felon Voting Rights Pass Alabama Legislature.” The Associated Press State & Local Wire, June 16, 2003. S30: Rawls, Phillip. “Legislature Passes Parole Acceleration, Felon Voting Bill.” The Associated Press State & Local Wire, September 17, 2003. S31: Pearson, Ryan. “Senate Bill Gives Voting Rights to Nevada Ex-felons.” The Associated Press State & Local Wire, May 16, 2003. S32: Robinson, Lori. “Alabama Felony Voting Rights Included in Parole Expansion Bill.” The Associated Press State & Local Wire, June 24, 2003. S33: Roos, Jonathan. “Felons to Gain Vote Right Today.” Des Moines Register, July 4, 2005. S34: Royse, David. “Easier Restoration of Felons’ Civil Rights Picking up Steam.” The Associated Press State & Local Wire, November 24, 2004. S35: “Alabama Moves Forward: Governor Signs Felons’ Voting Bill Into Law.” Speakin’ Out News, October 14, 2003. S36: “Branstad Signs Two Executive Orders.” State News Service, January 14 14, 2011. S37: St. John, Paige. “Felons Seek Voting Rights.” Florida Today, June 17, 2004.
26
S38: “Riley Kills Bill.” The Montgomery Advertiser, June 30, 2003. S39: The Sentencing Project. Legislative Changes on Felony Disenfranchisement, 1996–2003. September 2003. S40: Thorne, Christopher. “Delaware Nearing Amendment to Allow Ex-Felon Voting.” The Associated Press State & Local Wire, January 15, 2000. S41: Thorne, Christopher. “Bill Granting Felons Right to Vote Passes Through Legislature.” The Associated Press State & Local Wire, June 28, 2000. S42: Vagins, Deborah and Erika Wood. “The Democracy Restoration Act: Addressing A Centuries-Old Injustice.” American Constitution Society for Law and Policy Issue Brief. March 2010 (p. 14). S43: Wiggins, Ovetta. “Advocates Urge O’Malley to Back Restored Rights.” The Washington Post, February 20, 2007. S44: Wyatt, Kristen. “Felon Voting Sets up Another Clash between Ehrlich, Lawmakers.” The Associated Press State & Local Wire, February 17, 2006. S45: Yepsen, David. “Why Restore Voting Rights to Felons? To Win Elections.” Des Moines Register, June 21, 2005. S46: Zernike, Kate. “Iowa Governor Will Give Felons the Right to Vote.” The New York Times, June 18, 2005.
27
References [1] Abramowitz, Alan, Brad Alexander, and Matthew Gunning (2006). “Incumbency, Redistricting, and the Decline of Competition in U.S. House Elections.” Journal of Politics 68, 75–88. [2] Behrens, Angela (2004). “Voting—Not Quite a Fundamental Right? A Look at Legal and Legislative Challenges to Felon Disenfranchisement Laws.” Minnesota Law Review 89, 231–275. [3] Burch, Traci (2011). “Turnout and Party Registration Among Criminal Offenders in the 2008 General Election.” Law & Society Review 45, 699–730. [4] Burch, Traci (2012). “Did Disfranchisement Laws Help Elect President Bush? New Evidence on the Turnout Rates and Candidate Preferences of Florida’s Ex-Felons.” Political Behavior 34, 1–26. [5] Diermeier, Daniel, Michael Keane, and Antonio Merlo (2005). “A Political Economy Model of Congressional Careers.” American Economic Review 95, 347–373. [6] Haselswerdt, Michael (2009). “Con Job: An Estimate of Ex-Felon Voter Turnout Using Document-Based Data.” Social Science Quarterly 90, 262–273. [7] Hjalmarsson, Randi and Mark Lopez (2010). “The Voting Behavior of Young Disenfranchised Felons: Would They Vote if They Could?” American Law and Economics Review 12, 265–279. [8] Meredith, Marc and Michael Morse (2015). “The Politics of the Restoration of Ex-Felon Voting Rights: The Case of Iowa.” Quarterly Journal of Political Science 10, 41–100. [9] Miles, Thomas (2004). “Felon Disenfranchisement and Voter Turnout.” The Journal of Legal Studies 33, 85–129. [10] P´erez, Myrna, Thomas Lopez, and Vishal Agraharkar. “The Sustained Momentum and Growing Bipartisan Consensus for Voting Rights Restoration.” Brennan Center for Justice, New York University School of Law (July 6, 2015). www.brennancenter.org/analysis/sustainedmomentum-and-growing-bipartisan-consensus-voting-rights-restoration. [11] Shannon, Sarah, Christopher Uggen, Melissa Thompson, Jason Schnittker, and Michael Massoglia (2010). “Growth in the U.S. Ex-Felon and Ex-Prisoner Population, 1948 to 2010.” Working paper, Princeton University. [12] Uggen, Christopher and Jeff Manza (2002). “Democratic Contraction? Political Consequences of Felon Disenfranchisement in the United States.” American Sociological Review 67, 777–803. 28
[13] Uggen, Christopher and Jeff Manza (2006). Locked Out: Felon Disenfranchisement and American Democracy. Oxford, UK: Oxford University Press. [14] Uggen, Christopher, Jeff Manza, and Sarah Shannon. “State-Level Estimates of Felon Disenfranchisement in the United States, 2010.” The Sentencing Project (July 2012). www.sentencingproject.org/wp-content/uploads/2016/01/State-Level-Estimates-ofFelon-Disenfranchisement-in-the-United-States-2010.pdf. [15] Weaver, Vesla and Amy Lerman (2010). “Political Consequences of the Carceral State.” American Political Science Review 104, 1–17. [16] Ziegler, Reuven (2011). “Legal Outlier, Again? U.S. Felon Suffrage: Comparative and International Human Rights Perspectives.” Boston University International Law Journal 29, 197–266.
29