Geochimica et Cosmochimica Acta, Vol. 66, No. 18, pp. 3225–3234, 2002 Copyright © 2002 Elsevier Science Ltd Printed in the USA. All rights reserved 0016-7037/02 $22.00 ⫹ .00
Pergamon
PII S0016-7037(02)00933-X
Tooth enamel mineralization in ungulates: Implications for recovering a primary isotopic time-series BENJAMIN H. PASSEY* and THURE E. CERLING Department of Geology and Geophysics, University of Utah, Salt Lake City, UT 84112, USA (Received September 10, 2001; accepted in revised form April 26, 2002)
Abstract—Temporal changes in the carbon and oxygen isotopic composition of an animal are an environmental and behavioral input signal that is recorded into the enamel of developing teeth. In this paper, we evaluate changes in phosphorus content and density along the axial lengths of three developing ungulate teeth to illustrate the protracted nature of mineral accumulation in a volume of developing enamel. The least mature enamel in these teeth contains by volume about 25% of the mineral mass of mature enamel, and the remaining 75% of the mineral accumulates during maturation. Using data from one of these teeth (a Hippopotamus amphibius canine), we develop a model for teeth growing at constant rate that describes how an input signal is recorded into tooth enamel. The model accounts for both the temporal and spatial patterns of amelogenesis (enamel formation) and the sampling geometry. The model shows that input signal attenuation occurs as a result of time-averaging during amelogenesis when the maturation interval is long compared to the duration of features in the input signal. Sampling does not induce significant attenuation, provided that the sampling interval is several times shorter than the maturation interval. We present a detailed ␦13C and ␦18O record for the H. amphibius canine and suggest possible input isotope signals that may have given rise to the measured isotope signal. Copyright © 2002 Elsevier Science Ltd maturation, such that each finite volume of enamel contains a time-averaged isotopic record? This question was answered by von Ebner (1906), who showed that enamel is not fully mineralized when it is first formed, as had been proposed by Ko¨lliker (1867) (see Allan, 1967). Numerous subsequent studies have shown that the amelogenesis involves the initial deposition of a mineral-poor, protein-rich, hydrated matrix, followed by a phase (or phases) of prolonged mineral accumulation (Robinson et al., 1974; Hiller et al., 1975; Robinson et al., 1978, Robinson et al., 1987, Robinson et al., 1988; Aoba and Moreno, 1990). The implication for those seeking to extract meaningful isotopic signals from tooth enamel is that significant time-averaging of the signals occurs, so the pattern of isotopic variation encoded into tooth enamel will be attenuated compared to the true pattern of isotopic variation experienced by the animal. The problem of solving a measured series of isotopic data d for the true input series m will involve two distinct tasks. The first will be to develop a function or set of functions A that describe(s) how the input series m is transformed into the measured series d as a result of amelogenesis and laboratory sampling. A will be a case-specific relationship that depends on the spatial and temporal pattern of amelogenesis of the tooth being studied and on the specific sampling geometry utilized. The second task will be to use inversion methods to solve for the input series m using the measured series d and the attenuation function A. In this paper, we focus on the development of a set of functions A for a Hippopotamus amphibius canine that is continuously growing at a constant growth rate. This model is in a general form and can be applied to other teeth growing at steady state simply by substituting appropriate parameters. We are currently developing the inversion methods necessary to recover a quantitative estimate of the input series m given knowledge of d and A.
1. INTRODUCTION
The carbon and oxygen isotopic composition of the body is permanently archived into newly formed tooth enamel, which mineralizes from crown to root over a finite period of time that varies among species and between different teeth of a single species. This means that high-crowned teeth preserve along their lengths an isotopic time-series of dietary and environmental change. Stable isotopes in tooth enamel are resistant to diagenesis (Lee-Thorpe and van der Merwe, 1987; Quade et al., 1992; Bocherens et al., 1996; Zazzo et al., 2000; Cerling et al., 2001), so well-preserved teeth may hold an ancient record of temporal variation. The potential ability to extract from the distant past a single week, month, or year is tantalizing, and many have begun to use this method to study ancient seasonal variations in climate and animal behavior (Fricke and O’Niel, 1996; Fricke et al., 1998a, b; Kohn et al., 1998; Sharp and Cerling, 1998; Gadbury et al., 2000; Fox and Fisher, 2001). Although several studies have presented intratooth isotopic records, the geological and archeological literature contains little discussion of the process of enamel formation relevant to isotopes, or of time-averaging that might occur between the initial deposition of enamel matrix and the final curing of the matrix into well crystallized enamel. Fisher and Fox (1998) called attention to these concerns and showed that the enamel isotopic record in a mammoth molar was attenuated and perhaps temporally shifted compared to the dentine record of a tusk from the same individual. Does enamel mature shortly after being deposited, such that orientation of depositional laminae faithfully records the geometry of enamel mineralization, or is there a period of gradual * Author to whom correspondence should be addressed (bpassey@ mines.utah.edu). 3225
3226
B. H. Passey and T. E. Cerling
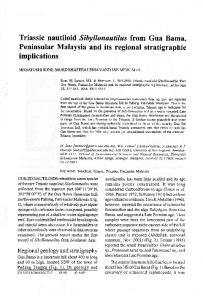
Fig. 1. (a) Schematic diagram of a H. amphibius canine. (b) Enlarged oblique cross-sectional view of the zone of enamel formation, showing the surface of apposition and the enamel-dentine junction (EDJ). Note the angle that the surface of apposition makes with the EDJ is greatly exaggerated in this figure.
2. MATERIAL AND METHODS
Eisenmann (1985) provides a detailed description of the process of amelogenesis.
2.1. Background-Geometry of Apposition 2.2. Experimental Procedure Enamel matrix is secreted by specialized cells called ameloblasts. These columnar cells are packed together and face a surface of enamel apposition that, during the initial stages of crown formation, is oriented roughly parallel to the enamel-dentine junction (EDJ). As tooth formation proceeds, and in high-crowned teeth the columnar portion of the tooth begins to form, the surface of apposition becomes inclined relative to the EDJ (Fig. 1). Enamel matrix continues to be accreted at an angle to the EDJ for the remainder of accretion, and successive positions of the appositional surface are marked by growth lines, including brown striae of Retzius that are visible in thin section.
We studied three teeth that were still developing at the time of death; an H. amphibius canine from Arabuko-Sokoke National Park, Kenya, a bison (Bison bison) lower first molar from Antelope Island, Utah, and a domestic bovid (Bos taurus) lower first molar from the Animal Science department at Brigham Young University, Utah. The experimental procedure was similar to that outlined in Hiller et al. (1975). A strip of enamel and underlying dentine was cut from each tooth using a diamond saw. This strip ran the length of the B. bison and B. taurus molars and included the zone of mineralization in the ever-growing H.
Isotopic attenuation during tooth enamel maturation
3227
amphibius canine. Segments of enamel were carefully excavated from the dentine using a scalpel or hand-held drill (in the case of wellmineralized samples) under a binocular microscope, and the volumes of the removed enamel were calculated geometrically. The estimated uncertainty of each length dimension was 0.1 mm, so a typical sampling volume of 4 ⫻ 2 ⫻ 1 mm had a volumetric uncertainty of 0.17 mm3, or ⬃2.15%. Excavated enamel was carefully recovered over large sheets of weighing paper (⬎ 99% recovery), so that accurate density and volumetric phosphorus measurements could be made. The enamel was dried for several hours at 50°C before weighing for density calculations. Attempts to measure density using heavy liquids failed because the immature enamel absorbed the liquid, such that the density estimate was not a true volumetric density that accounts for pore volume. Phosphorus was determined using the spectrophotometric method of Chen et al. (1956), and standard deviations of repeated measurements were 1.0 to 1.5 wt.%. Phosphorus is used as an indicator of Ca5(PO4)3OH (hydroxyapatite) content. It is possible that some of the P is not in this mineral phase, so our P-based mineral estimates represent upper limits of mineral content. Hiller et al. (1975) showed that the Ca/P ratio in developing rat incisors is constant within limits of measurement, suggesting that most of the P in immature enamel resides in hydroxyapatite. The H. amphibius and B. bison teeth were exposed to weathering, whereas the B. taurus tooth was freshly dissected. It is likely that some of the amelogenic protein component of these teeth was lost during weathering, and this notion is supported by the discrepancy in density data between these teeth and the B. taurus tooth (Fig. 2). Such losses do not affect the phosphorus data because they are expressed relative to volume and not relative to mass. Carbon and oxygen isotope ratios were measured at the University of Utah using a Finnegan MAT 252 mass spectrometer coupled to a Finnegan Carboflo common acid bath device operated under positive helium pressure with the acid bath held at 90°C. 3. RESULTS
Immature enamel was soft and could be easily scraped from the underlying dentine using a scalpel. In contrast, fully mineralized enamel was extremely difficult to excavate using a scalpel and resulted in microscale deformation of the steel blade. The data presented in Figure 2 reflect this difference in mineral content. The results are consistent with findings reported in the dental literature (e.g., Hiller et al., 1975; Robinson et al., 1978) and show the following patterns: 1. Mineral content increases across a large portion of each tooth and continues to increase after the full thickness of the enamel has been deposited. 2. The most immature enamel contains a fraction of the mineral content of fully mineralized enamel (24.6 ⫾ 2.2% [1]; this is the average value of the proximal H. amphibius sample, the proximal B. bison sample, and the proximal six samples from the B. taurus tooth). In addition to these observations, it is apparent that the geometry of mineralization varies among the three teeth. In H. amphibius, mineralization proceeds in a fairly straightforward linear pattern, except for a short pause of unknown significance at ⬃40 mm. The increase in mineral content in this tooth was spatially diffuse, in that we did not observe a distinct maturation horizon across which mineral content rapidly increased from that of immature enamel to that of mature enamel. In B. taurus, there is a delay between initial matrix deposition and the onset of mineral-content increase, such that additional mineralization does not occur during the time between initial deposition and the reaching of the final enamel thickness. In B. bison, a similar delay is indicated, and maturation appears to take on a more complex geometry. In both the B. bison and B.
Fig. 2. Variation in phosphorus and density across the mineralizing zones in (a) H. amphibius, (b) B. taurus, and (c) B. bison teeth and changes in overall enamel thickness. Percent final P and percent final density refer to the mass of phosphorus per volume of enamel, and density, relative to fully mineralized enamel.
taurus specimens, there was some indication of a maturation horizon across which mineral content changed rapidly. The sampling protocol was not adequate to deduce the nature or
3228
B. H. Passey and T. E. Cerling
Fig. 3. Explanation of some parameters used in Eqns. 1, 2, and 3. These are cross-sections of enamel that are perpendicular to the thickness of the enamel and parallel to the long axis of the tooth. In (a), volume i is receiving its last portion of mineral tissue of composition ␦mi⫹lm, while volume i⫹lm is newly forming with the same composition (see text). In (b), volume i is newly forming, while volume i-lm (not shown) is receiving its last mineral tissue.
geometry of this possible maturation horizon. The geometry of bulk maturation appears to evolve throughout the formation of determinate (that is, not ever-growing) teeth (Robinson et al., 1978, Robinson et al., 1988). In contrast, indeterminate (evergrowing) teeth should approach steady-state growth, where the zones of apposition and maturation are of constant spatial dimension. Hiller et al. (1975) documented the increase in mineral content across the maturation zone of rat incisor enamel. The individuals studied (n ⱖ 13) showed nearly identical patterns of mineral accumulation, indicating that the spatial dimensions of maturation are largely conservative.
stant appositional length la, constant maturation length lm, linear increase in mineral content over the distance lm, and with a constant growth rate, so that time and distance along the tooth can be interchanged (Fig. 3a). Each volume i is oriented parallel to the appositional surface and has an initial isotopic composition ␦mi, which represents the isotopic composition of the body during initial enamel deposition, and an initial mineral content of fi. For the teeth studied here, fi is 0.25, representing a mineral content of 25% that of fully mineralized enamel. Each volume i receives the remaining fraction of mineral 1-fi linearly over the distance lm (and over its time-equivalent). The model can be expressed mathematically as the following:
4. MODELING
冘
i⫹1⫹lm
4.1. Model Development 4.1.1. Attenuation during amelogenesis In this section, we present a simple model that describes the attenuation of isotopic signals into enamel of teeth with con-
␦ ei ⫽ 共 f i * ␦ mi兲 ⫹ 共1 ⫺ f i兲 *
n⫽i⫹1
lm
␦ mn (1)
where ␦ei is the isotope ratio of fully mineralized enamel and
Isotopic attenuation during tooth enamel maturation
when lm is a multiple of i. In the case of the H. amphibius canine, 25% of the mineral in each i reflects the isotopic composition of the body at the time of initial matrix deposition, and the remaining 75% mineral reflects the average isotopic composition of the body during the time represented by lm. This model assumes that there is no angular disparity between the appositional front and the maturation front. A spreadsheet is used to calculate each ␦ei along the length of a tooth. The most important implication of this model is that the time represented by lm should be much shorter than the duration of the signal that is being studied to directly recover the full magnitude of that signal. Figure 4a shows the case where the input isotope ratio changes as sine and square waves of duration t⌬. For the square wave, full recovery of the isotope amplitude is possible when the duration of the isotope change t⌬ is greater than the maturation time (t⌬ ⬎ lm), whereas the full amplitude of the isotope change cannot be measured even at the most detailed sampling interval when the input wave is sinusoidal and for square waves when the maturation interval is longer than the isotope change (t⌬ ⬍ lm). 4.1.2. Attenuation during sampling
冘 i
␦ en
(2)
n⫽i⫺la
where ␦ci is the isotope ratio of each column. To model the isotope ratio of half or quarter columns, a value of 0.5*la or 0.25*la is used in place of la in Eqn. 2. Using this columnar approach, a variety of sampling strategies can be modeled with the help of a spreadsheet. Various sampling pit lengths ls (the length of the side of a sampling pit that is parallel to the direction of tooth growth) can be modeled simply by averaging different numbers of columns: 1 ␦ di ⫽ ls
1 i⫺1⫹ ls 2
冘
1 n⫽i⫺ ls 2
sampling depth does not greatly change the observed pattern of isotopic variation in the case of lm ⫽ 0.5t⌬ and slightly modifies the pattern in the lm ⫽ 2t⌬ case. It is also apparent that increasing the sampling depth leads to a proximal-shifting of the entire pattern of variation, such that the pattern of variation in a deeply milled profile is shifted towards the proximal (youngest) end of the tooth relative to that of a shallowly milled profile. Figure 4c shows how different sampling lengths ls affect the measured isotope signal. For the cases where lm ⫽ 0.5t⌬, a reasonable isotopic record is obtained when ls ⫽ 0.5*lm, and a very good record is obtained when ls ⫽ 0.25*lm. In this case, very little additional information will be gained by increasing the sampling resolution beyond ls ⫽ 0.25*lm. For the cases where lm ⫽ 2t⌬, the sampling resolution must be increased to observe the subtle details of the highly attenuated signal. It can be seen that a sampling resolution of ls ⫽ 0.25*lm does not reflect the available signal particularly well, while a resolution of ls ⫽ 0.125*lm does begin to adequately reflect the available signal. In both the lm ⫽ 0.5t⌬ and the lm ⫽ 2t⌬ cases, a general rule holds that good signal recovery will result from sampling resolutions of ls ⱕ 0.25t⌬. 4.2. Application to an Isotope Profile
Figure 4a represents the highest fidelity signal that exists in the tooth enamel for each case, such that no sampling strategy can bring the measured isotope pattern closer to the original input. In light of this, how do various sampling strategies (e.g., laser, micro-milling, hand-held milling) affect the measured isotope signal? To model a strategy where samples are milled parallel to the appositional surface, Eqn. 1 may be used, provided that the thickness of each milled sample corresponds to the thickness of each i. To model other sampling strategies, we consider a column of enamel ic whose upper surface coincides with volume i (Fig. 3b). Each column samples material from the previous i’s going back to i-la. Ignoring the small difference in volume contributed by i and i-la relative to the other i’s, the isotope ratio of each column can be modeled by the following: 1 ␦ ci ⫽ la
3229
␦ cn
(3)
Figure 4b shows the effect of different sampling strategies in the cases of lm ⫽ 0.5t⌬ and lm ⫽ 2t⌬, and the effect of two different sampling depths, sampling the full thickness of enamel (dashed line), and 1/8 thickness of enamel (thin solid line), on each of these cases. It can be seen that increasing the
4.2.1. sampling protocol Carbon and oxygen isotopes were measured along the length of the same H. amphibius canine (Fig. 5). Forty-three samples were milled using a hand-held drill with a cylindrical diamondimpregnated bit. Each sampling volume had an average axial length of slightly less than 10 mm (ls ⫽ 0.15*lm) and a depth of about half the thickness of the enamel (⬃400 m). The appositional length la for this tooth is ⬃15 mm, and evaluation of the data in Figure 2 indicates that the maturation length lm is ⬃65 mm. Each sample volume has an axial length of 0.15*lm, so our model suggests that we can expect good recovery of the isotopic signal that exists in the tooth enamel. In addition to this sampling, we also milled two additional but more-detailed sample series (ls ⫽ 0.062*lm, 0.046*lm) from the distal portion of the tusk using a computer-controlled milling device (Merchantek) that affords a high degree of spatial precision (⫾ 1–20 m, depending on working conditions). These series were milled to determine whether or not additional information could be gained by increasing the sampling resolution and to see if the predicted proximal-shifting due to deeper sampling (Fig. 4b) could be observed. From the results plotted in Figure 6, it is apparent that very little information was gained by increasing the sampling resolution beyond the ls ⫽ 0.15*lm level used for the primary data series in Figure 5. This result is predicted at resolutions ⬎ ls ⫽ 0.125*lm for cases where lm ⱕ 2t⌬ (Fig. 4c). It is also apparent in Figure 6 that a proximal shifting is indeed observed for the 400-m-depth series relative to the 200-m series. The hand-milled series does not display a consistent proximal shift relative to the 200-m series despite its deeper average sample depth. This may relate to the lower precision of this sampling method relative to the micromilling method. 4.2.2. Evaluation of growth rate We evaluated the validity of the constant growth rate assumption for this tusk by measuring the widths of growth
3230
B. H. Passey and T. E. Cerling
increments that are visible on the enamel surface under reflected light. It is well established that the deposition of dental tissues, including enamel, follows a circadian rhythm, and that growth increments can represent daily, weekly, fortnightly, semiannual, and annual periods (Boyde, 1964; Dean, 1987; Bromage, 1991; Fox, 2000). Growth increment widths were measured using digital calipers with the aid of a binocular microscope. Increments were not measured on the proximal and distal ends of the tusk because they were poorly formed (proximal) or worn away (distal). Figure 7 shows that the average increment width for this tusk is slightly less than 2 mm and that there are no significant trends in increment width along the length of the tusk. To the extent that each increment reflects a discrete time interval, these data strongly suggest that this tusk largely grew at a constant rate. We were unable to assign a temporal value to these growth increments.
4.2.3. Input signal Knowing la and lm for this tooth, we use Eqn. 1, 2 and 3 as our attenuation function A. We then create a hypothetical data series m that we transform using A to give synthetic data d. We manipulate the series m and by trial and error, eventually arrive at a series that closely matches the measured data (Fig. 5). For carbon isotopes, we are constrained to using input isotope values that represent those of available vegetation. Using a diet-enamel offset of 14‰ (Cerling and Harris, 1999), the upper-limit input represents a pure C4 diet and has an enamel equivalent of about ⫹1‰, and the lower-limit input represents a diet of pure C3 vegetation with an enamel equivalent of ⫺13‰ or less. We use a simple stepped input that is in compliance with these constraints (thin dashed lines in Fig. 5) and assume very rapid turnover of labile body carbon (CO2, HCO3⫺, CO32⫺). We have observed carbon isotopic shifts of ⬎ 5‰/d in the breath of several taxa (including equids, bovids, camelids, and lagomorphs) as a result of instantaneous dietary changes between C3 and C4 feeds (University of Utah, unpubl. data). Oxygen isotopes are modeled similarly, except that we include a lag in water turnover equivalent to 5% turnover per millimeter of tooth growth. There are no available data on H. amphibius canine growth rate or body water turnover, but Sharp and Cerling (1998); show a turnover rate of ⬃5% per day for large mammals (⬎ 50 kg) based on stable isotope analysis. The hypothetical input series m shown in Figure 5 are possible representations of the original isotope signal that gave rise to the measured isotope signal. The series m do not comprise quantitative or unique solutions, and we are in the process of developing a method to solve for quantitative estimates of m using A and d.
Fig. 4. (a) A model showing how the primary body fluid signal (bold black line) is attenuated during enamel formation when maturation lengths lm are 2, 1, and 0.5 times the length of the primary signal t⌬. (b) Predicted effect of different sampling depths on the lm ⫽ 0.5t⌬ scenario. The primary signal is the bold black line. The result of sampling through 1/8 the thickness of the enamel in the case that la ⫽ 0.25*lm is shown by the thin solid line, and this line is indistinguishable from the highest fidelity signal existing in the enamel for the lm ⫽ 0.5t⌬ scenario
(shown in Fig. 4a). The dashed line represents the result of sampling through the full thickness of the enamel. Note that the deeper sampling strategy results in an apparent proximal shifting of the entire pattern of variation. (c) Predicted effect of different sampling resolutions. The axial length of sampling ls is the length of each sampling pit along the growth axis of the tooth, here represented by the white rectangles. Modeled depth of sampling is 1/8 thickness of enamel, and la ⫽ 0.25*lm as in (b).
Isotopic attenuation during tooth enamel maturation
3231
Fig. 5. Intratooth carbon and oxygen isotopic record from the K00-AS-167 H. amphibius canine. The dashed lines show a pattern of isotopic variation m in the hippo’s body composition that would give rise to a synthetic data d (dashed gray line) similar to the measured enamel signal (circles).
4.2.4. Behavioral and environmental implications Regardless of some ambiguity surrounding our solutions m, it is clear that this hippopotamus supplemented its predominantly C4-based diet with variable amounts of C3 vegetation. Grasses using the C4 photosynthetic pathway are the tropical or warm growing season grasses and at this elevation in Kenya (⬍ 1000 m) account for most of the grass species inventory (⬎97%; see Tiezen et al., 1979; Cerling and Harris, 1999). These grasses have an average carbon isotopic composition of about ⫺13‰, so tooth enamel of animals eating pure C4 vegetation should be about ⫹1‰ (Cerling and Harris, 1999). In contrast, plants using the C3 photosynthetic pathway include the temperate or cool growing season grasses and most dicots
(trees, shrubs, etc.) and have carbon isotopic compositions of about ⫺27‰, so tooth enamel of animals eating pure C3 vegetation should be about ⫺13‰. The data in Figure 5 show that this individual consumed, at times, 50% or more C3 vegetation, which is significantly more than was found in hippos from Queen Elizabeth Park, Uganda during the cullings of the late 1960s (Field, 1970, 1972; Eltringham, 1999). Isotopic results of Bocherens et al. (1996); suggest that Amboseli N.P. hippos sometimes included a C3 component in their diets, and this is also suggested for some Pliocene fossil hippos from Chad (Zazzo et al., 2000). It is uncertain whether this C3 vegetation is in the form of browse (dicotyldons) or graze (monocotyldons). C3 grasses are very rare in the studied Kenyan ecosystems that are at a similar elevations (⬍ 1000 m). The
3232
B. H. Passey and T. E. Cerling
Fig. 6. Measured effect of different sampling strategies on the observed pattern of isotopic variation. The solid black lines are equivalent to the seven distal-most data points shown in Fig. 5. Note the proximal shift of the 400-m-depth samples relative to the 200-m-depth samples. The hand-milled samples are not consistently proximally shifted relative to the 200-m-depth samples, which may be a result of the lower spatial precision of this method relative to the micromilling method. Note that the general features of the data are similar for each sampling strategy.
closest study site to Arabuko-Sokoke N.P. in the tabulation of Tiezen et al. (1979) is Tsavo N.P. (⬃200 km to the west). Here, Tiezen et al. (1979) report that 97% of all grass species are C4 grasses. However, we are unaware of any studies documenting the percentage of C4 grass species within open-canopy forest ecosystems similar to Arabuko-Sokoke N.P. It is possible that these ecosystems contain more C3 grasses than do more open ecosystems. Another possibility is that the large muzzle width of H. amphibius makes it difficult for the animal to selectively avoid C3 forbs such as Indigofera that are commonly distributed among C4 grasses. The animal’s oxygen isotopic composition ranged between ⫺5.3 and ⫺2.7‰ PDB, (25.4 and 28.1 SMOW), equating to a body water composition of ⫺0.9 ⫾ 1.4 to ⫹1.7 ⫾ 1.4‰ SMOW using ␣CO3-H20 ⫽ 1.0263 ⫾ 0.0014 reported in Bryant et al. (1996). Fourteen water samples from the upper TsavoAthi drainage (including Mzima Springs) measure ⫺3.7 ⫾ 1.3‰ SMOW, and a water sample from near the Indian Ocean coast where the animal died had a value of ⫺2.3‰, indicating
that the animal’s body water was probably slightly enriched in O relative to surface waters in which it lived. This is likely because plant water, which is highly evaporated relative to source water (Dongmann et al., 1974), makes up an important component of total body water (Kohn, 1996). Close to the end of its life, the animal’s oxygen isotopic composition increased by ⬃2‰, indicating a change in habitat or water-balance. 18
5. CONCLUSIONS
The process of enamel formation is not analogous to the incremental growth of tree rings, but rather involves a gradual increase of mineral content in each finite volume of enamel. This maturation continues long after the initial deposition of that volume, so the isotope ratio of each volume represents the time-averaged isotope ratio of the body during the time it took for the volume to form. We developed a model A that describes how an animal’s temporal pattern of isotopic variation m is recorded into the enamel of teeth growing at a constant rate,
Isotopic attenuation during tooth enamel maturation
3233
Fig. 7. Cumulative distance of each growth increment from the first measured increment plotted vs. increment number (small squares). The three solid lines correspond to constant increment thickness of 3, 2, and 1 mm.
and how different sampling strategies might influence pattern of variation in the measured signal d. To a large extent, the majority of isotopic attenuation occurs during mineralization rather than during sampling, provided that the length of each sampling interval is several times less than the length of maturation or the length of the isotopic perturbation. This study represents an initial effort at addressing the problem of attenuation of isotopic signals in growing biologic tissues. Several lines of future research exist, including the development of a method for quantitatively solving m, the development of equations A for teeth with non-constant growth-rates and with evolving spatial patterns of amelogenesis, the testing of these equations under controlled conditions, the development and testing of equations A for tissues other than bioapatites, and the application of these methods to ecological and paleontological problems. Acknowledgments—We thank Todd Robinson and Jordan Hammer for the B. taurus specimen, Jim Ehleringer for access to the SIRFER mass spectrometry facility, and Linda Ayliffe and Frank Brown for useful discussions. We greatly appreciate the thorough reviews given by D.C. Fisher, D.L. Fox, and B.J. MacFadden. This research was supported by the Packard Foundation. Associate editor: D. R. Cole REFERENCES Allan J. H. (1967) Maturation of enamel. In Structural and Chemical Organization of Teeth, (ed. A. E. W. Miles) Vol. 1, Academic Press, New York.
Aoba T. and Moreno E. C. (1990) Changes in the nature and composition of enamel mineral during porcine amelogenesis. Calcified Tissue Int. 47, 356 –364. Bocherens H., Koch P. L., Mariotti A., Geraads D., and Jaeger J. J. (1996) Isotopic biogeochemistry (13C, 18O) of mammalian enamel from African Pleistocene homonid sites. Palaios. 11, 306 –318. Boyd E. A. (1964) The structure and development of mammalian enamel, Ph.D. Thesis. University of London. Bromage T. G. (1991) Enamel incremental periodicity in the Pig-Tailed Macaque: A polychrome fluorescent labeling study of dental hard tissues. Am. J. Phys. Anthropol. 86, 205–214. Bryant J. D., Koch P. L., Froelich P. N., Showers W. J., and Genna B. J. (1996) Oxygen isotope partitioning between phosphate and carbonate in mammalian apatite. Geochim. Cosmochim. Acta 60, 5145– 5148. Cerling T. E., Harris J. M., and Leakey M. G. (2001) Isotope paleoecology of the Nawata and Apak Formations, at Lothagam, Turkana Basin, Kenya. In Lothagam: The Dawn of Humanity in Africa (ed. M. G. Leakey J. M. Harris), Columbia Univ. Press (in press). Cerling T. E. and Harris J. M. (1999) Carbon isotope fractionation between diet and bioapatite in ungulate mammals and implications for ecological and paleoecological studies. Oecologia. 120, 247–363. Chen P. S., Toribara T. Y., and Warner H. (1956) Microdetermination of phosphorus. Anal. Chem. 28, 1756 –1758. Dean M. C. (1987) Growth layers and incremental markings in hard tissue: A review of the literature and some preliminary observations about enamel structures in. Paranthropus boisei. J. Hum. Evol. 16, 157–172. Dongmann G., Nurnberg H. W., Forstel H., and Wagener K. (1974) On the enrichment of H2O 18 in the leaves of transpiring plants. Radiat. Environ. Biophys. 11, 41–52. Eisenmann D. R. (1985) Amelogenesis. In Oral Histology (ed. A. R. Ten Cate). Mosby Company, St. Louis. Eltringham S. K. (1999) The Hippos. Academic Press, London.
3234
B. H. Passey and T. E. Cerling
Field C. R. (1970) A study of the feeding habits of the hippopotamus (Hippopotamus amphibious Linn.) in the Queen Elizabeth National Park, Uganda, with some management implications. Zool. Afr. 5, 71– 86. Field C. R. (1972) The food habits of wild ungulates in Uganda by analyses of stomach contents. E. Afr. Wildl. J. 10, 17– 42. Fisher D. C. and Fox D. L. (1998) Oxygen isotopes in mammoth teeth: Sample design, mineralization patterns, and enamel-dentin comparisons. J. Vertebr. Paleontol. 18, 41– 42A. Fox D. L. (2000) Growth increments in Gomphotherium tusks and implications for late Miocene climate change in North America. Palaeogeogr. Palaeocl. 156, 327–348. Fox D. L. and Fisher D. C. (2001) Stable isotope ecology of a late Miocene population of Gomphotherium productus (Mammalia, Proboscidea) from Port of Entry Pit, Oklahoma, USA. Palaios 16, 279 –293. Fricke H. C. and O’Niel J. R. (1996) Inter- and intra-tooth variation in the oxygen isotope composition of mammalian tooth enamel phosphate: Implications for palaeoclimatological and palaeobiological research. Palaeogeogr. Palaeocl. 126, 91–99. Fricke H. C., Clyde W. C., and O’Neil J. R. (1998a) Intra-tooth variations in ␦18O (PO4) of mammalian tooth enamel as a record of seasonal variations in continental climate variables. Geochim. Cosmochim. Acta 62, 1839 –1850. Fricke H. C., Clyde W. C., O’Neil J. R., and Gingerich P. D. (1998b) Evidence for rapid climate change in North America during the latest Palaeocene thermal maximum: Oxygen isotope compositions of biogenic phosphate from the Bighorn Basin (Wyoming). Earth Planet. Sci. Lett. 160, 193–208. Gadbury C., Todd L., Jaren A. H., and Amundson R. (2000) Spatial and temporal variations in the isotopic composition of bison tooth enamel from the early Holocene Hudson-Meng Bone Bed, Nebraska. Palaeogeogr. Palaeocl. 157, 79 –93. Hiller C. R., Robinson C., and Weatherell J. A. (1975) Variations in the composition of developing rat incisor enamel. Calc. Tiss. Res. 18, 1–12. Kohn M. J., Schoeninger M. J., and Valley J. W. (1998) Variability in oxygen isotope compositions of herbivore teeth: Reflections of seasonality or developmental physiology? Chem. Geol. 152, 97–112.
Kohn M. J. (1996) Predicting animal ␦18O: Accounting for diet and physiological adaptation. Geochim. Cosmochim. Acta. 60, 4811– 4829. Ko¨ lliker A. (1867) Handbuch der Gewebelehre des Menschen. Engelmann, Leipzig. Lee-Thorpe J. A. and van der Merwe N. J. (1987) Carbon isotope analysis of fossil bone apatite. S. Afr. J. Sci. 83, 712–715. Quade J., Cerling T. E., Barry J. C., Morgan M. M., Pilbeam D. R., Chivas A. R., Lee-Thorpe J. A., and van der Merwe N. J. (1992) A 16 million year record of palaeodiet from Pakistan using carbon isotopes in fossil teeth. Chem. Geol. 94, 183–192. Robinson C., Hiller C. R., and Weatherell J. A. (1974) Uptake of 32 P-labelled phosphate into developing rat incisor enamel. Calc. Tiss. Res. 15, 143–152. Robinson C., Fuchs P., Deutsch D., and Weatherell J. A. (1978) Four chemically distinct stages in developing enamel from bovine incisor teeth. Caries Res. 12, 1–11. Robinson C., Kirkham J., Weatherell J. A., Richards A., Josephsen K., and Fejerskov O. (1987) Developmental stages in permanent porcine enamel. Acta Anat. 128, 1–10. Robinson C., Kirkham J., Weatherell J. A., Richards A., Josephsen K., and Fejerskov O. (1988) Mineral and protein concentrations in enamel of the developing permanent porcine dentition. Caries Res. 22, 321–326. Sharp Z. D. and Cerling T. E. (1998) Fossil isotope records of seasonal climate and ecology: Straight from the horse’s mouth. Geology 26, 219 –222. Tiezen L. L., Senyimba M. M., Imbamba S. K., and Troughton J. H. (1979) The distribution of C3 and C4 grasses and carbon isotope discrimination along an altitudinal and moisture gradient in Kenya. Oecologia. 37, 337–359. ¨ ber die histologischen Vera¨ nderungen des von Ebner V. (1906) U Zahnschmelzes wa¨ hrend der Erha¨ rtung, insbesondere beim Menschen. Arch. Mikr. Anat. 67, 18 – 81. Zazzo A., Bocherens H., Brunet M., Beauvilain A., Billiou D., Mackaye H. T., Vignaud P., and Mariotti A. (2000) Herbivore paleodiet and paleoenvironmental changes in Chad during the Pliocene using stable isotope ratios of tooth enamel carbonate. Paleobiology. 26, 294 –309.