Subscriber access provided by TECHNICAL UNIV OF DELFT
Letter
Translocation of RecA-Coated Double-Stranded DNA through Solid-State Nanopores R. M. M. Smeets, S. W. Kowalczyk, A. R. Hall, N. H. Dekker, and C. Dekker Nano Lett., Article ASAP • DOI: 10.1021/nl803189k Downloaded from http://pubs.acs.org on January 12, 2009
More About This Article Additional resources and features associated with this article are available within the HTML version: • • • •
Supporting Information Access to high resolution figures Links to articles and content related to this article Copyright permission to reproduce figures and/or text from this article
Nano Letters is published by the American Chemical Society. 1155 Sixteenth Street N.W., Washington, DC 20036
NANO LETTERS
Translocation of RecA-Coated Double-Stranded DNA through Solid-State Nanopores
XXXX Vol. xx, No. x -
R. M. M. Smeets,† S. W. Kowalczyk,† A. R. Hall, N. H. Dekker, and C. Dekker* KaVli Institute of Nanoscience, Delft UniVersity of Technology, Lorentzweg 1, 2628 CJ Delft, The Netherlands Received October 21, 2008; Revised Manuscript Received November 14, 2008
ABSTRACT We report translocation of double-stranded DNA (dsDNA) molecules that are coated with RecA protein through solid-state nanopores. Translocation measurements show current-blockade events with a wide variety in time duration (10-4-10-1 s) and conductance blockade values (3-14 nS). Large blockades (11.4 ( 0.7 nS) are identified as being caused by translocations of RecA-dsDNA filaments. We confirm these results through a variety of methods, including changing molecular length and using an optical tweezer system to deliver bead-functionalized molecules to the nanopore. We further distinguish two different regimes of translocation: a low-voltage regime (<150 mV) in which the event rate increases exponentially with voltage, and a high-voltage regime in which it remains constant. Our results open possibilities for a variety of future experiments with (partly) protein-coated DNA molecules, which is interesting for both fundamental science and genomic screening applications.
Nanopores can be used as single-molecule sensors to detect the passage of DNA, RNA, or proteins. Such charged biomolecules are driven through a nanometer-sized constriction by an applied electric field. Translocation through the nanopore results in a transient current blockade, a consequence of the volume displaced by the passing molecule (see Figure 1). Both biological pores, in particular R-hemolysin, and fabricated nanopores have been used to obtain dynamic and structural information on polynucleotides.1 Proteins were studied by translocation through nanopores2,3 or by sensing DNA-protein rupture where the nanopore acts as a local force actuator to pull the two molecules apart.4-7 Here, we use the recombination protein A (RecA), which is known to form stable nucleoprotein filaments on double-stranded DNA (dsDNA) in the presence of magnesium and ATPγS,8 to investigate translocation of protein-coated DNA. RecA protein plays a central role in homologous recombination and DNA repair in prokaryotes where it catalyzes the pairing of single-stranded DNA with complementary regions of dsDNA. By use of nanopores, the identification of RecAcoated regions along DNA strands may provide for a scheme of in situ homologous sequence detection of target DNA, analogous to previous atomic force microscopy studies.9 More generally, the sequential detection of proteins along DNA may have applications in, for example, screening for transcription factors along a genome. * Corresponding author,
[email protected]. † R.M.M.S. and S.W.K. contributed equally to this work. 10.1021/nl803189k CCC: $40.75
XXXX American Chemical Society
In this study, we present translocation measurements of RecA-coated dsDNA molecules. We first demonstrate the formation of complete RecA-dsDNA structures by atomic force microscopy (AFM) and subsequently show that translocation measurements result in pronounced current depressions compared to bare dsDNA molecules. We analyze the recorded events by their time duration and conductance blockade. The events can be well classified into two groups, based on the value of their conductance blockade. By carrying out translocation measurements on RecA protein alone and on RecA-coated dsDNA of different lengths, we show that the events with high conductance blockade values correspond to the translocation of the nucleoprotein filaments, whereas events with low conductance blockade values correspond to the translocation of free RecA proteins. We compare the high conductance blockade events to measurements on bare dsDNA and deduce a nucleoprotein filament diameter of 7.5 ( 0.5 nm, in agreement with available structural data. Additionally, we use the nanopore system in conjunction with an integrated optical tweezer, which allows us to insert the RecA-DNA complex into the nanopore. Finally, we present measurements on the event rate of RecA-dsDNA filament translocations as a function of voltage and identify two different regimes that cross over at a voltage of 150 mV. Our data provide the first reported measurements on translocation of protein-coated DNA structures. They not only provide a framework to identify sequences on a target
Figure 2. Atomic force microscopy (AFM) images of (a) 20 kbp dsDNA and (b) RecA-coated λ-DNA on mica. Note the presence of free RecA proteins visible as small blobs in (b). The bottom of both images contains a recorded height profile along the line indicated in blue.
Figure 1. (a) A transmission electron microscopy image of a 23.3 nm diameter nanopore. (b) Schematic of the experiment, showing a nanopore between two liquid compartments. We apply an electric field across the nanopore and measure the resulting current. Molecules are added to a single liquid compartment and translocate through the nanopore toward the positive biased electrode. (c) Current recording of a 31.1 nm diameter nanopore at 120 mV before and after the addition of bare λ-DNA or 5 kbp dsDNA/RecA filaments to the negatively biased electrode. Time and current scales as well as the molecules addition are indicated. Clear current spikes from the baseline appear upon addition of the molecules, with much larger current blockades for the RecA-dsDNA filaments as compared to the bare dsDNA. (d) Example of two typical translocation events after addition of RecA-coated DNA.
DNA strand but also form a starting point to address local DNA-protein structures using solid-state nanopores. Solid-State Nanopores. Solid-state nanopore fabrication starts with the use of standard microfabrication technology to create free-standing membranes. The manufactured 20 nm thin low-stress silicon nitride (SiN) membranes are mostly covered by a layer of 20 nm sputtered silicon oxide (SiO2), on both sides. In each membrane we fabricate a single nanometer-sized pore through the use of a highly focused electron beam in a transmission electron microscope (TEM). Subsequently, the diameter of the fabricated nanopore can be enlarged with the highly focused beam or made smaller by exposure to a defocused electron beam with lower intensity. Details of the fabrication process are described elsewhere.10 Figure 1a shows a TEM image of a fabricated solid-state nanopore of 23.3 nm diameter. In this study, we use nanopores with diameters from approximately 20-35 nm with good low-frequency noise properties.11 All nanopores are treated in an oxygen plasma for about 30 s on both sides prior to use. Subsequently, the nanopores are mounted in a polyether ether ketone (PEEK) microfluidic flow cell B
and sealed to liquid compartments on either side of the sample. Both compartments provide easy access for the placement of electrodes and exchange of solutions. Ag/AgCl electrodes are used to detect ionic currents and apply electrical fields. The currents are detected using a resistive feedback amplifier (Axopatch 200B, Axon Instruments) and low-pass filtered at 10 kHz before digitization at 100 kHz. The experiments are performed in a 1 M KCl salt solution containing 50 mM Tris-HCl at pH ) 7.9, 1 mM EDTA and 3.1 vol % glycerol. The glycerol is added to ensure equal conditions in both compartments upon addition of the nucleoprotein filament to a single compartment. A schematic of the experimental layout in shown in Figure 1b. Nucleoprotein Filament Formation. Figure 2a shows a tapping-mode AFM image (Nanoscope IIIa, Digital Instruments, Santa Barbara, CA) of 20 kbp dsDNA. AFM images are made in air after depositing DNA from an imaging buffer containing 10 mM MgCl2 and 5 mM Tris-HCl at pH ) 7.9 on freshly cleaved mica. The DNA molecules have an apparent height of Z ≈ 0.5 nm, as is evident from the line scan shown in Figure 2a. Note that the Z is lower than the expected value from the DNA crystal structure, as is commonly observed in AFM imaging of DNA. We coat λ-DNA molecules (or DNA molecules of shorter length) with the RecA protein by subsequently adding λ-DNA (Promega, WI), RecA (New England Biolabs, Ipswich, MA), and ATPγS (Roche, Switzerland) with final concentrations of approximately 1.2 nM, 6.5 µM, and 1.5 mM, respectively. The ATPγS, a poorly hydrolyzable ATP analogue, is required to prevent ATP-hydrolyzation-induced disassembly of RecA from the DNA. Filaments formed in the presence of the ATPγS are known to be very stable.12 The final solution contains 100 mM NaCl, 10 mM MgCl2, and 5 mM Tris-HCl, pH ) 7.9 and is incubated for 1 h at 37 °C. The ratio of RecA protein versus DNA basepairs was varied to obtain fully coated DNA molecules with a low background of free proteins. Figure 2b shows an AFM image of the resulting nucleoprotein filaments. From the line scan along the direction Nano Lett., Vol. xx, No. x, XXXX
Figure 3. (a) Event scatter plot of time duration vs conductance blockade of RecA-coated dsDNA translocation events and their respective histograms (b, c). The dotted circles indicate two distinct groups of events. We analyze the events as having either a low (<10.3 nS, black) or high (g10.3 nS, blue) conductance blockade and then made separate histograms for each group as shown by the color coding in (b, c). (d) Event scatter plot of time duration vs conductance blockade of free RecA protein translocation events and their respective histograms (e, f). The dotted circle indicates that there is only one group of events, similar in size and duration to the low conductance blockade events of (a).
indicated by the blue line in Figure 2b, we find an apparent height of Z ≈ 2.5 nm for the DNA-protein complexes. This is clearly much larger than the value measured for the bare dsDNA molecules, shown in Figure 2a. We observe the increased height along the total length of the DNA, indicating full coverage. Comparison of the molecular flexibility in the images of Figure 2a and Figure 2b also shows that the RecA-dsDNA filaments are much stiffer than dsDNA, as expected. The nucleoprotein filaments are stable for hours even in a 1 M KCl salt solution, as confirmed by subsequent AFM imaging (data not shown). The results obtained compare well with previously performed AFM studies on RecA-dsDNA complexes, which show comparable filaments with a height ranging from 2.5 to 4.4 nm.13-16 Note that in Figure 2b also some free RecA proteins are visible as small blobs. Much is known about the structure of the RecA protein,17 and recently also the crystal structure of the RecA-dsDNA complex was resolved.18,19 This study shows that the nucleoprotein filament is a right-handed helix composed of 6.2 RecA units per turn over a pitch of 9.2-9.5 nm. The dsDNA is bound within this filament with approximately one RecA monomer bound per three duplex base pairs, resulting in a 1.5-fold increase in the DNA extension. This means that a λ-DNA molecule will be extended to about 25 µm upon full coating with RecA. The values of the persistence length and the diameter of the filaments are much larger than those of naked dsDNA. The persistence length is increased upon RecA coating to a value of approximately 950 nm.20 From the obtained crystal structure of the RecA-dsDNA complex,18 we estimate a 7.0 ( 0.5 nm filament diameter of the local cross section of the filament. This value equals the diameter of the smallest cylinder enveloping the helical Nano Lett., Vol. xx, No. x, XXXX
RecA-dsDNA nucleoprotein filament within the 10.0 nm diameter outer envelope of the structure. Translocation of RecA-Coated dsDNA. Figure 1c shows current recordings of a 31.1 nm diameter nanopore at 120 mV before and after the addition of bare dsDNA and RecAcoated dsDNA molecules. The open pore conductance of this pore was 244 nS. When no molecules are present in solution, the ionic current recording displays a stable baseline with no significant deviations to lower or higher current values. Upon addition of λ-DNA molecules to the negatively biased compartment, short temporal current blockades appear. These blockades can be seen to reduce the ionic current through the nanopore to approximately 100-300 pA lower values. After flushing out these λ-DNA molecules, we add 5 kbp RecA-coated dsDNA filaments to the same compartment, which also results in temporal current blockades. However, these current decreases differ substantially in magnitude from the blockades measured for the bare dsDNA, reducing the current by as large as 1000-1500 pA. The much larger current blockades measured for the RecA-coated dsDNA compared to the bare dsDNA are expected because of the larger diameter of the nucleoprotein filament. Its translocation from the negatively to the positively biased electrode indicates an overall negative charge, in agreement with the isoelectric point (≈5.6) of purified RecA protein.8 We now analyze the translocation events of RecA-coated dsDNA molecules according to their conductance blockade and time duration. All events with conductance blockades that exceed the nanopore current noise are taken into account. The value of the conductance blockade is determined with respect to the open-nanopore conductance and represents the average blockade over the time duration of the event. The open-pore conductance is simply the average conductance C
(averaged over 2.5 ms before and after each translocation event), and we define that events begin and end when the conductance deviates 1 standard deviation from this average. Figure 3a shows the conductance blockade versus time duration of RecA-coated λ-DNA translocation events in a semilogarithmic scatter plot. The measurements are performed using a 23.3 nm diameter nanopore (shown in Figure 1a) and at a bias voltage of 180 mV. The open pore conductance of this pore was 144 nS. The events show a large variation in both the conductance blockade and the event duration, ranging from approximately 2 to 14 nS and from 10-4 to 10-1 s. We classify the events in two distinct groups, indicated by the dotted areas in Figure 3a. Most events either show a relatively low (≈4 nS, black) or large (≈12 nS, blue) conductance blockade, as is also evident from the histograms shown in Figure 3b. The duration of events with relatively small blockade values ranges from 10-4 to 10-3 s. In contrast, the events with large conductance blockades show a larger spread in event duration with values ranging from 5 × 10⁻⁴ to 5 × 10⁻² s. Figure 1d shows two typical events, one from each group. We characterize the events of the two groups by their most probable conductance blockade and time duration. These values are obtained by fitting a Gaussian and log-normal distribution to the conductance blockade and event duration histograms as shown in panels b and c of Figure 3, respectively. We find ∆G ) 3.3 ( 1.4 nS and t ) 216 (-100, +150) µs for the events with low conductance blockades, and ∆G ) 12.6 ( 1.1 nS and t ) 2.3 (-1.6, +5.6) ms for the events showing large conductance blockades. The error bars denote the standard deviations of the distributions. We now identify the high- and low-conductance-blockade events with the translocation of RecA-dsDNA filaments and the translocation of free RecA, respectively. Evidence for this is 2-fold. First, we measure the translocation of free RecA proteins without any DNA present, resulting in the scatter plot shown in Figure 3d. The translocation only results in the events with a low conductance blockade and short time duration. From a comparison of the scatter plots shown in Figure panels a and d of 3 it is clear that these events are similar to the low conductance blockade events measured during the RecA-coated dsDNA translocation experiments. We also characterize the RecA translocation events by their most probable conductance blockade and time duration. These values are obtained by fitting a Gaussian and lognormal distribution to the conductance blockade and event time duration histograms shown in Figure 3, panels e and f, respectively. We find ∆G ) 2.8 ( 0.9 nS and t ) 141 (-60, +103) µs, where the error bars again denote the standard deviation of the distributions. The values found agree with the values reported for the low conductance blockade events of Figure 3a, identifying these events with the translocation of free RecA protein. Second, panels a and b of Figure 4 show contour plots of the event duration versus conductance blockade of 5 kbp and 48.5 kbp RecA-coated dsDNA, respectively. We can again clearly identify the two distinct groups of events, which can be separated by their conductance blockade value. We D
Figure 4. Event duration vs conductance blockade of RecA-coated (a) 5 kbp and (b) 48.5 kbp dsDNA, presented as contour plots. The data are recorded at 120 mV, using nanopores of 31.1 and 24.2 nm diameter, respectively. Both contour plots show two distinct groups of blockade events. Only the event time duration of the higher-conductance-blockade events clearly depends on the length of the nucleoprotein filament, which indicates that these events result from RecA-DNA nucleoprotein filament translocation.
can again characterize the events of each group by their most probable conductance blockade and time duration. We obtain values of t ) 224 (-68, +97) µs, ∆G ) 6.9 ( 1.4 nS, and t ) 865 (-428, +847) µs, ∆G ) 11.2 ( 2.1 nS for the two groups of the 5 kbp long construct presented in Figure 4a. For the 48.5 kbp long construct shown in Figure 4b, we find t ) 276 (-129, +373) µs, ∆G ) 7.4 ( 1.0 nS, and t ) 1.9 (-1.2, +3.5) ms, ∆G ) 11.6 ( 1.9 nS. When comparing the data obtained on different nucleoprotein filament lengths, we notice that the time duration of the high-conductance blockades depends on the lengths of the filaments (shorter filaments translocate faster), whereas the time duration of the low-conductance blockade events is clearly independent of the length. As the time duration of translocation events is expected to depend on the length of the construct,21 we again conclude that the high-conductance blockade events represent translocation events of RecA-coated dsDNA, whereas the low-conductance blockade events represent translocation events of free RecA protein. We can analyze the measured RecA-coated λ-DNA translocation events and compare them to the well-studied translocation of bare λ-DNA. Unfolded, head-to-tail translocation events of bare λ-DNA show most probable translocation times and conductance blockades of approximately 1.1 ( 0.3 ms (at 120 mV) and 0.8 ( 0.1 nS, respectively.22 The average values of the RecA-coated λ-DNA translocation events are larger (see, i.e., Figure 4b), with translocation times of approximately 1.9 (-1.3, +3.6) ms (at 120 mV) and conductance blockades of 11.4 ( 0.7 nS (combined data from three different nanopores at various voltages). Furthermore, the spread in the translocation times is also very different. Whereas for the bare dsDNA the translocation time Nano Lett., Vol. xx, No. x, XXXX
can be fitted to a Gaussian on a linear scale, the event time duration of the RecA-coated dsDNA is fitted to a log-normal distribution (i.e., a Gaussian on a logarithmic scale) over 2 decades. Longer translocation times for the nucleoprotein filament as compared to the bare dsDNA (1.9 ms vs 1.1 ms) are expected as RecA binding along the total DNA length results in a 1.5-fold extension of the molecule. The measured translocation times reasonably agree with the predicted 1.5fold increase. However, this agreement might be fortuitous: The nucleoprotein filament has an increased persistence length and likely a different effective charge as compared to the naked DNA. As a result, both the driving and the dominant counteracting forces may be different.21 Disentanglement of these effects is necessary for a detailed understanding of the differences in translocation times. Moreover, the value of the translocation time of the RecAcoated dsDNA may also differ due to intrinsic reasons. The large spread in the measured translocation time values of the RecA-coated dsDNA is similar to that found in experiments performed on protein-DNA rupture through an R-hemolysin protein nanopore.4 In these experiments, the nanopore acts as a local force actuator pulling the protein-DNA complex apart after which only the latter can proceed to translocate through the nanopore. The resulting time duration of these events shows a very broad distribution over almost 2 decades, similar to duration distributions shown in Figure 3a. We confirmed translocation of the full RecA-coated dsDNA through the nanopore in recapture experiments (data not shown), a method published recently,23 which indicates that the structure of the filaments remains unaffected in the translocation process. We speculate that the long translocation times measured for the nucleoprotein filament reflect intrafilament or filament-nanopore interactions during translocation, which oppose the electrophoretic velocity of the coated DNA molecule. The most probable conductance blockade of the nucleoprotein filament is 14 ( 2 times larger than the blockade measured for the bare dsDNA (11.4 nS vs 0.8 nS). The value of the conductance blockade results from a combination of the volume of the translocating molecule and its effective charge.22 We can crudely estimate the diameter of the nucleoprotein filament by neglecting the effect of the charge of the molecule (high-salt approximation), which gives ∆GRecA/∆GDNA ) (dRecA/dDNA)2, with ∆GRecA and ∆GDNA the conductance blockade, and dRecA and dDNA ) 2.0 nm the diameter of the nucleoprotein filament and the bare dsDNA molecule,24 respectively. The 14 times larger blockade yields a value of 7.5 ( 0.5 nm for the diameter dRecA which represents the average cross section of the helical nucleoprotein filament. The obtained value compares well to the cross section of 7.0 ( 0.5 nm determined from the crystal structure of the RecA-dsDNA filament,18 estimated above. As a final check of the larger conductance blockade by RecA-coated DNA filaments, we use an optical tweezer in conjunction with the solid-state nanopore to statically capture single complexes. The details of the technique have been described previously.25 Briefly, a polystyrene bead (diameter Nano Lett., Vol. xx, No. x, XXXX
Figure 5. (a) A typical optical tweezer capture event for RecAcoated dsDNA (blue) compared to that of bare dsDNA (red). The capture events are set to start at 0 ms. Inset: schematic of the integrated optical tweezer measurement. (b) Conductance blockade histogram for RecA-dsDNA captures with the optical tweezer system.
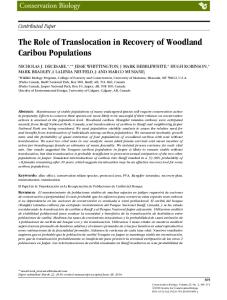
2 µm) with tethered RecA-coated dsDNA molecules is trapped and brought within a few micrometers of a nanopore using the optical tweezer. Once there, a bias is applied which pulls a molecule through the pore (see inset of Figure 5). Consequently, when a filament is captured, the measured conductance across the pore drops and does not return to its open-pore value since the optically trapped bead prevents total translocation. For the present measurements, the nucleoprotein filament is formed on DNA that is conjugated to the beads using a biotin-streptavadin bond at one end. Figure 5a shows an example of typical nucleoprotein capture events. Clearly the RecA-coated DNA filament shows a much larger current blockade (∼8 nS) than that of a bare dsDNA molecule (∼1 nS). The distribution of measured conductance blockades (Figure 5b) yields a value of 7.5 ( 1.8 nS. This large value qualitatively confirms a much thicker molecule than bare dsDNA. Whether there is a systematic difference between ∆G measured in dynamic translocation and static capturing is an open question that currently is under study. We can also directly measure the event duration with the optical tweezer method.25 This yields a value of 8.6 (+13.7, -5.3) ms which falls well within the distribution obtained by translocation. Summing up, these capture events of RecA-DNA filaments support our conclusion that high conductance blockades are indicative of molecules which are much thicker than bare dsDNA. Rate of Traversal of RecA-Coated dsDNA. We now report and analyze the number of events in a given time interval, the event rate, for the RecA-coated dsDNA filaments as a function of the applied voltage. Figure 6a shows 10 s long current-time traces of RecA-coated dsDNA translocation measurements at five different voltages. The number E
of current blockade events clearly depends on the voltage, varying from 0.5 ( 0.2 events per second at 80 mV to 11.6 ( 0.4 events per second at 160 mV. We can describe the occurrence of blockade events by a Poisson process,26 where the probability of observing no RecA-coated dsDNA blockade events, P0, during a time interval t is given by P0(t) ) e-Rt
(1)
where R denotes the event rate. We can now determine P0 versus t by analyzing the time between successive translocation events δt. We use a constant nucleoprotein filament concentration and only analyze events which reach a conductance blockade g5 nS. The use of higher cutoff values yields similar results. Plotting the δt values in a histogram immediately gives the probability distribution to observe an event after a specific elapsed time t. From this we simply obtain the probability Pe to observe an event after a time t, by addition. The resulting P0 versus t now follows from P0 ) 1 - Pe. Figure 6b shows the obtained probability density distribution P0 of RecA-coated-dsDNA events versus time for five different voltages. All distributions show a clear exponential behavior, with values ranging from R ) 2.3 ( 0.2 s-1 to R ) 13.9 ( 0.4 s-1 for 120-200 mV. The error in the event rate R is calculated using R/N1/2, where N is the number of observed blockade events. We plot the extracted event rate values as a function of voltage in Figure 6c. As the voltage is increased, the event rate initially increases exponentially, but at voltages larger than 150 mV, it attains a constant value. We fit an exponential function to the data for voltages e150 mV, as shown by the red line in Figure 6c, and find an exponent of 0.048 ( 0.002 mV-1. The exponential rate dependence can be described with a model where molecules cross a potential barrier U′ under influence of the electrical potential ∆U ) nze∆V. For the expected rate we can write R ∝ exp((U′ - ∆U)/kBT), with n the number of charged monomers units of effective charge ze within the potential drop ∆V.27 Using these equations, we find nz ≈ 1.2. This value is a lower bound to the real value because the actual potential drop involved in crossing the barrier is smaller than the applied potential V. An exponential dependence in event rate as a function of voltage was previously measured for DNA translocation through the protein pore R-hemolysin27,28,26 and recently for protein (BSA) translocation through a synthetic nanopore.29 The event rate of DNA translocation through fabricated nanopores was measured to be linear over voltages from 200 to 1000 mV.30,31 At voltages >150 mV, the event rate for our RecA-dsDNA molecules does not further increase but attains a constant value of 13.4 ( 0.6 s-1, as shown by the red line in Figure 6c. A cross-over from an exponential to a roughly linear regime was previously reported for R-hemolysin.28,26 Our results compare well to theoretical predictions where the exponential dependence results from an entropic entry barrier and the plateau is due to diffusion-limited transport.32,33 Discussion and Conclusions. We have reported the translocation of fully RecA-coated dsDNA through solidF
Figure 6. (a) Current-time traces of RecA-coated dsDNA blockade events at different voltages. The event rate becomes larger as the voltage is increased. (b) Probability distribution to observe no RecAcoated dsDNA blockade events, P0, for an elapsed time, t, at 120, 130, 140, 160, and 200 mV. The solid lines are exponential fits to the data at each voltage value, showing good agreement. (c) The event rate of RecA-coated dsDNA conductance blockades as a function of voltage. Each value is extracted from an exponential fit such as the ones shown in (b). The event rate exponentially increases at low voltages e150 mV and attains a constant value at high voltages >150 mV. The two regimes are fitted by an exponential and a constant, respectively, as show by the two red lines.
state nanopores. The translocation events of the nucleoprotein filaments show a large spread in event time duration as well as in the conductance blockade. We separate the events in two distinct groups, based on their conductance blockade value. We identify the high-conductance-blockade events as translocation events of RecA-coated dsDNA. The value range of the high-conductance blockade group of events compares quite well to the expected filament diameter as determined from crystallography and electron microscopy.19,34,35 We demonstrate that upon changing the length of RecA-DNA filament the event duration changes accordingly. Further, we perform captures of single nucleoprotein filaments with an optical tweezer-nanopore system and again find much larger blockades than previously measured for bare dsDNA. The event duration of RecA-coated λ-DNA molecule translocation shows no strong voltage dependence (as is for example evident from a comparison of the data at 120 mV in Figure 4b and at 180 mV in Figure 3b). This may indicate Nano Lett., Vol. xx, No. x, XXXX
filament-filament interaction within the molecule or an interaction of the protein with the membrane which hinders free translocation. For the latter, chemical coating of nanopores36 might result in a reduced spread in the event duration and hence yield a better identification of the translocation events. We find that the event rate of RecA-coated dsDNA molecules can be well described by a Poisson process. We measure the event rate as a function of the applied voltage and identify two different regimes. In the low-voltage regime, the event rate is found to increases exponentially with voltage, whereas in the high-voltage regime it attains a constant value. The reported translocation experiments are the first translocations of DNA-protein structures. The detection of RecA-dsDNA filaments is a first step toward sequentially identifying local structures on a target DNA strand using nanopores. Acknowledgment. We thank M. Y. Wu for contributions to the experimental work and T. van der Heijden for discussions. This work is part of the research programme of the “Stichting voor Fundamenteel Onderzoek der Materie (FOM)”, the “Nederlandse Organisatie voor Wetenschappelijk Onderzoek (NWO)”, and the EC project READNA. N.H.D. acknowledges funding from the European Science Foundation through a EURYI Award. References (1) Dekker, C. Nat. Nanotechnol. 2007, 2, 209–215. (2) Sutherland, T. C.; Long, Y. T.; Stefureac, R. I.; Bediako-Amoa, I.; Kraatz, H. B.; Lee, J. S. Nano Lett. 2004, 4, 1273–1277. (3) Fologea, D.; Ledden, B.; McNabb, D. S.; Li, J. L. Appl. Phys. Lett. 2007, 91, 053901. (4) Hornblower, B.; Coombs, A.; Whitaker, R. D.; Kolomeisky, A.; Picone, S. J.; Meller, A.; Akeson, M. Nat. Methods 2007, 4, 315–317. (5) Zhao, Q.; Sigalov, G.; Dimitrov, V.; Dorvel, B.; Mirsaidov, U.; Sligar, S.; Aksimentiev, A.; Timp, G. Nano Lett. 2007, 7, 1680–1685. (6) Benner, S.; Chen, R. J. A.; Wilson, N. A.; Abu-Shumays, R.; Hurt, N.; Lieberman, K. R.; Deamer, D. W.; Dunbar, W. B.; Akeson, M. Nat. Nanotechnol. 2007, 2, 718–724. (7) Cockroft, S. L.; Chu, J.; Amorin, M.; Ghadiri, M. R. J. Am. Chem. Soc. 2008, 130, 818–820. (8) Roca, A. I.; Cox, M. M. Prog. Nucleic Acid Res. Mol. Biol. 1997, 56, 129–223. (9) Seong, G. H.; Niimi, T.; Yanagida, Y.; Kobatake, E.; Aizawa, M. Anal. Chem. 2000, 72, 1288–1293.
Nano Lett., Vol. xx, No. x, XXXX
(10) Krapf, D.; Wu, M. Y.; Smeets, R. M. M.; Zandbergen, H. W.; Dekker, C.; Lemay, S. G. Nano Lett. 2006, 6, 105–109. (11) Smeets, R. M. M.; Keyser, U. F.; Wu, M. Y.; Dekker, N. H.; Dekker, C. Phys. ReV. Lett. 2006, 97, 088101. (12) Cox, M. M. In Topics in Current Genetics; Aguilera, A., Rothstein, R., Eds.; Springer-Verlag: Berlin and Heidelberg, 2007; pp 53-77. (13) Seitz, E. M.; Brockman, J. P.; Sandler, S. J.; Clark, A. J.; Kowalczykowski, S. C. Genes DeV. 1998, 12, 1248–1253. (14) Umemura, K.; Komatsu, J.; Uchihashi, T.; Choi, N.; Ikawa, S.; Nishinaka, T.; Shibata, T.; Nakayama, Y.; Katsura, S.; Mizuno, A.; Tokumoto, H.; Ishikawa, M.; Kuroda, R. Biochem. Biophys. Res. Commun. 2001, 281, 390–395. (15) Sattin, B. D.; Goh, M. C. Biophys. J. 2004, 87, 3430–3436. (16) Shi, W. X.; Larson, R. G. Nano Lett. 2005, 5, 2476–2481. (17) Bell, C. E. Mol. Microbiol. 2005, 58, 358–366. (18) Chen, Z. C.; Yang, H. J.; Pavletich, N. P. Nature 2008, 453, 489– 496. (19) Kowalczykowski, S. C. Nature 2008, 453, 463–466. (20) Hegner, M.; Smith, S. B.; Bustamante, C. Proc. Natl. Acad. Sci. U.S.A. 1999, 96, 10109–10114. (21) Storm, A. J.; Storm, C.; Chen, J. H.; Zandbergen, H.; Joanny, J. F.; Dekker, C. Nano Lett. 2005, 5, 1193–1197. (22) Smeets, R. M. M.; Keyser, U. F.; Krapf, D.; Wu, M. Y.; Dekker, N. H.; Dekker, C. Nano Lett. 2006, 6, 89–95. (23) Gershow, M.; Golovchenko, J. A. Nat. Nanotechnol. 2007, 2, 775– 779. (24) Nelson, D. L.; Cox, M. M. Principles of Biochemistry, 3rd ed.; Freeman Publishers: New York, 2000. (25) Keyser, U. F.; Koeleman, B. N.; Van Dorp, S.; Krapf, D.; Smeets, R. M. M.; Lemay, S. G.; Dekker, N. H.; Dekker, C. Nat. Phys. 2006, 2, 473–477. (26) Meller, A.; Branton, D. Electrophoresis 2002, 23, 2583–2591. (27) Henrickson, S. E.; Misakian, M.; Robertson, B.; Kasianowicz, J. J. Phys. ReV. Lett. 2000, 85, 3057–3060. (28) Nakane, J.; Akeson, M.; Marziali, A. Electrophoresis 2002, 23, 2592– 2601. (29) Sexton, L. T.; Horne, L. P.; Sherrill, S. A.; Bishop, G. W.; Baker, L. A.; Martin, C. R. J. Am. Chem. Soc. 2007, 129, 13144–13152. (30) Chen, P.; Gu, J. J.; Brandin, E.; Kim, Y. R.; Wang, Q.; Branton, D. Nano Lett. 2004, 4, 2293–2298. (31) Harrell, C. C.; Choi, Y.; Horne, L. P.; Baker, L. A.; Siwy, Z. S.; Martin, C. R. Langmuir 2006, 22, 10837–10843. (32) Ambjornsson, T.; Apell, S. P.; Konkoli, Z.; Di Marzio, E. A.; Kasianowicz, J. J. J. Chem. Phys. 2002, 117, 4063–4073. (33) Meller, A. J. Phys.: Condens. Matter 2003, 15, R581–R607. (34) Story, R. M.; Weber, I. T.; Steitz, T. A. Nature 1992, 355, 318–325. (35) Egelman, E. H.; Stasiak, A. Micron 1993, 24, 309–324. (36) Wanunu, M.; Meller, A. Nano Lett. 2007, 7, 1580–1585.
NL803189K
G