Trends in Self-Reported Spontaneous Abortions: 1970-2000*
Kevin Lang† and Ana Nuevo-Chiquero Boston University June 2011
*
Kevin Lang is a Professor at the Department of Economics at Boston University. Ana Nuevo-Chiquero is a Ph.D. student at the Department of Economics at Boston University. This paper was written in part while Lang was a visiting fellow at the Collegio Carlo Alberto and the University of New South Wales. He gratefully acknowledges their support and hospitality. The research was funded by Grant Number R03 HD05605601 from the National Institute of Child Health and Human Development, NIH. We have benefited from helpful discussions with Michael Greene, Karen Norberg, Mark Pasternack and Fred Wang and from the comments of three anonymous referees. The responsibility for any errors of fact or interpretation in this paper is ours alone. † Corresponding author: Boston University, 270 Bay State Road, Boston, MA 02215. email:
[email protected]. Ph: 617353-5694. Fax: 617-353-4001.
Abstract Little is known about how the miscarriage rate changed over the last few decades. Data from cycles IV to VI of the National Survey of Family Growth were used to examine trends from 1970 to 2000. The rate of reported miscarriages increased by about 1.0% per year, after accounting for abortion availability and the characteristics of pregnant women. This upward trend is strongest in the first seven weeks and absent after twelve weeks of pregnancy. African-American and Hispanic women report lower rates of early miscarriage than do whites. The probability of reporting a miscarriage rises by about 5% per year of completed schooling. The upward trend, especially in early miscarriages, suggests awareness of pregnancy rather than prenatal care to be a key factor in explaining the evolution of self-reported miscarriages. Any beneficial effects of prenatal care on early miscarriage are obscured by this factor. Differences in adoption of early awareness technology, such as home pregnancy tests, should be taken into account when analyzing results from self-reports or clinical trials relying on awareness of pregnancy in its early weeks.
2
Since the 1970s, there has been a significant improvement in technology and utilization of maternal and prenatal care (Kiely and Kogan 1994), including early and continuous risk assessment, promotion of healthy behaviors, medical and psychological interventions and follow-ups (Klerman 1990). Improved prenatal care and increased information about the risks associated with certain behaviors might be expected to have reduced the frequency of fetal loss.1 At the same time, the introduction of home pregnancy tests allowed women, for the first time, to obtain highly accurate confirmation of their pregnancy at a very early stage, without the need to see a doctor. But the availability of home pregnancy tests might have a perverse effect on the measured frequency of spontaneous abortion (hereafter referred to as miscarriage). The risk of miscarriage is highest in the very early stages of pregnancy (Wilcox, Baird and Weinberg 1999) and may be as high as 25% during the first six weeks following the last menstrual period. At this stage miscarriages are often asymptomatic (Pandya et al. 1996) and awareness of pregnancy is a key factor in determining whether a woman recognizes a miscarriage. Although it is implausible that home pregnancy tests directly affect the risk of miscarriage, they could affect the frequency with which women recognize miscarriage and therefore report it in survey data. Trends driven by increased awareness of pregnancy should manifest themselves primarily in early pregnancy, while medical care will, if anything have a stronger effect on late
1
For example, the National Library of Medicine of the National Institutes of Health
advises “Miscarriages are less likely if you receive early, comprehensive prenatal care and avoid environmental hazards...” http://www.nlm.nih.gov/medlineplus/ency/article/001488.htm accessed August 23, 2010. 1
miscarriages.2 We use self-reported data on pregnancy outcomes from the National Survey of Family Growth to examine the evolution of rates of reported fetal loss in the first 22 weeks of pregnancy, which we loosely term “miscarriage”, from 1970 to 2000. This period includes the expansion of prenatal care and the introduction of the home pregnancy test. We disaggregate miscarriages into “early” (seven weeks or less), “middle” (eight to twelve weeks) and “late” (more than twelve weeks) miscarriages. There is a clear upwards trend in self-reported early miscarriages. There is a weaker trend in self-reported miscarriages occurring in the middle period and no trend in self-reported late miscarriage. Our results provide detailed information about the evolution of miscarriage rates over time. National Vital Statistical Reports (Ventura et al. 2000, 2008) also provide estimates of all forms of fetal loss (including stillbirths and ectopic pregnancies) from 1976 to 2004. However, their approach assumes that fetal loss rates remain constant within five-year-age/race/Hispanicorigin group except when a new survey is used to compute these within-group rates. Between surveys all trends in fetal loss reflect only changes in the expected rate of fetal loss due to changes in the composition of pregnant women or to changes in the frequency of induced abortion. In contrast, our approach captures changes between surveys and accounts for variation in the incidence and timing of induced abortion. Since some induced abortions preempt a miscarriage that would have occurred later, it is essential to address the statistical complications caused by induced abortions.
2
While we do not address fetal death, defined as fetal loss after twenty weeks of
pregnancy, the rate of fetal death among pregnant women receiving no prenatal care is over five times that among those receiving at least some such care (Hoyert 1996). 2
METHODS The National Survey of Family Growth The data used in the analysis are extracted from cycles IV to VI of the National Survey of Family Growth (hereafter, NSFG), administered by the National Center for Health Statistics in 1988, 1995 and 2002. The NSFG collects data on family life, infertility, use of contraception, and women's health. The fourth cycle was the first to record length of gestation in weeks for all pregnancies regardless of outcome and is therefore the first that we can use for our purposes. The NSFG interviewed a nationally representative sample of non-institutionalized women aged 15-44 at time of the interview. Sample size varies by survey,3 totaling 26,940 women across the three cycles, of whom 10,959 had been pregnant at least once. In 1988, the surveys were administered in-person using a paper-and-pencil questionnaire. In 1995 and 2002 they were administered using a computer-aided-interview, able to detect inconsistent answers. All three cycles included self-administered sections that allow the respondent to provide information privately on sensitive matters such as abortion. All three cycles include information on each woman's pregnancies and their self-reported outcomes (birth, abortion, miscarriage, ectopic pregnancy or stillbirth). The different cycles of
3
The sample size was 8,450 in 1988. It increased to 10,847 in 1995 and decreased in 2002
to 7,643. We use sampling weights but rescale the weights so that the weighted number of observations for each survey equals the actual number. 3
the NSFG are generally comparable although the exact information gathered and its coding varies. The NSFG also consistently collected information on other characteristics of the respondent, such as educational attainment, marital status, race, religion, family income or parental education, all measured at time of the interview. Unfortunately, data on some important risk factors such as smoking during pregnancy (Dominguez-Rojas et al. 1994; Anokute 1986) were not collected in all cycles and therefore cannot be included in our analysis. We organize the data by the year in which the pregnancy occurred. Because the NSFG is conducted at infrequent and irregular intervals, it is important to select the sample carefully to ensure consistency across pregnancy years. Without restrictions, the sample of women potentially experiencing pregnancy would be, for example, 12-41 years old in 1999 (15-44 years old in 2002), 8-37 years old in 1995 and some odd weighting of women 5-34 years old (15-44 in 2002) and 12-41 years old (15-44 in 1995) in 1992. Unless we control perfectly for age and there is no variation in trends by age, true trends may be confounded with changes in the age composition of the sample by year. To avoid this potential problem, we choose age groups and pregnancy years in a manner that ensures that the age group studied remains constant over time. We focus on a sample of pregnancies occurring between 1970 and 2000 among women age 13 to 25 because this is the largest sample for which we can construct an age-consistent sample back to 1970. We experimented with a second age-consistent sample of pregnancies between 1980 and 2000 among women age 26 to 35, but the time period was too short to produce meaningful results. The trends we uncovered were similar to those reported in this paper but were never statistically significant at conventional levels. As a compromise and further check on our results, we analyze an unbalanced sample that 4
includes all pregnancies between 1970 and 2000 among women age 13 to 35 years of age. While the estimates using this sample are subject to the concern that the age distribution of the sample varies across years, by restricting the upper end of the age range, we reduce this concern. To further minimize this concern, we include dummy variables for each one-year age-at-pregnancy group. As we shall see, the results are similar to those obtained using the age-consistent sample. To ensure that our data do not include any incomplete pregnancies or pregnancies that would have been incomplete at the time of the survey had they gone to term, in all three samples we also restrict our analysis to pregnancies occurring at least two calendar years prior to the survey.4 We include mother's education (less than high school completion, high school graduate, some college, college or more) in our set of control variables. Mother's education is imputed for a significant minority of observations. In cycle IV, mother's education is imputed whenever it is missing. In cycles V and VI, there are a small number of respondents for whom mother's education is missing and not imputed. We drop these observations. The miscarriage rate for those
4
Although incomplete pregnancies are recorded separately, pregnancies ending in
miscarriage are significantly shorter than those ending in abortion or birth. Given that the last year is not fully included (surveys took place in the first part of the year), including the last two years of each survey would cause miscarriages to be overrepresented and would bias our results upward. This is particularly a concern regarding pregnancies occurring in 2001 and 2002, since these years are recorded in a single survey. As expected, including the last two years of each survey increases the occurrence of miscarriages and produces a significantly steeper estimate of the trend for middle miscarriages. 5
who were dropped for this reason is virtually identical to that for the sample as a whole. We also drop two pregnancies reported as having lasted zero weeks.
Measures Pregnancies. The three surveys recorded information about each pregnancy respondents had experienced. The 1970-2000 sample (13-25 years old) has data on 24,544 pregnancies, including 2,897 miscarriages. The length of gestation was recorded in weeks. However, we note that some women reported duration in months, causing small spikes in the duration distribution at weeks four, nine, thirteen etc. The (age-inconsistent) sample of 13-35 year olds contains 38,122 pregnancies, of which 4,855 ended in miscarriage. Miscarriages. When asked the outcome of their pregnancy, the NSFG respondents could choose among birth, abortion, miscarriage, or stillbirth.5 The option of ectopic pregnancy was added in cycles V and VI although in cycle IV women could volunteer that the pregnancy was ectopic. There are some indications that ectopic pregnancies were simply less likely to be reported in the earlier cycle. For a given year of pregnancy, the miscarriage rate excluding ectopic pregnancies is independent of the survey year. However, for a given year of pregnancy, ectopic pregnancies were more likely to be reported in the later surveys because in those surveys, ectopic pregnancy was explicitly presented as a possible pregnancy outcome. The differences in reporting are most easily explained by nonreporting of ectopic pregnancies rather than their misreporting as miscarriages.
5
“Still pregnant” is not applicable in our case since we restrict the sample to pregnancies
at least two calendar years prior to the survey. 6
We do not want to report an increase in fetal loss rates that may simply reflect an improvement in the questionnaire. Moreover, ectopic pregnancies are conceptually distinct from miscarriages. We therefore drop ectopic pregnancies from the sample and group together reported miscarriages and stillbirths occurring in the first 22 weeks (5 months) of pregnancy and refer to them loosely as miscarriages. We choose 22 weeks, rather than the more standard 20 weeks used to define miscarriages, to capture those respondents rounding their response to five months. All pregnancies lasting more than 22 weeks, regardless of reported outcome, are treated as non-miscarriages. Fortunately, because the number of ectopic pregnancies is small (187 in the smaller sample and 406 in the larger) the results are similar whether we include or exclude ectopic/tubal pregnancies. While, based on hospital discharges, the CDC reports an upward trend in ectopic pregnancies during the 1970s and 1980s (Goldner et al. 1993), no such trend is present in our data. As a result, the choice between the broad measure of fetal loss or the narrower “reported miscarriage or stillbirth in first 22 weeks” has no effect on any of our principal results and little effect on the others. The narrower definition results in somewhat smaller point estimates of the time trend, but significance levels are rarely affected. Despite this generally positive assessment, there is one important caveat. When we include ectopic pregnancies in a general measure of fetal loss, for some specifications using the unbalanced sample, we cannot conclude that we should exclude survey dummies from the specification. When both survey dummies and pregnancy year are included in the specification, our results are too imprecise to be useful. Ectopic pregnancies are sufficiently infrequent in our younger sample that, in practice, the differential treatment of ectopic pregnancy in different cycles turns out not to be a problem for this group. Duration of pregnancy. Note that duration of pregnancy is self-reported. A small 7
number of women report a miscarriage in the first two weeks of pregnancy. About ten percent of miscarriages are recorded as having occurred in the fourth week, many of which were undoubtedly reported as occurring in the “first month”. Presumably these are mostly miscarriages that occurred in the first month following the first missed period, not in the first month after the last period (as physicians prefer to measure pregnancy duration). We have not tried to adjust the reported durations.6 Finally, we divide miscarriages into early (seven weeks or less), middle (eight to twelve weeks) and late (more than twelve weeks) miscarriages. These categories each account for roughly one-third of the miscarriages in the unweighted data.
Analytic Approach Although we provide information on individual level risk factors for miscarriage, our focus is on estimating the time trend in miscarriage while controlling for some of these factors. We use a hazard model (Lancaster 1990) in which each pregnancy is considered a spell and the length of the pregnancy is the duration variable.
i t lim h→0
Prt h T i ≥ t|Ti ≥ t 0 texpX ′i h
(1)
The model specifies the risk of miscarriage, λ, as proportional to some unknown baseline hazard, λ0, common to all women, and depending exponentially on a vector of time-invariant covariates7, X, (Cox 1972). It facilitates nonparametric estimation of the baseline hazard and 6
A small number of births are also reported at implausibly early dates. We have not
removed them from the data. 7
We restrict our analysis to time-invariant variables because the NSFG does not collect 8
provides a straightforward interpretation of the parameters: a one unit increase in one of the covariates will cause a percentage increase or decrease in the risk of miscarriage approximately equal to the value of the corresponding parameter. The probability of a pregnancy lasting until time t given that it has lasted until t+1 is given by
PT i ≥ t 1|T i ≥ t exp −
[
t1 t
i udu exp − expt X ′i
(2)
]
t 1
where (t ) ln t 0 (u )du . Therefore, the log-likelihood function of a sample of N individuals will be T i −1
N
L,
∑ d i ln1 − exp−expT i i1
X ′i
− ∑ expt X ′i t1
(3)
where d i = 1 if the spell is censored and T i is the time at which the pregnancy ends or is censored. The hazard model framework can be applied to the competing risks scenario, where a spell (pregnancy) can end with the realization of different risks (induced abortion, miscarriage, birth). The availability of induced abortion necessitates the use of a competing risks model. An increase in the rate of induced abortion will mechanically reduce the miscarriage rate by reducing the amount of time that pregnant women are at risk for miscarriage. At the same time, simply eliminating pregnancies ending in induced abortions would have the opposite problem; pregnancies that would have ended in birth are disproportionately eliminated from the data.8 information on characteristics that can change during pregnancy. 8
A simple example may help. Suppose that of every four pregnancies, in the absence of
induced abortion, one would end in an early miscarriage, one in a late miscarriage and two in a 9
Moreover, women having abortions are not a random sample of pregnant women. Therefore, failing to account for the presence of abortion will not only reduce our estimate of the risk of miscarriage but will do so particularly for those women who are more likely to have an abortion, thereby biasing our estimates of the effects of other factors on miscarriage risk. Given independence of risks, the competing risks model allows us to treat observations ending in an outcome other than miscarriage as censored, simplifying the estimation procedure. The controls (X) are factors that are a) consistently available across all three cycles for all pregnancies and b) likely to increase either miscarriage or abortion or c) serve as proxies for such variables. Thus we expect that Catholics will be less likely to make use of induced abortion. If so, in the absence of controls for religion, we will overestimate the risk of abortion for Catholics, which could, in turn, incorrectly lead us to observe a relation between miscarriage and variables correlated with being Catholic. We control for race, not because we have any reason to believe that miscarriage is
live birth. The true miscarriage rate is therefore 50%. Now suppose that women would choose to terminate half of pregnancies and that all such terminations occur in the middle of pregnancy (after early miscarriages would occur but before late miscarriages would occur) and that the probability of an induced abortion is unrelated to miscarriage risk. Now, of every four pregnancies, on average one will end in early miscarriage, one in birth, one and a half in induced abortion and one half in late miscarriage. The presence of induced abortion reduces the miscarriage rate to three-eighths. Conditional on no abortion, the miscarriage rate is three-fifths. Neither of these captures medical risk. 10
physically related to race but because use of induced abortion differs by race and factors such as health and smoking that are candidates for sources of miscarriage risk are correlated with race. Education and mother's education are also related to health, smoking and alcohol and drug use and are therefore included as controls. We include three age variables (age, age squared and less than 15) to capture the J-shaped relation between age and miscarriage. We also include whether the woman had a prior miscarriage. This will capture any physical or health conditions that make it difficult for a woman to give birth as well as any persistent behavioral factors not captured by our other controls. Finally, we control for whether the woman reports that the pregnancy happened at the right time. Women who do not wish to give birth may take actions, short of induced abortion, that increase the likelihood of a spontaneous miscarriage. These last two variables are both subject to concerns about potential endogeneity. If miscarriage is, for example, increasing over time, then women who become pregnant in, say 2000, will be more likely to have had a prior miscarriage than those who became pregnant in 1970. The prior miscarriage variable would capture part of the trend. Thus including it is a conservative strategy. It is also possible that women's assessments of whether the timing of pregnancy was right is influenced by the outcome of the pregnancy. Women who give birth may be more reluctant to report that the pregnancy was badly timed. Fortunately an earlier version of this paper excluded these two variables with no notable effect on the results. All analyses were conducted using Stata 11. For a reasonable period following publication, the Stata do-files and data will be available on the journal’s website. The proportional hazard models were estimated using the stcox command. Two-step estimation. We do not have sufficient data to estimate an accurate (relative) miscarriage rate for each year in our sample. Our focus will be on whether there is a trend 11
(linear, quadratic, spline). If some factor, other than random sampling, causes the miscarriage rate in a year to deviate from the trend, then the standard errors reported using standard software packages may be severely biased downwards. Following Donald and Lang (2007), we implement a two-step procedure in which we first estimate the hazard model with a set of year of pregnancy dummies, Di , in addition to controls for race, religion, etc. T i −1
N
L, 1 , Γ
∑ d i ln1 − exp−expT i i1
Z ′i 1
Di Γ − ∑ expt Z ′i 1 Di Γ t1
(4)
The estimated coefficients on these dummy variables, Γ̂ , are then regressed, in a second stage, on the time trend. In practice the coefficient and standard errors are similar regardless of whether we use a one-step or two-step method, but the two-step method facilitates examining more complex trends. The second-stage is conducted using the reg, qreg and rreg commands.
RESULTS Descriptive statistics Table 1 presents descriptive statistics for all pregnancies and for miscarriages for our two samples. In the younger (balanced) sample, based on the self-reports, about 12% of pregnancies ended in a miscarriage. This is somewhat smaller than the generally accepted rate for all pregnancies but is in the standard range for this age group (Andersen 2000). The self-reported miscarriage rate rises to 13% for the sample including older women. Miscarriages occurred, on average, in the 10th week of pregnancy, although there is a lot of variation in this timing. Not controlling for characteristics and changes in the incidence of abortion, pregnancies occurring early in the sample period are less likely to end in miscarriage. While 13% of pregnancies to women 13-25 years old that did not end in abortion ended in miscarriage in the 12
1970-1979 period, this figure was 15% during the last ten years of our sample (1990-2000). A similar pattern is observed when older women are included in the sample, for whom the miscarriage rate rose from 13% to 16%. Given pregnancy, whites are, on average, noticeably more likely to have a miscarriage than are African Americans or Hispanics. Women having miscarriages are somewhat more educated than the average, and they are less likely to have mothers who were high school dropouts. Our sample means for females 13 to 25 years old do not show a consistent relation between age and miscarriage, which is not surprising given the age group (Wood 1994:250-252; see also Smith and Buyalos 1996; Abdullah 1993). As noted, there is a higher rate of miscarriage in the unbalanced sample, although this is partially explained by the lower frequency of abortion. There is no consistent relation between religion and miscarriage in the summary statistics. Average age at pregnancy in our sample is around twenty-one for the younger sample and twenty-five in the unbalanced sample. Finally, having had a miscarriage before the current pregnancy increases the probability of this pregnancy ending in miscarriage, confirming the well documented fact that some women have a greater tendency to miscarry (Kutteh 2005). Table 1 goes here
No evidence of recall bias The data used in the analysis were collected up to nineteen years after the pregnancy. This raises concerns that trends might be driven by recall bias. Although up to thirty years later, women have good recall of pregnancy and related events such as personal characteristics at the time of pregnancy or medication taken (Tomeo et al. 1999), women might fail to report pregnancies, especially miscarriages, that occurred long ago. Gestational age is the major determinant of 13
recall (Wilcox and Horney 1984), but time since pregnancy loss might also affect recall rates. To assess the importance of recall bias, we estimate a basic model in which, in addition to our standard control variables, we include a time-trend for year of pregnancy and dummy variables for each survey except the earliest included in the sample. If recall bias is important, then, for example, we would expect that a 1990 miscarriage would be more likely to be reported in the 1995 survey than in the 2002 survey. Thus, the coefficients on the survey dummies should be negative and monotonically decreasing with recentness of the survey. It is evident that this pattern does not arise in the first column of table 2. Both of the coefficients are positive, and the coefficient on 2002 is more positive than the coefficient on 1995. The coefficients are neither individually nor jointly significant. In short, there is no evidence of recall bias in these data. We confirm that this is not due to imposing a linear time trend by repeating the exercise with dummy variables for each year of pregnancy. In this case (not shown), the coefficients on the survey dummies are tiny with one positive and one negative. A related concern is that small differences in the survey cycles might generate spurious trends. The lack of significance of the coefficients on the survey dummies makes this unlikely. As a further check, we run a “horse race” between a model with only a time trend and a model with only survey dummies. The Akaike information criterion selects the model with only the time trend. We replicated table 2 (not shown) for each race (white, African American, Hispanic, and other), as well as for our sample of “early miscarriages” with similar results. We are therefore confident that we can merge the data from the three cycles. In the unbalanced sample, there is no evidence of recall bias, but, consistent with our concerns about this sample, the preferred specification is dependent on the choice of information criterion. The Akaike criterion pushes us away from the specification without survey dummies 14
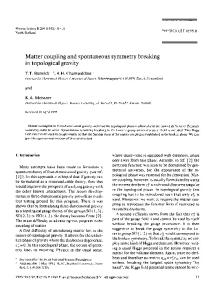
while using a criterion that punishes extra variables more harshly, the specification without survey dummies is preferred. To maintain consistency with our treatment of the younger sample, we exclude the survey dummies. However, including them would strengthen our conclusion that there is an upwards trend in early miscarriages but not in other miscarriages. Table 2 goes here Miscarriage rates increased over time Figure 1 presents the evolution of the relative rate of miscarriage for the sample of pregnancies among 13-25 year old women from 1970 to 2000. The dots are the point estimates of the relative rate (log odds ratio), normalized to zero in 1970, and the lines are the smoothed estimates and the (separately) smoothed confidence intervals. The rate shows a general upward trend that is sharper over the 1970s and over the early 1990s. This sharp increase in the 1990s seems to be driven by a single outlier, but even without this outlier, there is a strong upward trend over the entire post-1970 period. Table 3 gives the results of the multivariate estimation. It is divided into two panels corresponding to the samples we use. In each panel the first line presents estimates of the time trend for all miscarriages while the next three lines provide these estimates for early, middle and late miscarriages. Although visual inspection of figure 1 suggests a more complicated pattern, the data are inadequate to estimate a higher order trend. We are never able to identify separate linear and quadratic components and therefore show only linear trends in the table. The top panel examines the younger sample. When we include year of pregnancy in the hazard model (“one-step”), we estimate that miscarriages increased by somewhat about 0.6% per year over the period. Two-stage estimation gives a slightly higher estimate when the second step is conducted using OLS. Second step methods designed to reduce the influence of outliers 15
(quantile and robust regression) do not change the substance of the results. Finally, we experiment with a spline that allows the trend to begin at a later date (not shown). The best fit occurs when the trend begins at the beginning of the sample period. However, we cannot reject trends that begin before 1993.9 Thus, while we have strong evidence of an upward trend in miscarriage rates, we are not able to determine its timing precisely. Our results for the other sample are broadly similar. As noted, the results for this sample must be treated with caution since the age distribution varies over time. We only partially address this concern by including a set of dummy variables for age at pregnancy. If miscarriage trends vary by age, using the unbalanced sample is problematic. Nevertheless, the similarity of the results in the two panels is reassuring. Figure 1 goes here
Early miscarriage rates increased more sharply Figure 2 shows the relative miscarriage rates, again measured by the log odds ratio, by timing using the younger sample. When we restrict miscarriages to those occurring early in pregnancy, there is a strong trend over the sample period. This is confirmed by formal statistical analysis (see the second line of the first panel of table 3). Depending on the method used, we find that miscarriage in the first seven weeks of pregnancy rose by 1.2 to 1.6% per year. When we allow for a spline (not shown), the point estimate is that the trend began in 1986, but the confidence interval includes the entire period through 1992. As in the case of all miscarriages, we have
9
This confidence interval and its counterparts for different durations of miscarriage do not
correct for clustering. 16
strong evidence of a trend but we are unable to pinpoint its timing. Again, the trend estimates for the other sample are quite similar to those obtained using the younger sample. In the younger sample, miscarriage occurring at eight to twelve weeks (see the third line of the table) also trended upwards although, depending on the choice of technique, the upward trend (0.7 to 0.9 percent) is not always statistically significant at the .05 level, which is consistent with the fact that it is less visually clear in figure 2. The best fitting spline begins in 1972, but as with all and early miscarriages, the confidence interval is large and includes any start through 1994. Again the broad pattern is found in the other sample. The estimates may be somewhat smaller than in the top panel but also tend to be more statistically significant. Figure 2 goes here Finally, we detect no evidence of a trend in miscarriages occurring after the first twelve weeks. The point estimates are almost all small, negative in some cases, and do not approach statistical significance at conventional levels. Table 3 goes here Before moving on, it is worth contrasting our results with those provided in National Vital Statistics Reports (Ventura et al. 2000, 2008). Although obtained from the same data source, their estimates are for all fetal loss (including those occurring after 22 weeks) and for all women age 15-44. Therefore we expect some discrepancies, but these differences do not account for all that we observe. When we calculate fetal loss as a fraction of pregnancies, as shown in figure 3 their estimates imply no trend from 1976 to 1987 then a very sharp jump from 1987 to 1990, presumably because the 1987 estimates rely on the 1982 and 1988 cycles of the NSFG, while the 1988 and 1989 estimates rely on the 1988 and 1995 cycles and the estimates after 1990 rely on the 1995 and 2002 cycles. After 1990 there is no clear trend. Since the approach in those 17
reports assumes constant within-group fetal loss rates for those not having abortions, it is also useful to look at the fetal loss as a percent of pregnancies not ending in abortion. This approach also shown in figure 3 reveals a very slight upward trend throughout the 1980s and 1990s with a small jump in 1982, the first year that uses the 1988 as well as the 1982 cycle and larger jumps in 1988 and 1990, again reflecting changes in the surveys used to calculate fetal loss rates. Figure 3 goes here Despite the different definition of the key variable and sample and differences in method that produce differences in timing, the broad message is similar. The least squares estimate of the trend in miscarriage or fetal loss, with abortions in the denominator is 1.2% and is 0.8% when abortions are dropped.10
Characteristics affecting miscarriage risk Table 4 presents the first stage results for the remaining covariates for all miscarriages and for the sub-periods for the younger sample. When interpreting these results, it is important to remember that while we generally use the short-hand “miscarriage risk”, we are, in fact, capturing the risk of reporting having miscarried conditional on awareness of pregnancy. We focus on this important distinction in the discussion. The risk of a reported miscarriage increases significantly with respondent's education although this effect is clearer in the age-consistent sample. For this group, the risk of miscarriage increases by about 5% with each additional year of own education. While average levels of education have risen over the period we study, this effect is not sufficient to account for much of
10
The sample period is 1976-2004. Standard errors are each less than 0.1 18
the increase in miscarriage rate. When a wider age range is included, the importance of education declines. This is consistent with formal education being a less important source of pregnancy information among older women. We also include mother's education in four categories. While the point estimates suggest that women with more educated mothers are more likely to report a miscarriage, none of the coefficients approaches statistical significance. Also, in the age-consistent sample African American and Hispanic women have a lower risk of miscarriage than do white women for all miscarriages and those in the first twelve weeks, and the estimated differences are large, in some estimates as much as fifty percent although the difference is significant for Hispanics only for the early weeks .11 The difference between whites and African Americans is statistically significant even in the late miscarriage estimates. This difference also tends to be smaller in the unbalanced sample but only becomes statistically insignificant for late miscarriages. For the younger sample, the age variables are jointly significant only for all miscarriages taken together and approach significance (p=.07) for early miscarriages. Age is associated with diminishing miscarriage risk over most of the relevant age range. Given that we only consider pregnancies occurring before age 25, the beneficial effect of being older is consistent with the standard results, but the negative point estimates for very early conception are surprising. However, in the sample of pregnancies among women 13 to 35 years of age, the estimated effect of age at conception on miscarriage follows the standard J-shape with the point estimates
11
The coefficients shown are relative to “other” which is primarily, but not exclusively,
Asians. 19
suggesting that miscarriage risk is minimized at age 21. Women who had a prior miscarriage are substantially more likely to have a miscarriage than are those who never experienced one. Recurrent pregnancy losses are a well-documented phenomenon for a small percentage of women and undoubtedly reflect the persistence of biological, genetic and environmental factors, but the possible importance of the persistence of factors predicting pregnancy awareness in contributing to this pattern should not be ignored. Moreover, prior miscarriage may make women more aware of early pregnancy. Table 4 goes here.
DISCUSSION The increase in the rate of miscarriage over the last decades is a surprising finding. Before presenting our preferred explanation, we consider some alternatives that have been suggested to us. First, perhaps changes in health insurance might have reduced access to prenatal care. The best evidence suggests the opposite. The proportion of pregnant women receiving early prenatal care increased in the 1970s (Kiely and Kogan 1994) and by some measures continued to increase through 2000 (Kogan et al 1998; Lauderdale et al 2009). Although there is mixed evidence in the literature on the effects of prenatal care (Fiscella 1995), it would be expected, if anything, to help reduce the risk of miscarriage by increasing early detection of risk factors and providing women with information to help them avoid risky behaviors during pregnancy. Second, smoking and/or alcohol and drug abuse might have risen over this period. Reported smoking during pregnancy fell sharply between 1967 and 1980 (Kleinman and Kopstein 1983) and from 1989 to 2000 (Ventura et al 2003). While we have not been able to 20
locate trend data for the 1980s, among women as a whole, smoking fell sharply between 1979 and 1990 (NCHS 2010:table 60). Similarly, alcohol use decreased among pregnant women between 1988 and 1995 (Ebrahim 1998) and there has been no increase since that time (CDC 2009). We were unable to locate earlier data on alcohol consumption among pregnant women, but alcohol consumption per capita in the United States increased between 1970 and 1980 before trending downwards. Per capita consumption was about one-eighth lower in 2000 than in 1970 (NIAAA, updated 10/2009). While it is obviously difficult to get accurate information on illegal drug use, and we are aware of no data on trends in their use by pregnant women, there has been no trend over this period in illegal drug use in the general population (Basov, Jacobson and Miron 2001). Third, any of a number of environmental factors could be to blame. The most obvious of these is sexually transmitted diseases, but the recorded prevalence of syphilis, gonorrhea and chancroid were all notably lower in 2000 than in 1970. In contrast, chlamydia has increased, but this appears to reflect reporting rather than prevalence. Data were first collected in 1984 and the disease was not reportable in all states until 2000 (CDC 2008). Stillerman et al (2008) conclude “The available scientific evidence suggests a variety of links between environmental pollutants and a range of adverse birth and pregnancy outcomes. Some links, such as evidence of neurodevelopmental effects of lead, mercury, and PCBs in humans, are established, some are likely, such as occupational exposure to solvents and birth defects, others are likely though some uncertainty remains on the nature and extent, such as air pollution and adverse birth outcomes, and some are suggestive, with further study required, such as water contamination from DBPs and pregnancy loss”. Mendola, Messer and Rappazzo (2008) reach similar conclusions. Most, but certainly not all, known pollutants declined over this period. Among leading air pollutants, 21
nitrogen dioxide, volatile organic compounds (VOCs), sulfur dioxide, particulate matter, carbon monoxide and lead all decreased, but nitrogen oxides increased (EPA 2001). Similar levels of contaminants in water generally fell following passage of the Safe Water Act in 1974 (EPA 1999). The removal of lead from gas and paint and the end of DDT-spraying should have decreased, not increased, these risks. It is, of course, impossible to rule out environmental factors not currently linked to miscarriage - home computers were introduced in 1974 and became increasingly common throughout the rest of the century - but we believe that, with the exception of chlamydia and thus pelvic inflammatory disease, for which data do not exist, we have addressed the principal contenders. Nevertheless, while known or suspected risk factors may have been reduced, precisely because they were known or suspected, given the number of currently suspected or known environmental risk factors for miscarriage, it would be foolish to argue that we can eliminate such factors as an explanation. Nevertheless, we suggest instead that a likely explanation for the later trend is the development of better and easier pregnancy tests. The home pregnancy tests available in the market from 1977 were the first ready-to-use at home, over-the-counter, tests available, enabling women to confirm privately their pregnancy at a very early stage. Even the first versions were very precise - 96% accuracy for positive results and 80% for negative - and could be taken around 10 days after the woman missed her period. Therefore, home pregnancy tests undoubtedly confirmed pregnancies and miscarriages that would previously been attributed to being “late”. The early-awareness effect of home pregnancy tests could impact the evolution of miscarriage rates by making women aware of pregnancy losses that would otherwise have gone unnoticed or been dismissed. 22
A post-1980 trend in miscarriage rates, particularly early miscarriages would be most consistent with this hypothesis. Our best point estimate of the beginning of the trend in early miscarriages is 1986, but unfortunately, as we have noted, this start date is measured too imprecisely to be compelling. However, this hypothesis gains further support from the large trend in early miscarriage and the absence of a trend in late miscarriages. Awareness of miscarriages late in pregnancy is unlikely to have been greatly affected by home pregnancy tests since most women would be aware of being pregnant after having missed several periods, and they would usually have needed to seek medical attention when the miscarriage occurred. There is also direct evidence that women were becoming aware of pregnancy sooner. Cycles V and VI of the NSFG ask women who had been pregnant in the last several years when they became aware of the pregnancy. For our sample of 13 to 35 year olds, we can calculate the mean response for 1990-1993 and 1996-2000. We estimate that mean reported timing of awareness was decreasing at the rate of about one half week per decade over this period. Future work can better address this question by adding the cycle VII data and determining whether both the trend in early miscarriage and earlier awareness continued into the new millennium. Although the main focus of this research is on the evolution of miscarriage rates over the last decades, the results for the first stage covariates are nevertheless relevant. African Americans and Hispanics present a lower risk of miscarriage than do whites, especially early in pregnancy. This surprising finding is likely to be driven by early awareness of pregnancy. Given that women tend to learn more about pregnancy as they get older, the fact that this difference declines with age is also suggestive of the importance of awareness of pregnancy for selfreported miscarriage. Therefore, we see our results by race as evidence of differential awareness of pregnancy, either reflecting a difference in knowledge of pregnancy related events or a 23
difference in the use of home pregnancy tests. The woman's own education is also a relevant factor in determining the risk of miscarriage. Although more educated women may tend to take better care of themselves and access early prenatal care more frequently, the risk of miscarriage increases with education. Once again, this suggests that early recognition of pregnancy and, perhaps, greater use of home pregnancy tests are responsible for this result, at least in part, although the continued significance of this variable even for late miscarriages is surprising. The hypothesis that awareness of pregnancies and miscarriages is a highly relevant factor is consistent with most of our results and should be taken into account when using the NSFG for epidemiological studies. For example, it suggests caution in interpreting the relation between age and miscarriage revealed in our estimates. Similarly, differences in awareness of pregnancies or knowledge about reproduction by race or education level should be taken into account when performing and analyzing the results of clinical trials.
24
REFERENCES Abdullah HI, G. Burton, A Kirkland, MR Johnson, T Leonard, A Brooks, and JWW Studd. 1993. “Age, pregnancy, and miscarriage: uterine versus ovarian factors.” Human Reproduction 8(9):1512-7. Andersen AMN, J Wohlfahrt, P Christens, J Olsen, and M Melbye. 2000. “Maternal age and fetal loss: population based register linkage study.” British Journal of Medicine 320:1708-12 Anokute CC. 1986. “Epidemiology of spontaneous abortion: the effects of alcohol consumption and cigarette smoking.” Journal of the National Medical Association 78(8):771-75. Basov, S, M Jacobson, and JA Miron. 2001. “Prohibition and the Market for Illegal Drugs.” World Economics, 2(4):133 - 57. Centers for Disease Control. 2008. Sexually Transmitted Disease Surveillance, 2007. Atlanta, GA: U.S. Department of Health and Human Services. Centers for Disease Control. 2009. “Alcohol Use Among Pregnant and Nonpregnant Women of Childbearing Age - United States, 1991-2005.” Morbidity and Mortality Weekly Report, 58(19):529-532. Cox DR. 1972. “Regression Models and Life Tables (with discussion).” Journal of the Royal Statistical Society Series B, 34(2):187-220. Dominguez-Rojas V, JR de Juanes-Pardo, P Astasio-Arbiza, P Ortega-Molina and E GordilloFlorencio. 1994. “Spontaneous abortion in a hospital population: are tobacco and coffee intake risk factors?” European Journal of Epidemiology 10(6):665-668. Donald S, and K Lang. 2007. “Inference with Difference-in-Differences and Other Panel Data.” The Review of Economics and Statistics 89(2):221-233 Ebrahim, SH, ET Luman, RL Floyd, CC Murphy, EM Bennett, and CA Boyle. 1998. “Alcohol 25
Consumption by Pregnant Women in the United States During 1988-1995.” Obstetrics & Gynecology. 92(2):187-92. Fiscella K. 1995. “Does prenatal care improve birth outcomes? A critical review.” Obstetrics & Gynecology 85(3):468-79 Goldner, TE, HW Lawson, Z Xia and HK Atrash. 1993. “Surveillance for Ectopic Pregnancy United States, 1970-1989.” MMWR 42(SS-6);73-85. Hoyert DL. 1996. “Fetal Mortality by Maternal Education and Prenatal Care.” National Center for Health Statistics. Vital Health Statistics. 20(30). Kiely JL and MD Kogan. 1994. “Prenatal Care.” In: From Data to Action: CDC's Public Health Surveillance for Women, Infants and Children. National Center for Health Statistics. Hyattsville, Maryland. Kleinman, JC and A Kopstein. 1987. “Smoking During Pregnancy, 1967-80.” Am J Public Health. 77(7):823-5. Kleinman JC, A Kopstein A, and LV Klerman. 1990. “The Need for a New Perspective on Prenatal Care.” New Perspectives on Prenatal Care. New York: Elsevier, 1990:6. Kogan, MD, JA Martin, GR.Alexander,MK, SJ Ventura, FD Frigoletto. 1998. “The Changing Pattern of Prenatal Care Utilization in the United States, 1981-1995, Using Different Prenatal Care Indices.” Journal of the American Medical Association. 279(20):1623-1628. Kutteh WH. 2005. “Recurrent pregnancy loss.” In: Carr BR, Blackwell RE, Azziz R. (eds.), Essential Reproductive Medicine, McGraw-Hill, NY. 585-592. Lancaster, T. 1990. The Economic Analysis of Transition Data. Cambridge: Cambridge University Press. Lauderdale, DS, TJ VanderWeele, J Siddique, and JD Lantos. 2009. “Prenatal Care Utilization in 26
Excess of Recommended Levels: Trends From 1985 to 2004.” Med Care Res Rev published online 13 November 2009. Mendola P, LC Messer, K Rappazzo. 2008. “Science Linking Environmental Contaminant Exposures with Fertility and Reproductive Health Impacts in the Adult Female.” Fertility and Sterility 89(2):e81--94. National Center for Health Statistics. 2010. Health, United States, 2009: With Special Feature on Medical Technology. Hyattsville, MD. National Institute on Alcohol Abuse and Alcoholism, Per capita ethanol consumption for States, census regions, and the United States, 1970--2007. (Gallons of ethanol, based on population age 14 and older), http://alcoholism.about.com/gi/o.htm?zi=1/XJ&zTi=1&sdn=alcoholism&cdn=health&tm=1 4&f=00&su=p284.9.336.ip_p1026.7.336.ip_&tt=2&bt=0&bts=0&zu=http%3A//www.niaaa .nih.gov/Resources/DatabaseResources/QuickFacts/AlcoholSales/consum03.htm, accessed November 12, 2010. Pandya PP, JM Snijders, N Psara and L Hilbert. 1996. “The prevalence of non-viable pregnancy at 10-13 weeks of gestation.” Ultrasound in Obstetrics and Gynecology 7(1):1-4. Smith KE and RP Buyalos. 1996. “The profound impact of patient age on pregnancy outcome after early detection of fetal cardiac activity.” Fertility and Sterility 65(1):35-40. Stillerman KP, DR Mattison, LC Giudice and TJ Woodruff. 2008. “Environmental Exposures and Adverse Pregnancy Outcomes: A Review of the Science.” Reproductive Sciences 15(7): 631-650. Tomeo CA, JW Rich-Edwards, KB Michels, CS Berkey, DJ Hunter, AL Frazier, WC Willett and SL Buka. 1999. “Reproducibility and Validity of Maternal Recall of Pregnancy-Related 27
Events.” Epidemiology 10(6):774-77. United States Environmental Protection Agency. 1999. 25 Years of the Safe Water Drinking Act. EPA 816-R-99-007. United States Environmental Protection Agency. 2001. Latest Findings on National Air Quality: 2000 Status and Trends. EPA 454/K-01-002. Ventura, SJ, WD Mosher, SC Curtin and JC Abma. 2000. “Trends in pregnancies and pregnancy rates by outcome: Estimates for the United States, 1976-96.” National Center for Health Statistics. Vital Health Statistics. 21(56). Ventura, SJ, JC Abma and WD Mosher. 2008. “Estimated pregnancy rates by outcome for the United States, 1990-2004.” National Vital Statistics Reports; 51(15). Hyattsville, MD: National Center for Health Statistics. Ventura, SJ, MA Brady, E. Hamilton, TJ Mathews, and A Chandra. 2003. “Trends and Variations in Smoking During Pregnancy and Low Birth Weight: Evidence From the Birth Certificate, 1990-2000.” Pediatrics 111(5):1176-80. Wilcox, AJ, DD Baird and CR Weinberg. 1999. “Time of Implantation of Conceptus and Loss of Pregnancy.” New England Journal of Medicine 340(23):1796-99. Wilcox AJ and LF Horney. 1984. “Accuracy of Spontaneous Abortion Recall.” American Journal of Epidemiology 120(5):727-33. Wood JW. 1994. Dynamics of Human Reproduction: Biology, Biometry, Demography. New York: Aldine de Gruyter.
28
Table 1: Variable means and standard deviations: pregnancies to females 13 to 25 years old and 13 to 35 years old (unbalanced sample), 1970-2000. 13-25 years old Birth Abortion Miscarriage Weeks pregnant White African American Hispanic Protestant Catholic Education Mother's education HS dropout HS graduate Some college College graduate Age at conception Conception before 15 Pregnancy number Prior miscarriage Right timing of pregnancy N
All pregnancies 0.720 (0.449) 0.147 (0.354) 0.122 (0.328) 30.666 (13.491)
Miscarriages
13-35 years old Miscarriages
9.677 (4.814)
All pregnancies 0.737 (0.440) 0.121 (0.326) 0.131 (0.338) 31.17 (13.194)
0.627 (0.484) 0.180 (0.384) 0.155 (0.362) 0.565 (0.496) 0.327 (0.469) 12.062 (2.476)
0.689 (0.463) 0.152 (0.354) 0.129 (0.335) 0.573 (0.495) 0.324 (0.468) 12.261 (2.308)
0.664 (0.472) 0.110 (0.359) 0.142 (0.349) 0.550 (0.498) 0.348 (0.476) 12.603 (2.699)
0.714 (0.452) 0.129 (0.335) 0.121 (0.326) 0.558 (0.497) 0.342 (0.474) 17.754 (2.580)
0.375 (0.484) 0.419 (0.493) 0.122 (0.327) 0.084 (0.278)
0.339 (0.473) 0.436 (0.496) 0.136 (0.343) 0.090 (0.286)
0.352 (0.478) 0.419 (0.493) 0.132 (0.338) 0.097 (0.296)
0.323 (0.468) 0.433 (0.495) 0.139 (0.346) 0.105 (0.307)
20.884 (2.900) 0.018 (0.142) 1.982 (1.222) 0.138 (0.345) 0.423 (0.494) 24544
20.963 (2.928) 0.020 (0.132) 2.160 (1.383) 0.241 (0.428) 0.410 (0.492) 2897
24.000 (4.871) 0.013 (0.113) 2.319 (1.474) 0.179 (0.383) 0.481 (0.500) 38122
24.547 (5.048) 0.010 (0.101) 2.590 (1.748) 0.282 (0.450) 0.460 (0.498) 4855
Note: Weighted means and standard deviations. Source: Authors calculations from National Survey of Family Growth data.
29
9.751 (4.738)
Table 2: Test for recall bias: effect of survey year on reported miscarriage controlling for linear time-trend in incidence of miscarriage: 13-25 years old and 13-35 years old: 1970-2000.
Year of pregnancy 1995 NSFG 2002 NSFG χ2
(1) 0.005 (0.005) 0.034 (0.072) 0.035 (0.102) 250.43
13-25 years old (2) 0.006* (0.003)
248.03
0.068 (0.060) 0.104 (0.068)
(4) 0.004 (0.004) 0.084 (0.055) 0.073 (0.084)
13-35 years old (5) (6) 0.007** (0.003) 0.113* (0.045) 0.133* (0.054)
248.77
351.84
349.81
(3)
343.51
AIC 59378.47 59374.91 59378.23 103772.8 103773.2 103772.8 N 24541 24541 24541 38119 38119 38119 Note: Standard errors clustered by respondent are reported in parentheses. All specifications control for race, religion, own and maternal education, prior miscarriage, whether pregnancy occurred at “the right time” and age at conception. Source: Authors calculations from National Survey of Family Growth data. †p<0.10; *p<0.05; **p<0.01; p<0.001
30
Table 3: Time trend of miscarriage rates: proportional hazard estimates for year of pregnancy (one-step procedure) and trend on year of pregnancy dummies (two-step). One-step
Two-step
Two-step
Two-step
OLS
Quantile regression
Robust regression
0.009** (0.003) 0.016*** (0.004) 0.009* (0.004) 0.001 (0.005)
0.008† (0.004) 0.015* (0.007) 0.009 (0.006) -0.003 (0.006)
0.009** (0.003) 0.015** (0.005) 0.008† (0.004) -0.001 (0.005)
13-25 years old All miscarriages Early miscarriages Middle miscarriages Late miscarriages
0.006* (0.003) 0.012† (0.006) 0.007 (0.005) -0.000 (0.006)
13-35 years old All miscarriages
0.007* 0.009** 0.009* 0.008** (0.003) (0.002) (0.003) (0.002) Early miscarriages 0.015** 0.019*** 0.017** 0.017*** (0.005) (0.004) (0.006) (0.003) Middle miscarriages 0.007 0.007* 0.006† 0.007* (0.004) (0.003) (0.003) (0.003) Late miscarriages -0.001 -0.000 0.002 -0.001 (0.005) (0.005) (0.006) (0.005) Note: Standard errors clustered by respondent are reported in parentheses. Early miscarriages: within the first 7 weeks; middle miscarriages: between week 7 and 12; late miscarriages: after week 12 of gestation. First step of adjusted estimates controls for race, religion, maternal and own education, prior miscarriage, whether pregnancy occurred at “the right time” and age at conception. Source: Authors calculations from National Survey of Family Growth data. †p<0.10; *p<0.05; **p<0.01; ***p<0.001
31
Table 4: Effect of characteristics on risk of miscarriage (first step estimates): 1970-2000. 13-25 years old White African American Hispanic Protestant Catholic Education Mother HS graduate Mother some college Mother college graduate Age at conception (Age at conception)2 Conception before 15 Ever had a miscarriage Right time of pregnancy χ2 N 13-35 years old White African-American Hispanic Protestant Catholic Education Mother HS graduate Mother some college Mother college graduate Ever had a miscarriage Right time of pregnancy χ2 N
Full sample
Early Miscarriages
Middle Miscarriages
Late Miscarriages
0.177 (0.143) -0.144 (0.150) -0.063 (0.153) 0.027 (0.073) 0.070 (0.086) 0.052*** (0.010) 0.053 (0.054) 0.095 (0.075) 0.103 (0.120) -0.310* (0.121) 0.007* (0.003) -0.283 (0.206) 0.735*** (0.066) -0.273*** (0.056) 303.00 24541
0.145 (0.213) -0.184 (0.228) -0.316 (0.231) 0.058 (0.150) 0.340* (0.168) 0.051** (0.018) 0.027 (0.100) 0.144 (0.126) 0.081 (0.269) -0.260 (0.200) 0.005 (0.005) -0.139 (0.365) 0.791*** (0.121) -0.214* (0.120) 189.44 24541
0.113 (0.256) -0.307 (0.263) -0.100 (0.277) 0.024 (0.122) -0.168 (0.143) 0.052** (0.018) 0.042 (0.094) 0.144 (0.134) 0.068 (0.170) -0.340 (0.209) 0.008 (0.005) -0.339 (0.339) 0.748*** (0.093) -0.323*** (0.084) 177.20 22083
0.311 (0.247) 0.123 (0.251) 0.303 (0.266) -0.008 (0.138) 0.010 (0.149) 0.056** (0.019) 0.093 (0.099) -0.055 (0.140) 0.171 (0.166) -0.302 (0.216) 0.007 (0.005) -0.408 (0.341) 0.649*** (0.104) -0.281*** (0.085) 101.84 19583
0.199† (0.108) -0.023 (0.115) 0.018 (0.117) -0.022 (0.058) -0.012 (0.066) 0.017* (0.008) 0.066 (0.046) 0.078 (0.061) 0.134 (0.083) 0.589*** (0.051) -0.313*** (0.044) 381.86 38119
0.180 (0.173) -0.092 (0.187) -0.124 (0.191) -0.127 (0.110) 0.054 (0.126) 0.014 (0.015) 0.072 (0.087) 0.199 (0.107) 0.227 (0.170) 0.625*** (0.096) -0.382*** (0.092) 215.37 38119
0.163 (0.171) -0.148 (0.181) -0.050 (0.190) 0.058 (0.098) -0.047 (0.109) 0.032* (0.013) 0.052 (0.078) 0.01 (0.103) 0.04 (0.128) 0.573*** (0.077) -0.305*** (0.065) 233.93 34482
0.273 (0.190) 0.218 (0.197) 0.276 (0.205) 0.009 (0.119) -0.053 (0.124) 0.002 (0.015) 0.074 (0.080) 0.012 (0.111) 0.136 (0.131) 0.581*** (0.077) -0.239*** (0.064) 178.10 30852
Note: Standard errors clustered by respondent are reported in parentheses. Early miscarriages: within the first 7 weeks; middle miscarriages: between week 7 and 12; late miscarriages: after week 12 of gestation. The 13-35 sample includes age at pregnancy dummies, not reported. Source: Authors calculations from National Survey of Family Growth data. †p<0.10; *p<0.05; **p<0.01; ***p<0.001
32
.5 0 -.5
log odds ratio
1
Figure 1: Log Odds of Miscarriage (Smoothed)
1970
1980
1990 year of pregnancy
estimate upper bound
smoothed estimate lower bound
Note: The sample includes 24,544 pregnancies to women 13-25 years of age in the US
33
2000
34
12 14 16 18 20
miscarriages per 100
Figure 3: Miscarriage Rate Estimates, Vital Statistics Reports 1976-2004
1975
1985
1995 year of pregnancy
excluding abortions Note: y-axis begins at 12
35
all pregnancies
2005