Service Expansion, International Exposure, and Political Preferences
Philipp Rehm (
[email protected]) and Anne Wren (
[email protected])
Paper Prepared for Presentation at the Workshop: “The Political Economy of the Service Transition”, Institute for International Integration Studies, Trinity College Dublin. (16th and 17th May 2008).
- Work in progress. Please don’t cite or circulate without permission -
1
1
Introduction
It is often assumed that the shift towards services will be associated with an increasing concentration of workers in sectors which are sheltered from the international economy. This assumption arises because, historically, many service sectors have been regarded as non-tradable. International service provision has been hampered both by regulatory barriers to trade and by technical limitations and cost constraints – for example the need for face to face contact in order for a service to be provided, and the time and expense associated with international travel and international communications. In truth, however, service sectors have never been completely non-tradable, and technical advances over the last thirty years – in particular the revolution in information and computer technology – along with substantial steps towards the liberalization of services trade and FDI have been associated with rapidly increasing levels of trade and foreign direct investment in several areas of services (including finance and business services, transport and communications, and wholesale and retail trade) (IMF, 2003; Unctad, 2004). One of the things which we do in this paper is to examine how the transition to services affects the distribution of labor between exposed and sheltered sectors in different countries. We find that in fact the most notable change which has taken place since the 1970s has been a marked shift in the probability that high-skilled workers will end up in sectors which are internationally exposed. This shift reflects a steady decline in all countries in what had been a concentration of high-skilled workers in welfare state sectors, and their movement towards what we label “dynamic” service sectors (characterized by high rates of productivity growth and exposure to the international economy)1. Its effect is such that while high skilled workers in all of the countries in our sample were significantly more likely to find themselves in sheltered than exposed sectors in 1970, in all countries but one (Austria), they were equally or (in most cases) significantly more likely to find themselves in exposed sectors by 2003. We believe that this shift is likely to have important implications both for welfare state politics, and for patterns of support for left parties. Our reasons for arguing this are as follows. Welfare state policies are not free. They come at a cost in terms of taxation (or potentially government debt). These costs in turn have negative implications for competitiveness and increase the risk of job loss for workers in exposed sectors. We argue that workers in exposed sectors will internalize this risk when forming their policy preferences (especially given the prevalence of these ideas in political and media debates). As a result, they will be less supportive of welfare state spending than their “sheltered” counterparts. Our empirical analysis finds evidence of this distinction in preferences amongst workers at all skill levels (with interesting variations across policy areas, as we discuss in the text). In terms of macro level outcomes, however, we suggest that the distinction in preferences at higher skill levels will be most relevant, given the significant changes in the labor market distribution of this skill group over time. Essentially, we argue that the concentration of high-skilled workers in exposed sectors over time increases the size of the anti-welfare state lobby. We also argue that these changes have implications for the political support of left parties. Since Left government tends to be associated with higher levels of spending and taxation, then, to the extent that these issues are electorally salient, our findings on policy preferences would suggest 1
See Wren (2008) for more discussion of these characteristics of dynamic service sectors.
2
that support for Left government will be higher amongst sheltered than exposed workers, and lowest of all amongst high skilled exposed groups. Our empirical analysis supports these hypotheses. Our macro level data suggests that this should not pose any new threat to the core constituencies of left parties. Less-skilled workers have always been more concentrated in exposed than sheltered sectors, and there has been little change in this distribution in most countries over time. It does, however, suggest that the middle class support on which left parties rely in order to obtain electoral majorities may be being undermined. One implication of this development is that left parties will find it increasingly difficult to forge coalitions between lessskilled workers and the middle class. Our arguments and evidence are laid out in the paper as follows. Section 2 provides the theoretical framework for our hypotheses about the impact of international exposure on policy and electoral preferences. Section 3 describes our macro-level data (from the EU-KLEMS “Growth and Productivity Accounts” data-set, compiled by the “Groningen Growth and Development Centre” (University of Groningen)) which shows the changes in the distribution of workers across exposed and sheltered sectors over time. Section 4 presents evidence based on our analysis of micro level data (from the ISSP 1996 Role of Government (III)) survey in support of our hypotheses about the impact of exposure on policy and electoral preferences. Section 5 concludes. 2
Theoretical Framework
Social policy is not free. It comes at a cost, wherever government spending is involved, of taxation or government debt. Aside from this direct cost, it may also imply indirect costs in terms of employment and economic growth where taxation or debt has a negative impact on competitiveness. Two influential articles from the economics literature which investigate these relationships directly are Alesina and Perotti (1997) and Daveri and Tabellini (2000). Alesina and Perotti’s study focuses on the large increase in direct taxes on households and social security taxes which occurred in tandem with the expansion of welfare spending in OECD countries between 1960 and 1990 and investigates its impact on competitiveness. They define competitiveness as unit labor costs in one country relative to its competitors. In their analysis, they focus on manufacturing sectors, under the assumption that most service sectors are nontraded. Looking at data from the usual set of advanced industrialized countries (AICs) between the mid 1960s and 1990, they find significant negative effects of taxation on competitiveness.2 Daveri and Tabellini (2000) obtain similar results, looking at the impact of taxation on unemployment in different institutional contexts. One implication of this research is that for workers in internationally exposed sectors, whose employment prospects depend in part on levels of competitiveness, increases in taxes should be associated with an increased probability of job loss, or unemployment. We should note that these articles form part of a somewhat controversial broader literature in economics on the relationship 2
Interestingly, they also find that the size of the effect varies depending on the industrial relations context. Thus the effects are worst in intermediate bargaining systems, where unions are powerful enough to pass some of the burden of an increase in labor taxation on to employers in the form of increased wages. In decentralized contexts where unions are less powerful, and in centralized contexts, where unions are more likely to internalize the impact of wage inflation on competitiveness, a greater share of the burden of labor taxation falls on workers and increases in tax are less likely to be passed onto employers. Thus, similarly to Calmfors and Driffils (1988), findings on the impact of bargaining structures on unemployment, they find an inverse hump-shaped relationship between bargaining centralization and the size of the negative effect of taxation on competitiveness
3
between welfare spending and growth, in which many mechanisms are investigated, including effects of taxation on investment, productivity, labor supply and demand, consumer demand, and competitiveness. However, most of the controversy in this literature has centered on the relationship between taxation and economic growth more generally, with several authors arguing that negative effects of taxation may be outweighed by the positive effects of welfare state policies on productivity and investment. At this point we know of no significant critiques of Alesina’s more limited contention, that labor taxation is associated with increased unit labor costs. Of additional, and perhaps even more importance to our argument, which focuses on preference formation and political decision making, however, is the widespread “belief” in policy circles that trade-offs do exist between taxation, competitiveness, and unemployment – and in particular the OECD’s aggressive line on the importance of tax cuts (see Gatti and Glyn 2006 for a list of key OECD references here). This widely held view is often replicated in national policy debates (refs.). It is also frequently heard in political and media discussions about multinationals’ location decisions (ref./e.g.). In spite of the prevalence of these arguments in academic, policy and media circles, however, the idea that (a) taxation may raise the risk of unemployment in exposed sectors, and (b) this “cost” of social policy may influence the preferences of workers in exposed sectors over policies which involve government spending, has not so far been incorporated into models of social policy preferences. Thus while unemployment risk is built into most state-of-the art models of preferences over redistribution (including Moene and Wallerstein 2001, Iversen and Soskice 2001, Cusack, Iversen and Rehm 2006, Rehm 2008), this risk is for the most part treated exogenously.3 In particular these models do not consider the possibility that taxation may raise the risk of unemployment risk for workers in exposed sectors. We propose a model of preference formation over welfare state policy which incorporates these ideas. Based on the preceding discussion, we start from the assumption that a trade-off exists between welfare state spending and competitiveness as depicted in Figure 1.4 <<< Figure 1 about here >>> Following Alesina and Perotti, welfare state spending is assumed to affect competitiveness through its (positive) effect on taxation and unit labor costs. In turn, this effect is assumed to raise the risk of unemployment for workers in exposed sectors, but not for workers in sheltered sectors. Existing models tell us that preferences for redistribution are strongly influenced by skill and income levels (which are closely correlated). We also hypothesize that preferences will be significantly influenced by skill levels. We argue, however, that we should also see significant differences in the preferences of exposed and sheltered sector workers at different skill levels. That is, we expect workers to internalize the impact of increased taxation on their risk of unemployment when forming their preferences.
3
Moene and Wallerstein (2001) discuss a possible extension endogenizing the probability of unemployment (p.865). Reference to model by Moffitt, Ribar and Wilhelm (1998). 4 Note that for our argument to hold, in fact the underlying economic argument need not necessarily be true. All that needs to be true is that it is a widespread belief political and social circles.
4
Identified by these two characteristics – skill level and level of international exposure – therefore, we expect the structure of preferences over welfare state spending to be as depicted in Figure 2. As shown in the Figure, and as we discuss below, we expect the relationship between skills, exposure and preferences to vary slightly across different types of policy <<< Figure 2 about here >>> We begin by discussing the more straightforward case where welfare state spending has no unemployment insurance function (Figure 2a). Our basic assumption is that, across all skill levels, workers in exposed sectors are more likely to take account of the effects of transfer spending (and taxation) on competitiveness, and thus, ceteris paribus, favor lower levels of spending. That is, where i represents the worker’s skill level: Preferred Spending Leveli (Exposed) < Preferred Spending Leveli (Sheltered) The resultant preference structure is depicted in Figure 2a. Note that the lines in this graph are parallel, indicating that we expect no variation in the effects of skill on preferences across exposed and sheltered groups. Their (common) slopes will depend on the relative strength of the effects of skill level and exposure on preferences in any given policy area. Figure 2b, depicts the slightly more complicated situation where there is an unemployment insurance component to welfare state spending. In this case, we expect that the slopes of the lines may vary across the exposed and sheltered groups. Why is this? It is relatively standard (and to our minds entirely plausible) to assume that when people weigh preferences over unemployment risk, this risk enters their utility function in terms of the expected income loss associated with unemployment or unfavorable re-employment prospects (see for example, Moene and Wallerstein 2001, Iversen and Soskice 2001, Cusack, Iversen and Rehm 2006, Rehm 2008). Insurance based policies (for example, income guarantees) reduce this expected loss. Thus, taxation for this purpose simultaneously has the effect of increasing the probability of unemployment for exposed workers and reducing its costs in terms of potential lost income.5 Where these effects offset each other, we will see no difference between the preferences of exposed and sheltered workers. We hypothesize that the insurance benefits of taxation will be relatively higher at the bottom end of the skills (earnings) distribution where insurance is more likely to guarantee a level of income approaching lost earnings. As incomes increase, however, the divergence between insurance income and lost income from employment also increases so that the “benefits” of taxation at the individual level become increasingly smaller than the costs (in terms of increased risk of lost income associated with unemployment). In the case of policies with an unemployment insurance component, therefore, we expect that the preferences of
5
It may be helpful to think of this more formally. If we assume that workers max. U = α U [(1-t)w+r] + (1- α) U [b], where “α” is the probability of employment (0<α<1), “t” the tax-rate, “w” wage income, “r” a flat-rate benefit and “b” the unemployment replacement rate. Then the key difference between the two types of policy under consideration is the following. If we let g = welfare state spending on the policy in question. Our basic argument is that, for all types of spending policies, dα/dg < 0 (under the assumption that dt/dg >0, or for simplicity, that g=t). For insurance based policies, however, this effect is partially offset by the fact that db/dg >0. This offsetting effect does not exist for non-insurance based policies, as spending on these types of policies has no impact on expected income transfers in case of employment loss. We postpone the solution of this model until the next iteration of the paper.
5
exposed and sheltered workers will approach each other at the bottom end of the skills distribution and diverge increasingly as skill levels increase, as depicted in Figure 2b. The implications of these arguments for welfare state politics should be relatively clear. We expect that where levels of exposure to the international economy increase, especially at higher skill levels, the size of the anti-welfare state lobby will also increase. We also expect the effects to be felt in the electoral arena. Since left governments are typically associated with higher levels of spending and taxation (Tufte 1978; Roubini and Sachs 1989; Cusack 1997; Garrett 1998; Huber, Ragin and Stephens 2001), and to the extent that welfare state spending and taxation are electorally salient, our theoretical argument would lead us to predict that support for Left government will be higher amongst sheltered than exposed workers, and lowest of all amongst high skilled exposed groups. Where all of this becomes particularly interesting is when we consider the changes which are occurring in the distribution of workers at different skill levels between exposed and sheltered sectors. These changes are described in the next section, and their implications discussed in the conclusions. Note that our argument runs contra to the conventional wisdom which emerged from the work of Katzenstein (1985), Cameron (1978, 1984) and Rodrik (1997). The (mostly implicit) underlying micro-logic in their accounts suggests that workers in exposed sectors demand redistribution (as a way of insurance). In contrast, we argue that workers internalize the effects of social policy on their employment outlooks (which we assume to be negative for workers in exposed jobs, and zero for workers in sheltered jobs). A recent study testing the conventional view on exposure and preferences for redistribution does not find evidence in favor of the Cameron-Rodrik type of arguments (Rehm 2008), and the evidence below provides evidence in support of the micro-logic suggested by this paper’s theoretical framework.
3
Macro-level Evidence
Historically, services have been assumed to be untradeable. The famous haircut example (‘you cannot trade a haircut’) can be found in many introductory economics textbooks. The assumption that service sectors do not participate in international markets used to make sense (to a certain degree at least) since international service provision has been hampered both by regulation and barriers to trade and by technical limitations and cost constraints – for example the need for face to face contact in order for a service to be provided, and the time and expense associated with international travel and international communications. Nevertheless, service sectors have never been completely non-tradable. Today’s reality is characterized by rapidly increasing levels of trade and foreign direct investment in several areas of services (IMF, 2003; Unctad, 2004). This development was possible due to technical advances over the last thirty years – in particular the revolution in information and computer technology – along with substantial steps towards the liberalization of services trade and FDI. As a result of these developments, there has been a substantial expansion in services trade worldwide since the mid-1980s. Although it remains small compared with goods trade, trade in services has doubled since the mid-1980s (see Figure 3). Of possibly more importance, FDI in services has also shown substantial increases. The world’s inward stock of services FDI quadrupled between 1990 and 2002, so that services now account for 60% of the total inward FDI stock worldwide (up from 25% in the 1970s). In some developed countries, meanwhile, the figure is closer to 80% (Unctad, 2005).
6
<<< Figure 3 about here >>> As we would expect, there is significant sub-sectoral variation in the extent to which services are traded internationally. We provide some indication of this variation in Figure 4 and Figure 5 and Table 1 (which we thank Sotiria Theodoropoulou for sharing). As we can see from Figure 4 and Figure 5 the most traded service sectors are transport, travel, finance and business services. Table 1 on the other hand shows that most service FDI occurs in the areas of finance and other business services and wholesale and retail trade. <<< Figure 4 about here >>> <<< Figure 5 about here >>> <<< Table 1 about here >>> We begin our analysis by employing a basic two-fold classification of sectors (mainly at the ISIC 1-digit level) as exposed or sheltered. Our codings are listed below. Coding the principal traditional sectors – agriculture, mining and manufacturing – as exposed is, we believe, uncontroversial. Our classification of service sub-sectors is justified based on the information above (and further analysis by Theodoropoulou and Wren 2008). •
•
Exposed
Agriculture, hunting, forestry and fishing (A&B) Mining and quarrying (C) Total manufacturing (D) Electricity, gas and water supply (E) Post & Telecommunications (64) Transport equipment (34&35) Financial intermediation (J) Real estate, renting and business activities (K) Wholesale and retail trade (G)
Hotels and restaurants (H) Construction (F) Other community, social and personal services (O) Private households with employed persons (P) Extra-territorial organizations and bodies (Q) Public administration and defense; compulsory social security (L) Education (M) Health and social work (N)
Sheltered
We are interested in the distribution of workers at different skill levels across sheltered and exposed sectors. We rely on the “EU KLEMS Growth and Productivity Accounts,” a data-set compiled by the “Groningen Growth and Development Centre” (University of Groningen); see www.euklems.net for details. The EU-KLEMS data builds on OECD’s “Structural Analysis” (STAN) database, which collects data the industry level. However, the EU-KLEMS data contains more details, and a range of additional and useful variables. For example, the data-set contains information at three different levels of skills. The definition of each skill-level for each country can be found in Table 7 in the Appendix.
7
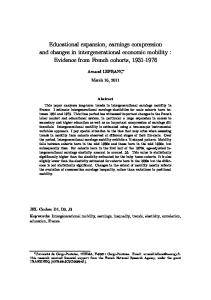
<<< Table 7 (Appendix) about here >>> The following three figures display the distribution of low-skilled (Figure 6), medium-skilled (Figure 7) and high-skilled (Figure 8) workers, respectively, across exposed and sheltered sectors. By and large, the distribution of low-skilled workers across exposed vs. sheltered sectors does not display a whole lot of variation, neither across countries nor – somewhat surprisingly – over time. In all country-years, low-skilled workers are more likely to be found in exposed than in sheltered sectors. In Denmark and Japan, the probability of a low-skilled worker being in an exposed sector increases somewhat over time, while it decreases most visibly in France. <<< Figure 6 about here >>> The distribution of medium-skilled workers displays some more variation. However, in all countries and time periods, medium-skilled workers are more likely to be found in exposed sectors (the Belgian data seem to suffer from a break in the series and are suspicious). In the 1970s, the share of these workers in exposed sectors ranges between 50 (Finland, Japan, UK) to more than 60 (Spain). By 2005, low-skilled workers are more likely to be found in exposed sectors at roughly comparable levels (about 60/40). <<< Figure 7 about here >>> Most variation can be found in the distribution of high-skilled workers. In the 1970s, high-skilled workers were most likely to end up in sheltered sectors (with the exception of Sweden), while the reverse is true in 2005 (with the exception of Austria). In all country-years, there is a clear trend of an increased likelihood for high-skilled workers to end up in exposed sectors. This strikes us as a potentially highly relevant labor market dynamic with consequences for the politics of the welfare state. <<< Figure 8 about here >>> In summary, the macro-level data suggest (a) that trade and FDI in services is increasingly substantial and merits the labeling of some service sectors as exposed (and not sheltered, as is traditionally the case) and (b) that the most substantial changes in the distribution of skills across exposed and sheltered sectors occurred at the level of high-skill workers. In particular, highskilled workers used to be more likely to end up in a sheltered sector in the 1970s, while the reverse is generally true in 2005.
4
Micro-level Evidence
Our theoretical framework makes a variety of predictions about the impact of skills and exposure on electoral and social policy preferences. We use the “Role of Government III” data-set (ISSP 1996) to explore the empirical plausibility of (some of) these predictions. We are interested in the determinants of locations in the competitiveness-redistribution space, and of partisanship. In terms of explanatory variables, our theoretical framework concentrates on two key traits of individuals: their skills and their exposedness to trade. Neither trait is unproblematic in terms of operationalization. We discuss our measurement choices for the dependent and independent variables in the next two subsections.
8
4.1 Dependent variables As discussed in the theoretical framework, two dependent variables are of interest: preferences over welfare state spending (in which we distinguish two possible situations – plain Robin-Hood redistribution and spending with an unemployment insurance component), and electoral preferences. We make use of a range of different questions about different types of welfare state spending and taxation policies. To correct for possible idiosyncrasies with individual survey items we conduct a principal components analysis to estimate common underlying preference dimensions. We run principal component analysis (PCA) on the following survey items •
•
•
•
• •
gov_redi5: “What is your opinion of the following statement: It is the responsibility of the government to reduce the differences in income between people with high incomes and those with low incomes.” [Q8, v42]. Answer categories (reversed): 5 Agree strongly, 4 Agree, 3 Neither agree nor disagree, 2 Disagree, 1 Disagree strongly. gov_redi4: “On the whole, do you think it should be or should not be the government’s responsibility to: Reduce income differences between the rich and poor” [Q12g, v16]. Answer categories (reversed): 4 Definitely should be, 3 Probably should be, 2 Probably should not be, 1 Definitely should not be. gov_cuts: “Here are some things the government might do for the economy. Please show which actions you are in favour of and which you are against. Please tick one box in each line. [Here:] Cuts in government spending” [Q9c, v19]. Answer categories (reversed): 5 Strongly in favour of, 4 In favour of, 3 Neither in favour of nor against, 2 Against, 1 Strongly against. gov_health: “Listed below are various areas of government spending. Please show whether you would like to see more or less government spending in each area. Remember that if you say ‘much more’, it might require a tax increase to pay for it. [Here]: Government spending: health” [Q10, v26]. 1 Spend much more 5 Spend much less. gov_educ: As gov_health, but: “Government spending: education” [v28]. gov_retired: As gov_health, but: “Government spending: old age pensions” [v30].
After rotation (oblimin, orthogonal – but the results are very similar from an oblique rotation), we obtain two factors and the factor loadings shown in Table 2. Descriptive statistics of the factors can be found in Table 3. <<< Table 2 about here >>> <<< Table 3 about here >>> One factor clearly relates to the redistribution of incomes from the top to the bottom end of the earnings distribution, and the protection of low-end earnings. We call this the redistribution factor. The other factor correlates better with the other items which all include explicit references to taxation and, in our interpretation, tap preferences for competitiveness.6 We call this the 6
Note that the gov_cuts variable turns out to be quite unique. But we are not entirely surprised by this. First of all, the question wording is – at best – unusual. It requires a respondent to process a double-negation to express his support for the welfare state (s/he needs be “(strongly) against” “cuts in government spending” to be in favor of social policy and services. This is not only very different from the other question wordings in the survey, but also almost certainly confuses respondents. It certainly confused one of us. Further inquiries into the properties of the item reveal that it does not correlate with income in a predictable way, which sets it apart from almost every other attitudinal item in the same survey: Out of 30 policy variables (all gov_* variables), only gov_cuts and four others
9
competitiveness factor. We predict each individual’s factor scores on both of these factors (using the regression scoring method). Then in the following empirical analysis we rely on these factor scores to operationalize preferences over welfare state spending and competitiveness.7 To tap partisan preferences we rely on a survey item asking respondents for which party they voted in the last election. Using a mapping developed in Cusack, Iversen and Rehm (2006) we assign each party to one of five categories, ranging – in five categories – from far left (1) to far right (5). Table 9 in the Appendix reveals this mapping. <<< Table 9 about here >>> 4.2 Independent variables As elaborated above, our theoretical framework is mainly concerned with two traits: skills and exposedness to international markets. Regarding skills, we are interested in a dichotomy into low vs. high-skilled workers (to keep things simple). The micro-level data-set we employ contains two variables coding a respondent’s education: years in school (v204) and highest educational degree (v205), a variable with seven different categories. Comparing educational systems and educational achievement across countries raises some thorny issues. We therefore decided to derive the skill information from a respondent’s occupation. To do so, we rely on a (constructed) variable which codes respondents’ occupation at the International Standard Classification of Occupations (ISCO88), which was developed by the ILO.8 The ILO defines a worker’s skill-level as “a function of the range and complexity of the tasks involved, where the complexity of tasks has priority over the range.”9 The ILO further elaborates on its construction of skill levels: “Only a few broad ‘skill level’ categories can usefully be identified for international comparisons. The 1976 version of the International Standard Classification of Education (ISCED) was used to define the ISCO-88 skill levels, but these definitions can easily be re-formulated with reference to the revised ISCED-1997. This formulation of the definitions does not mean, however, that skills can only be obtained by formal education or training. Most skills may be, and often are, acquired through experience and through informal training, although formal training plays a larger role in some countries than in others and a larger role at the higher skill levels than at the lower. For the purpose of the ISCO-88 classification system, determining how a job should be classified is based on the nature of the skills that are required to carry out the tasks and duties of the job not the way these skills are acquired. Nor is it relevant that the job incumbent may have skills not demanded by the job.”10
do not significantly correlate with income (in the whole sample; there is some variation across countries). There are other highly surprising characteristics of the gov_cuts variable (France comes out as the country where “cuts in government spending” are particularly prominent. At the same time, France is ranked 2nd after Spain in terms of embracing redistribution). 7 One unfortunate side-effect of the principal component analyses above is that the sample is restricted to respondents with non-missing values on all of the six survey items (listwise deletion). We address this issue by using imputed values on missing variables for respondents with at least one non-missing value. Fortunately, the results are pretty much the same. The results below rely on the factor scores based on listwise deletion of cases. 8 For details, see http://www.ilo.org/public/english/bureau/stat/isco/isco88/. 9 http://www.ilo.org/public/english/bureau/stat/isco/isco88/. 10 http://www.ilo.org/public/english/bureau/stat/isco/isco88/anc2.htm.
10
The ILO assigns four different “skill-levels” to eight of the nine ISCO88-1d categories.11 As is conventional, we assign the highest skill-level to ISCO88-1d group 1 (“Legislators, senior officials, managers”), which does not have an ILO-assigned level. We then simply make the two lowest skill-levels the “low skill” workers, and the two higher levels the “high skill” workers. In the whole sample, this classifies about 57% as low-skilled, and the rest as high-skilled (there is some variation across countries). Since we are interested in skills that workers can use in the labor market, the occupational skilllevels attached to the ISCO88 strike us as a plausible way to operationalize the concept. It is also, in our opinion, the single most comparable measure of skills available in the ISSP data-sets. Moreover, the occupational skill-levels allow for a straightforward dichotomization into low- vs. high-skill workers. Of course, we do not deny that there are other dimensions of skill and education that shape individual’s preferences, including their actual degree or skill specificity. In robustness checks of our uni- and multi-variate analyses (not reported) we change our operationalizations or control for some of these dimensions without significant deviations from our findings. We already dealt with the concept of exposed vs. sheltered jobs above, and it is also familiar from the trade-literature. There, exposure is usually measured in terms of trade-involvement of an individual’s sector at the industry-level. However, the ISSP data-set does not contain information on respondents’ industry of employment, and at least one of us thinks that covariates at the industry-level are not all that important for preferences formation (Rehm 2008). As with the operationalization of skill-level, we therefore measure exposure at the occupational level. To do so, we take several steps. First, we rely on the classification of sectors into sheltered and exposed sectors, as reported in the previous section (based on Theodoropoulou & Wren 2008). In a second step, we calculate the probability of an occupation (at the ISCO88-2d level) to fall into a sheltered or exposed industry, based on industry-occupation matrixes constructed from the EULFS. Pooled data (about 1995 to about 2003 for about 15 EU countries) reveal that the following occupations primarily fall into sheltered sectors (ISCO88-2d code, “name of occupational group”): • 11 “Legislators and senior officials” • 22 “Life science and health professionals” • 23 “Teaching professionals” • 32 “Life science and health associate professionals” • 33 “Teaching associate professionals” • 51 “Personal and protective services workers” • 91 “Sales and services elementary occupations” The following ISCO88-2d occupations are primarily found in exposed sectors: • 12 “Corporate managers” • 13 “General managers” • 21 “Physical, mathematical and engineering science professionals” • 31 “Physical and engineering science associate professionals” • 34 “Other associate professionals” • 41 “Office clerks” 11
http://www.ilo.org/public/english/bureau/stat/isco/isco88/publ3.htm. Throughout the analysis, we ignore the tenth ISCO88-1d group 0 “Armed Forces.”
11
• • • • • • • • • • • • •
42 “Customer services clerks” 52 “Models, salespersons and demonstrators” 61 “Market-oriented skilled agricultural and fishery workers” 62 “Subsistence agricultural and fishery workers” (not in survey sample) 71 “Extraction and building trades workers” 72 “Metal, machinery and related trades workers” 73 “Precision, handicraft, printing and related trades workers” 74 “Other craft and related trades workers” 81 “Stationary-plant and related operators” 82 “Machine operators and assemblers” 83 “Drivers and mobile-plant operators” 92 “Agricultural, fishery and related labourers” 93 “Labourers in mining, construction, manufacturing and transport”
The remaining occupation (24 “Other professionals”), which comprises less than 2% of our sample, is so heterogeneous that we feel unable to assign it to either exposed or sheltered. We drop these cases from the subsequent analysis, although we might incorporate them in future iterations of this paper. We realize that this mapping is very crude and note that it stacks the deck against finding significant effects along the lines of our expectations. In a third step we code those in public employment as being in sheltered occupations, regardless of their occupation (in the ISSP 1996 data, we do not have information on public vs. private employment for the U.S.; for the U.S., therefore, exposed vs. sheltered is purely based on occupational information). For example, a worker in occupation 71 (“Extraction and building trades workers”) is categorized as being exposed; but if s/he is publicly employed, s/he is classified as being sheltered. The idea behind this logic is that workers in exposed occupations are working under conditions of heightened competition and tough budget constraints, while workers in sheltered occupations feel the vagaries of international markets less directly. Arguably, workers in the public sector should be counted to the latter group. Our operationalization of sheltered vs. exposed is not unproblematic. It requires further robustness checks (in future iterations of the paper), and may need to be refined. For example, we may need to update the classification into exposed vs. sheltered occupations in a way that reflects cross-national variation, or we may need to use the probabilities directly (which basically leads to a continuous measure of exposure, which we could employ in the individual-level analysis). We also note that industry and occupation are conceptually different levels of analysis (Rehm 2008). However, as a first cut to explore the empirical validity of our theoretical framework we will use the operationalization into exposed vs. sheltered occupations described in this section. We also explicitly check whether this lumping of sheltered sector jobs and public employment influences our findings and are happy to report that it does not (see Table 8 in the Appendix). For presentational ease, we combine the two traits (skills and exposure) to four groups: group A (high skilled and exposed), group B (low skilled and exposed), group C (high skilled and sheltered) and group D (low skilled and sheltered). These four groups result from a cross-tab of dichotomized versions of our key explanatory variables, as Figure 9 shows. << Figure 9 about here >>>
12
Summarizing the procedure in terms of explanatory variables, we operationalize the two traits of interest by a respondent’s occupation: skill is derived from ISCO88’s skill-levels, and the distinction into exposed vs. sheltered jobs is based on an occupation’s probability to be primarily found in exposed vs. sheltered sectors. In addition, publicly employed workers are coded as “sheltered”, regardless of their occupation. We also design four groups, based on the logical intersections of these two groups. 4.3 Descriptive Results In order to explore the determinants of preferences and the preference profiles of the four groups identified above, we start with simple descriptive figures. In a first step, we want to see whether we are able to empirically recover the relationships postulated in Figure 2a or Figure 2b. To recap, Figure 2a shows our prediction on competitiveness harming social spending when there is no insurance effect. Figure 2b, in contrast, depicts the situation of redistribution spending with an insurance component. When it comes to simple bar-charts and linear fits thereof, Figure 12 and Figure 13 show the relationship postulated in Figure 2a: regardless of the skill level, those in exposed jobs are more concerned about competitiveness. Figure 14 and Figure 15 relate to Figure 2b. Apparently, people do take into account the insurance component of redistributive spending and line up as predicted from Figure 2b: there are no significant differences between exposed vs. sheltered workers at lower skill-levels, which is different at higher levels of skills. There, sheltered workers are more favorably disposed toward social (insurance) spending than their exposed counterparts. <<< Figure 12 and Figure 13 about here >>> <<< Figure 14 and Figure 15 about here >>> To corroborate the conclusion that respondents also think about the insurance effect of redistribution when they answer to the redistribution items above, we added survey items that explicitly refer to insurance to our PCA. We added the following two items: • gov_unempl: “Listed below are various areas of government spending. Please show whether you would like to see more or less government spending in each area. Remember that if you say ‘much more’, it might require a tax increase to pay for it. [Here]: Government spending: unemployment benefits” [Q10, v31]. Answer categories (reversed): 5 Spend much more to 1 Spend much less. • gov_unempl2: “On the whole, do you think it should be or should not be the government's responsibility to: Provide a decent standard of living for the unemployed” [Q12f, v41]. Answer categories (reversed): 4 Definitely should be to 1 Definitely should not be. The first item (gov_unempl) loads on both factors, and the second item – which does not contain a tax/competitiveness stimulus – clearly relates to the redistribution item. We conclude from this that respondents, in fact, also consider the insurance aspect of redistributional policies. Figure 10 summarizes these preferences in a two dimensional issue space which plots the mean values of each of our four groups on both dimension. It resembles Figure 1 and shows that – on average – people internalize a basic trade-off between redistribution and competitiveness. At least on average for all countries, the groups line up on the pareto frontier of redistribution and
13
competitiveness.12 There is potentially interesting variation across countries to be explored in future iterations of this paper, and we come back to this in the conclusion. To make it easier to spot country-differences in terms of levels, Figure 11 duplicates Figure 10 but displays the results on a common scale. <<< Figure 10 about here >>> <<< Figure 11 about here >>> 4.4 Regression Results Social scientists are notoriously bad at predicting individual’s preferences, and we are obviously no exception to this rule. But at least we want to make sure that the postulated correlations survive a set of plausible other determinants of variables conventionally employed in predicting preferences for social policies. To this end, we run a set of regressions. Do the postulated relationships between skills and exposure, on the one hand, and social policy and partisan preferences, on the other hand, survive this econometric testing? By and large, they do. To see this, Table 4 shows the results from regressing preferences for competitiveness on our variables of key interest and a set of controls. The dependent variable in Table 5 and Table 6, which are identically set up to Table 4, are preferences for redistribution and partisanship, respectively. All of these regressions lend empirical plausibility to our theoretical expectations: people in low-skilled jobs as well as people in sheltered jobs are less likely to embrace competitiveness, more likely to be in favor of redistribution and more likely to vote for left parties than their high-skilled and exposed counterparts. These correlations survive a set of conventional control variables (see models 3, 4, 7, 8), different samples (models 1-4 s. 5-8) and differing operationalizastions of our explanatory variables of interest (odd vs. even numbered models). Remarkably, they also survive the explicit inclusion of public employment as explanatory variable (see Table 8 in the Appendix). <<< Table 4 about here >>> <<< Table 5 about here >>> <<< Table 6 about here >>> <<< Table 8 (Appendix) about here >>>
12
In the figure, the size of the circles indicates the relative size of each group (relative to the other groups in each country). For example, the huge “B-circle” in Spain indicates that group B (low skilled, exposed) is very large in that country.
14
5
Conclusion
The advanced industrialized countries witnessed a dramatic shift from manufacturing economies to service sector economies over the last few decades. These changes were accompanied by skillbiased technological change. One particularly striking pattern, we argue in this paper, is the increasingly high probability of high-skilled workers to end up in jobs which are exposed to the vagaries of international markets. What are the political implications of these developments? What do they tell us about the politics of the welfare state? To get the micro-foundations straight, we map out theoretical expectations regarding the impact of skills and exposure to trade and explore them empirically. As expected, the higher someone’s skills and the more exposed someone’s job, the higher the concerns for competitiveness, the lower the support for redistributional spending, and the lower the support for left parties (ceteris paribus). These findings have potentially important implications for the politics of the welfare state. To see this, consider Figure 10 (and Figure 11) again. Let’s assume that politics happens in the competitiveness-redistribution space we map out in this figure. Let’s also assume that the four groups indentified in the figure are political actors that fight in the electoral arena and need to form coalitions to implement social policies (in a future iteration of this paper, we plan to map party positions into the same policy space). There are several sets of political implications we may want to explore in the future, exploiting the variation in the locations of the four groups in the preference space. (We also want to explain the cross-country differences of the groups’ positions in the preference space). Let us give examples, for purely illustrative purposes (this really is just written brainstorming). Changes over time On average for all countries, the four groups line up as displayed in the top-left graph of Figure 10. From the macro-analysis above we know that the relative size of these groups changed. Upskilling should have increased the number of skilled workers (groups A and C), while increasing trade in services should have increased group A relative to C. (We can only guess how the groups moved in the preference space, but the gap between low vs. high-skilled on redistributional issues should have increased due to increasingly higher returns to skills. Perhaps we could compare more with less advanced countries to get a sense of the developments over time). This implies that group A should have emerged as a significant anti-redistribution / procompetitiveness player over time. We find it somewhat plausible that groups C and B moved away from each other, potentially threatening a coalition of the low-skilled/exposed (B) with the high-skilled/sheltered (C) – both groups are in favor of redistribution, though for different reasons. Cleavages In the U.S., groups A (high-skilled and exposed) and C (high-skilled and sheltered) are fairly close to each other and distinctly separate on redistributional issues from groups B (low-skilled and exposed) and D (low-skilled and sheltered), which are fairly close to each other themselves. This suggests that cleavages evolve around redistributional issues (especially given the distance on the redistribution factor between these two camps – this can be read off the country-varying axis-labeling, or more easily seen in Figure 11) and along skill levels.
15
Contrast this with the configuration in, for example, France, Norway, and Sweden (also, Australia and the UK). In these countries, group A (high-skilled and exposed) is fairly distinct from the other three groups, and is therefore likely to be excluded from coalitions forged by the other three groups (pro-redistributional policies should be the result). In Switzerland, the configuration of the four groups in the preference space suggests that there are several possible coalitions. On competitiveness, the exposed workers, i.e. group A and B (low- and high-skilled) can agree, while group B and C share common ground in terms of redistribution. Party hegemony / Coalitions for or against the welfare state The different sizes of the four groups and their location may tell us something about whether we should expect left or right parties to dominate governments. Sweden and Norway may serve as an illustration. In these Scandinavian countries, group A is comparatively small (as a consequence of a high number of sheltered jobs, largely in the public sector). Workers in group B and D (and, to a certain degree, C) are disproportionally likely to vote for left parties, which should lead to left party hegemony. Design of welfare states Our competitiveness dimension is quite heterogeneous, and in future iterations we plan to tighten its exact meaning. But assume for a moment that the second dimension taps preferences over types of social policy spending (either in terms of areas – say education vs. unemployment – or in terms of financing – say direct vs. indirect taxation – or in terms of the degree of insurance). The coalitional dynamics underlying the welfare state could then be modeled as a fight over levels and types of redistribution, which would – in principle – allow for all sorts of different coalitions, leading to different designs of social policy.
16
6
Figures and Tables
Figure 1: Trade-off between welfare state spending and competitiveness
Competitiveness
Welfare State Spending
17
Figure 2: Hypothesized distribution of preferences
(A) Welfare State Spending with no Unemployment Insurance Function
Welfare State Spending Sheltered
Exposed
Skill Level
(B) Welfare State Spending including an Unemployment Insurance Function
Welfare State Spending Sheltered
Exposed
Skill level
18
Figure 3: Services Trade as % of GDP (OECD average)
Services Trade % GDP OECD Average Excl Lux 25 20 15 10 5
04 20
01 20
95
92
98 19
19
19
86
89 19
83
19
19
19
80 19
74
71
77 19
19
19
68 19
62
65 19
19
Ye a
r
0
Figure 4: Services Exports (modes 1 & 2) from OECD countries (1994-2005) Services Exports (modes 1&2) from AICs to the World, 1994-2005 450000
400000
350000 Transporation Travel Insurance Financial Other Business Services Personal, Cultural and Recreational Services Communications Services Computer and Information Services Construction Services Royalties and License Fees
Millions US$
300000
250000
200000
150000
100000
50000
0 1994
1995
1996
1997
1998
1999
2000
2001
2002
2003
2004
2005
year
Figure 5: Services Imports (modes 1 & 2) from OECD countries (1994-2005) Services Imports (Modes 1&2), from World into AICs, 1994-2005 500000 450000 400000
Millions US$
350000
Transportation Travel Communications Insurance Financial Computer and Information Services Other Business Services Personal, Cultural and Recreational Services Government Services Royalties and Licenses Fees
300000
250000 200000 150000 100000 50000 0 1994
1995
1996
1997
1998
1999
2000
2001
2002
year
20
2003
2004
2005
Figure 6: Shares of exposed vs. sheltered workers, low skill Low skill USA (SIC)
UK
Netherlands
Belgium
France
Spain
Germany
Austria
Finland
Sweden
Denmark
Japan
70 60 50 40 30
70 60 50 40 30
70 60 50 40 30 1970
1980
1990
2000
1970
1980
1990
2000
1970
1980
Exposed
1990
2000
1970
1980
1990
2000
Sheltered
Exposed: Traditional (AtB, C, D, E) and Dynamic (Post&Tele, Transport, G, J, K). Sheltered: Non-Dynamic (H, O, F) and Welfare (L, M, N)
Figure 7: Shares of exposed vs. sheltered workers, medium skill Medium skill USA (SIC)
UK
Netherlands
Belgium
France
Spain
Germany
Austria
Finland
Sweden
Denmark
Japan
70 60 50 40 30
70 60 50 40 30
70 60 50 40 30 1970
1980
1990
2000
1970
1980
1990
2000
1970
Exposed
1980
1990
Sheltered
Exposed: Traditional (AtB, C, D, E) and Dynamic (Post&Tele, Transport, G, J, K). Sheltered: Non-Dynamic (H, O, F) and Welfare (L, M, N)
21
2000
1970
1980
1990
2000
Figure 8: Shares of exposed vs. sheltered workers, high skill High skill USA (SIC)
UK
Netherlands
Belgium
France
Spain
Germany
Austria
Finland
Sweden
Denmark
Japan
80 60 40 20
80 60 40 20
80 60 40 20 1970
1980
1990
2000
1970
1980
1990
2000
1970
Exposed
1980
1990
2000
1970
Sheltered
Exposed: Traditional (AtB, C, D, E) and Dynamic (Post&Tele, Transport, G, J, K). Sheltered: Non-Dynamic (H, O, F) and Welfare (L, M, N)
Figure 9: Identification of groups
High
Low
Exposed (open)
Group A
Group B
Sheltered (closed)
Exposure
Skills
Group C
Group D
22
1980
1990
2000
Figure 10: Distribution of groups in the preference space (different scales)
0.4
0.2
0.2
0.1
-0.2
-0.3
D
0.5
0.4
0.5
0.5
0.5
-0.4
-0.5
Switzerland 0.7
0.2
0.6
0.6
0.5
B D
-0.5
0.0
0.5
C
0.5
C
D -0.4
0.2
0.1
0.0
-0.7
A C
-0.1
-0.8
-0.9
D -0.4
-0.2
0.0
B
-0.2
B
D
-0.3
-0.8
C
0.2
-0.8
-0.6
-0.4
-0.2
Pro Redistribution A: high skill, exposed. B: low skill, exposed. C: high skill, sheltered. D: low skill, sheltered Skill from ISCO. S(heltered): ISCO882d 11, 22, 23, 32, 33, 51, 91 OR publicly employed (not USA) Redistribution: gov_redi4, gov_redi5. Competitiveness: gov_educ, gov_health, gov_retired, gov_cuts (reversed)
23
B
A
United States
United Kingdom A
-0.5
-0.6
-0.7
-0.8
-0.9
0.0
-0.1
0.4
B D
-1.0
0.6
0.4
A
-0.3
C
0.4
0.2
0.2
-0.2
-0.2
-0.2
D
0.0
0.0
0.1
-0.2
D
A
-0.3
-0.1
C
C
Sweden B
-0.2
-0.2
0.0
-0.1
B
-0.2
C
Spain
Norway A
A
-0.3
-0.3
-0.4
B
-0.2
0.2
0.0
-0.2
-0.4
-0.6
0.8
0.6
0.4
D
0.8
0.6
0.4
0.2
0.0
New Zealand
-0.4
D
B D
-0.3
-0.4
-0.5
A
-0.4
0.2
0.0
B
C
-0.4
0.3
0.1
0.8
0.3
-0.2
-0.3 0.4
B
C
0.2
A
Ireland
0.6
0.3
0.2
C
-0.6
B -0.6
-0.7
-0.2
A
0.0
0.1
D
0.5
0.4
A
-0.6
D
Germany (West)
Germany (East)
Pro Competitiveness
B -0.4
-0.6
-0.8
0.2
0.0
-0.2
C
-0.4
-0.1
-0.2
D
-0.6
A
A
B
-0.4
C
0.6
0.4
0.0
-0.1
0.2
0.1
0.0
C
France
Canada
Australia
All countries A
-0.2
0.0
0.2
Figure 11: Distribution of groups in the preference space (common scale)
0.5
1.0
-1.0
-0.5
-0.5
B D
0.0
0.5
1.0
A
-0.5
0.0
-1.0
-0.5
-1.0
-0.5
BD
0.5
1.0
-1.0
-0.5
0.5
1.0
-0.5
-1.0 -0.5 0.0 0.5 1.0 0.5
0.0
-1.0 -0.5 0.0 0.5 1.0 1.0
-1.0
A C
-1.0
-0.5
BD
0.0
0.5
1.0
0.5
1.0
-1.0
-0.5
0.0
1.0
A C
-1.0
A C
B D
-1.0
-0.5
B
D
0.5
1.0
A
-1.0
B D
-0.5
0.0
0.5
1.0
Pro Redistribution A: high skill, exposed. B: low skill, exposed. C: high skill, sheltered. D: low skill, sheltered Skill from ISCO. S(heltered): ISCO882d 11, 22, 23, 32, 33, 51, 91 OR publicly employed (not USA) Redistribution: gov_redi4, gov_redi5. Competitiveness: gov_educ, gov_health, gov_retired, gov_cuts (reversed)
24
0.0
0.5
B
1.0
0.0
0.5
1.0
0.5
1.0
Switzerland
A C
-0.5
D
New Zealand
Sweden
B AC D
-1.0
0.5
C
Ireland
B
0.0
0.0
A
United States
C BD 0.0
1.0
Spain
United Kingdom
A
C
-1.0 -0.5 0.0 0.5 1.0
-1.0 -0.5 0.0 0.5 1.0 -1.0
C
0.5
D
Norway
A
0.0
Germany (West) -1.0 -0.5 0.0 0.5 1.0
-1.0 -0.5 0.0 0.5 1.0 -1.0
-1.0 -0.5 0.0 0.5 1.0
Pro Competitiveness
Germany (East) A C
-1.0 -0.5 0.0 0.5 1.0
CB D
B
D
-1.0 -0.5 0.0 0.5 1.0
0.0
A
France
-1.0 -0.5 0.0 0.5 1.0
-0.5
B D
A C
-1.0 -0.5 0.0 0.5 1.0
-1.0
C
Canada
-1.0 -0.5 0.0 0.5 1.0
A
Australia -1.0 -0.5 0.0 0.5 1.0
-1.0 -0.5 0.0 0.5 1.0
All countries
-0.5
C
B
0.0
D
Figure 12: Preferences for competitiveness, by skill-level and exposure (bar charts) Competitivness (principal-components factor)
-.2
-.1
0
.1
.2
All countries
S
E
S
E
lowest
S
low
E
high
S
E
highest
S(heltered): ISCO882d: 11, 22, 23, 32, 33, 51, 91 OR publicly employed (not USA)
Figure 13: Preferences for competitiveness, by skill-level and exposure (linear fit) Competitivness (principal-components factor)
-.2
0
.2
All countries
1
2
3 ISCO88 skill level Sheltered (lfit)
Exposed (lfit)
S(heltered): ISCO882d 11, 22, 23, 32, 33, 51, 91 [R only] OR publicly employed (not USA)
25
4
Figure 14: Preferences for redistribution, by skill-level and exposure (bar charts) Redistribution (principal-components factor)
-.4
-.2
0
.2
.4
All countries
S
E
S
E
lowest
S
low
E
high
S
E
highest
S(heltered): ISCO882d: 11, 22, 23, 32, 33, 51, 91 OR publicly employed (not USA)
Figure 15: Preferences for redistribution, by skill-level and exposure (linear fit) Redistribution (principal-components factor)
-.5
0
.5
All countries
1
2
3 ISCO88 skill level Sheltered (lfit)
Exposed (lfit)
S(heltered): ISCO882d 11, 22, 23, 32, 33, 51, 91 [R only] OR publicly employed (not USA)
26
4
Table 1: Distribution of FDI stock in services in developed country, by industry (1990, 2002)
1990
2002
Inward FDI stock Total Services
100
100
Electricity, gas and water
1
3
Construction
2
1
Trade
27
20
Hotels and Restaurants
3
2
Transport, Storage & Communications
2
11
Finance
37
31
Business Services
15
23
Community, Social and Personal
2
2
Other services
10
2
Unspecified
2
6
Outward FDI stock Total Services
100
100
Electricity, gas and water
1
2
Construction
2
1
Wholesale and Retail Trade
17
10
Hotels and Restaurants
1
2
Transport, Storage & Communications
5
11
Finance
48
35
Business Services
6
34
Other services
13
2
Unspecified
6
3
Source: UNCTAD World Investment Report 2004 (UNCTAD 2004: 99)
27
Table 2: Factor loadings Variable gov_educ gov_health gov_retired gov_cuts gov_redi4 gov_redi5
Factor 1 0.038 -0.163 -0.277 0.033 0.910 0.913
Factor 2 0.740 0.798 0.662 0.217 -0.113 -0.061
Uniqueness 0.452 0.337 0.485 0.952 0.159 0.163
Table 3: Descriptive statics of factors
Australia Canada France Germany (East) Germany (West) Ireland Italy New Zealand Norway Spain Sweden Switzerland United Kingdom United States All countries
mean -0.34 -0.42 0.32 0.50 -0.08 0.26 0.21 -0.54 0.12 0.50 0.16 -0.11 -0.06 -0.55 0
Redistribution min max -2.31 1.86 -2.38 1.55 -2.35 1.98 -2.24 1.81 -2.46 1.92 -2.25 1.62 -2.45 1.78 -2.38 1.56 -2.41 1.98 -2.19 1.86 -2.31 1.72 -2.33 1.82 -2.62 1.72 -2.36 1.47 -2.62
1.98
28
stdv 0.96 1.06 1.03 0.79 0.94 0.88 0.95 1.08 0.97 0.70 1.02 0.95 0.95 1.00
mean -0.25 0.27 0.51 0.03 0.32 -0.37 -0.18 -0.41 -0.04 -0.19 -0.09 0.58 -0.78 -0.06
1.00
0
Competitiveness min max -2.42 3.46 -2.35 3.70 -2.28 4.70 -2.17 2.89 -2.57 3.85 -2.50 3.02 -2.49 4.64 -2.71 3.38 -2.71 4.24 -2.49 2.57 -2.41 3.09 -2.19 4.78 -2.63 2.06 -2.56 4.24 -2.71
4.78
stdv 0.93 0.99 1.08 0.95 0.96 0.93 1.00 0.86 0.79 0.88 0.83 0.91 0.82 1.12 1.00
Table 4: Regression results: Preferences for competitiveness (1)
Dummy for low-skilled (vs. high-skilled) Dummy for exposed (vs. sheltered)
-0.139*** [0.0196] 0.127*** [0.0197]
Group A (high skill, exposed) Group B (low skill, exposed)
(2)
(3)
Group D (low skill, sheltered) Income, in 9 (national) quantiles Dummy for female Age (categories) Self Employment Country dummies Constant
yes -0.271*** [0.0320] 0.155 -13731.6 14 10398
Adjusted R2 Log likelihood Degrees of freedom Observations Note: OLS regression, robust standard errors clustered at the country-level Standard errors in brackets .* p<0.10, ** p<0.05, *** p<0.01
(5)
(6)
(7)
Preferences for Competitiveness (based on PCA) Whole sample Employees only -0.0828*** -0.154*** -0.0960*** [0.0206] [0.0224] [0.0233] 0.0871*** 0.161*** 0.107*** [0.0204] [0.0226] [0.0236] Ref cat Ref cat Ref cat -0.173*** [0.0253] -0.172*** [0.0284] -0.262*** [0.0305]
Group C (high skill, sheltered)
(4)
yes -0.120*** [0.0345] 0.155 -13729.2 15 10398
29
0.0253*** [0.00398] -0.132*** [0.0190] 0.0131** [0.00656] 0.0985*** [0.0299] yes -0.429*** [0.0507] 0.164 -13671.3 18 10398
-0.110*** [0.0260] -0.125*** [0.0290] -0.168*** [0.0317] 0.0254*** [0.00398] -0.131*** [0.0190] 0.0132** [0.00656] 0.0945*** [0.0299] yes -0.322*** [0.0515] 0.164 -13669.7 19 10398
-0.182*** [0.0290] -0.197*** [0.0310] -0.309*** [0.0353]
yes -0.274*** [0.0337] 0.153 -10397.1 14 7837
yes -0.0938** [0.0366] 0.153 -10395.7 15 7837
0.0320*** [0.00489] -0.149*** [0.0224] -0.00407 [0.00980] 0.123*** [0.0347] yes -0.403*** [0.0585] 0.165 -10339.5 18 7837
(8)
Ref cat -0.120*** [0.0296] -0.137*** [0.0318] -0.198*** [0.0367] 0.0322*** [0.00489] -0.148*** [0.0224] -0.00394 [0.00981] 0.120*** [0.0348] yes -0.282*** [0.0592] 0.165 -10338.6 19 7837
Table 5: Regression results: Preferences for redistribution (1)
Dummy for low-skilled (vs. high-skilled) Dummy for exposed (vs. sheltered)
0.407*** [0.0203] -0.169*** [0.0201]
Group A (high skill, exposed) Group B (low skill, exposed)
(2)
(3)
Group D (low skill, sheltered) Income, in 9 (national) quantiles Dummy for female Age (categories) Self Employment Country dummies Constant
yes -0.572*** [0.0325] 0.185 -13792.7 14 10398
Adjusted R2 Log likelihood Degrees of freedom Observations Note: OLS regression, robust standard errors clustered at the country-level Standard errors in brackets .* p<0.10, ** p<0.05, *** p<0.01
(5)
(6)
(7)
Preferences for Redistribution (based on PCA) Whole sample Employees only 0.261*** 0.406*** 0.270*** [0.0212] [0.0230] [0.0240] -0.136*** -0.219*** -0.162*** [0.0204] [0.0233] [0.0239] Ref cat Ref cat Ref cat 0.482*** [0.0266] 0.268*** [0.0310] 0.568*** [0.0315]
Group C (high skill, sheltered)
(4)
yes -0.793*** [0.0362] 0.187 -13781 15 10398
30
-0.0805*** [0.00398] 0.0755*** [0.0189] 0.0200*** [0.00640] -0.174*** [0.0296] yes -0.122** [0.0514] 0.226 -13524.1 18 10398
0.331*** [0.0271] 0.232*** [0.0311] 0.391*** [0.0324] -0.0808*** [0.00398] 0.0729*** [0.0190] 0.0198*** [0.00640] -0.163*** [0.0296] yes -0.307*** [0.0532] 0.227 -13513.1 19 10398
0.488*** [0.0305] 0.321*** [0.0340] 0.607*** [0.0362]
yes -0.551*** [0.0345] 0.168 -10542 14 7837
yes -0.825*** [0.0388] 0.171 -10531.3 15 7837
-0.0852*** [0.00492] 0.104*** [0.0228] 0.0319*** [0.00980] -0.201*** [0.0349] yes -0.134** [0.0602] 0.208 -10347.6 18 7837
(8)
Ref cat 0.351*** [0.0309] 0.264*** [0.0342] 0.416*** [0.0374] -0.0856*** [0.00492] 0.101*** [0.0229] 0.0315*** [0.00979] -0.191*** [0.0349] yes -0.346*** [0.0620] 0.21 -10336.9 19 7837
Table 6: Regression results: Partisan preferences (1)
(2)
(3)
(4)
(5)
(6)
(7)
(8)
Partisan affiliation (1=very left, 5 = very right) Whole sample Employees only Dummy for low-skilled (vs. high-skilled) Dummy for exposed (vs. sheltered)
-0.130*** [0.0271] 0.230*** [0.0275]
Group A (high skill, exposed)
-0.0588** [0.0281] 0.197*** [0.0287] Ref cat -0.232*** [0.0330] -0.368*** [0.0365] -0.345*** [0.0434]
Group B (low skill, exposed) Group C (high skill, sheltered) Group D (low skill, sheltered) Income, in 9 (national) quantiles Dummy for female Age (categories) Self Employment Country dummies Constant
yes
yes
0.0317*** [0.00563] 0.0257 [0.0262] 0.0340*** [0.00923] 0.274*** [0.0364] yes
-0.0689** [0.0310] 0.301*** [0.0324] Ref cat -0.153*** [0.0341] -0.326*** [0.0375] -0.245*** [0.0446] 0.0321*** [0.00563] 0.0289 [0.0262] 0.0343*** [0.00922] 0.261*** [0.0365] yes
-0.014 [0.0318] 0.258*** [0.0338] Ref cat -0.164*** [0.0373] -0.417*** [0.0399] -0.344*** [0.0523]
yes
yes
0.0261*** [0.00701] -0.0299 [0.0311] 0.0217 [0.0133] 0.233*** [0.0426] yes
Ref cat -0.103*** [0.0384] -0.370*** [0.0410] -0.248*** [0.0534] 0.0268*** [0.00699] -0.0285 [0.0311] 0.0226* [0.0133] 0.222*** [0.0427] yes
0.0246
0.0258
0.0297
0.0307
0.0318
0.0329
0.0354
0.0364
Pseudo R2
-10282.4
-10269.5
-10228.4
-10217.7
-7440.3
-7432
-7412.6
-7405.3
Log likelihood
-10282.4
-10269.5
-10228.4
-10217.7
-7440.3
-7432
-7412.6
-7405.3
459.4
490.5
542.8
568.9
391.4
420.6
426.7
453.6
14
15
18
19
14
15
18
19
8259 8259 8259 Note: Ordered probit regressions, robust standard errors clustered at the country-level Standard errors in brackets .* p<0.10, ** p<0.05, *** p<0.01
8259
6065
6065
6065
6065
Chi2 Degrees of freedom Observations
31
7
Bibliography
Alesina, Alberto, and Roberto Perotti. 1997. The Welfare State and Competitiveness. American Economic Review 87 (5):921-939. Calmfors, Lars, and John Driffill. 1988. Bargaining Structure, Corporatism and Macroeconomic Performance. Economic Policy 3 (6):13-61. Cameron, David R. 1978. The Expansion of the Public Economy: A Comparative Analysis. American Political Science Review 72 (4):1243-1261. Cameron, David. 1984. Social Democracy, Corporatism, Labour Quiescence and the Representation of Economic Interest in Advanced Capitalist Society. In Order and Conflict in Contemporary Capitalism, edited by J. Goldthorpe. Oxford: Oxford University Press. Cusack, Thomas, Torben Iversen, and Philipp Rehm. 2006. Risks at Work: The Demand and Supply Sides of Government Redistribution. Oxford Review Economic Policy 22 (3):365389. Cusack, Thomas. 1997. Partisan politics and public finance: Changes in public spending in the industrialized democracies, 1955–1989. Public Choice 91 (3):375-395. Daveri, Francesco, and Guido Tabellini. 2000. Unemployment, growth and taxation in industrial countries. Economic Policy 15 (30):47-104. Garrett, Geoffrey. 1998. Partisan politics in the global economy. Cambridge, MA: Cambridge University Press. Gatti, Donatella, and Andrew Glyn. 2006. Welfare States in Hard Times. Oxford Review of Economic Policy 22 (3):301-312. Huber, Evelyn, and John D. Stephens. 2001. Development and Crisis of the Welfare State: Parties and Policies in Global Markets. Chicago: University of Chicago Press. Iversen, Torben, and David Soskice. 2001. An Asset Theory of Social Policy Preferences. American Political Science Review 95 (December):875-895. Katzenstein, Peter. 1985. Small States in World Markets. Industrial Policy in Europe. Ithaca, NY: Cornell University Press. Moene, Karl O., and Michael Wallerstein. 2001. Inequality, Social Insurance, and Redistribution. American Political Science Review 95 (4):859-874. Moffitt, Robert, David Ribar, and Mark Wilhelm. 1998. The decline of welfare benefits in the US: the role of wage inequality. Journal of Public Economics 68 (3):421-452. Rehm, Philipp. 2008 (forthcoming). Risks and Redistribution. An Individual-Level Analysis. Comparative Political Studies.
32
Rodrik, Dani. 1997. Has Globalisation Gone Too Far? Washington, D.C.: Institute for International Economics. Rodrik, Dani. 1998. Why Do More Open Economies Have Bigger Governments? Journal of Political Economy 106 (5):997-1032. Roubini, Nouriel, and Jeffrey Sachs. 1989. Government Spending and Budget Deficits in the Industrial Countries. Economic Policy 8 (1):100-132. Roubini, Nouriel, and Jeffrey Sachs. 1989. Political and economic determinants of budget deficits in the industrial democracies. European Economic Review 33 (5):903-933. Theodoropoulou, Sotiria, and Anne Wren. 2008. Trade, Institutions and Employment in Service Economies. Presented at the Workshop: The Political Economy of the Service Transition Institute for International Integration Studies. Trinity College Dublin (16th and 17th May 2008). Tufte, Edward R. 1978. Political Control of the Economy. Princeton, NJ: Princeton University Press. - IMF, 2003 - Unctad, 2004
33
8
Appendix Table 7: Definition of skill-levels by EU-KLEMS
Austria
Belgium
High-skilled College/university degree, technical/poly-technical degree, postgraduate courses
Denmark
University and nonuniversity 2 cycles tertiary education Long cycle higher education
Spain
University graduates
Finland
Tertiary schooling (or parts there of) University graduates
France United Kingdom
University degree
Germany Italy
University graduates University graduates
Japan
University graduates
Netherlands University degree and Higher vocational Sweden USA
Postgraduates and Undergraduates College graduate and above
Medium-skilled Vocational middle schools, completed upper level of Gymnasium, vocational higher schools Higher/upper secondary education and non-university 1 cycle tertiary education Medium and Short cycle higher education plus Vocational education and training Upper secondary schooling
Low-skilled Primary education
All people up to lower secondary education Basic School
Lower secondary schooling and below Upper secondary level with or lower secondary or unknown without matriculation Higher education below No formal qualifications degree, Low intermediate, vocational education HND, HNC, BTEC, teaching No qualifications qualification, nursing qualification, A level or equivalent, trade apprenticeship, O level or equivalent, BTEC, BEC, TEC GENERAL, City & guilds Intermediate No formal qualifications No formal qualifications Higher education below degree, Intermediate vocational plus advanced education, Low intermediate Junior College and Upper Lower Secondary Secondary Intermediate vocational plus No formal qualifications advanced education and Low (Basis onderwijs) intermediate Higher and intermediate Intermediate education and vocational No formal qualifications High school and some years Less then high school and of college (but not completed) some years of high school (but not completed)
Source: EU KLEMS Growth and Productivity Accounts, Version 1.0, Part I Methodology, Table 5.3, page 28 (http://www.euklems.net/data/EUKLEMS_Growth_and_Productivity_Accounts_Part_I_Methodology. pdf)
34
Table 8: Additional regression results for robustness checks (1)
(2)
(3)
(4)
Preferences for Redistribution (based on PCA) Dummy for low-skilled (vs. highskilled) Dummy for exposed (vs. sheltered). Excludes publicly employed Dummy for public employment (US missing) Income, in 9 (national) quantiles
Log likelihood [Chi2] Degrees of freedom Observations
(8)
(9)
Partisan affiliation (1=very left, 5 = very right)
yes -0.530*** [0.0371] 0.168
-0.0851*** [0.00495] 0.103*** [0.0232] 0.0324*** [0.00987] -0.224*** [0.0346] yes -0.126** [0.0618] 0.209
0.293*** [0.0257] -0.0967*** [0.0284] 0.194*** [0.0288] -0.0844*** [0.00517] 0.0836*** [0.0244] 0.0349*** [0.0104] -0.175*** [0.0376] yes -0.241*** [0.0652] 0.207
[0.0283]
[0.0328]
[0.0358]
-10355.3
-10159.6
-9201.5
-10219.9
-10164.5
-9069.9
-7327.9 [350.2]
-7294.5 [397.8]
-6341.2 [380.8]
14
18
18
14
18
18
14
18
18
7699
7699
7011
5942
5942
5159
Self Employment
Adjusted R2 / [Pseudo R2]
(7)
0.266*** [0.0242] -0.137*** [0.0261]
Age (categories)
Constant
(6)
0.402*** [0.0232] -0.204*** [0.0255]
Dummy for female
Country dummies
(5)
Preferences for Competitiveness (based on PCA) Employees only -0.154*** -0.0961*** -0.0835*** [0.0226] [0.0235] [0.0244] 0.194*** 0.134*** 0.121*** [0.0249] [0.0259] [0.0277] -0.0345 [0.0285] 0.0320*** 0.0314*** [0.00495] [0.00505] -0.141*** -0.132*** [0.0228] [0.0236] -0.00488 -0.0153 [0.00990] [0.0103] 0.135*** 0.140*** [0.0343] [0.0361] yes yes yes -0.312*** -0.432*** -0.382*** [0.0357] [0.0602] [0.0629] 0.152 0.164 0.181
7699 7699 7011 Note: Models 1-6: OLS regression, robust standard errors clustered at the country-level Models 7-9: Ordered probit regressions, robust standard errors clustered at the country-level Standard errors in brackets .* p<0.10, ** p<0.05, *** p<0.01
35
-0.0599* [0.0309] 0.220*** [0.0346]
-0.00701 [0.0318] 0.178*** [0.0367]
yes
0.0250*** [0.00705] -0.0418 [0.0324] 0.0201 [0.0134] 0.271*** [0.0419] yes
-0.0451 [0.0349] 0.124*** [0.0425] -0.226*** [0.0432] 0.0267*** [0.00758] -0.00823 [0.0351] 0.0335** [0.0147] 0.229*** [0.0464] yes
cutpoints estimated
Table 9: Party classification scheme COUNTRY
PARTY(S) ASSIGNED TO “FAR LEFT” (LR=1)
Australia
PARTY(S) ASSIGNED TO “LEFT” (LR=2) • Australian Labour Party • Greens
Austria • Kommunistische Partei Oesterreichs (KPOE) • GA (left-wing Green Party)
Canada • Communist
• Sozialistische Partei Oesterreichs (SPOE) • Vereinte Gruene Oesterreichs (VGOE) • Alternative Liste Oesterreichs (ALOE) • Buergerinitiative Parlament (BIP) • Gruene (Greens) • New Democratic Party - NDP • Bloc Québécois - BQ • Green Party
Denmark
• Socialist Peoples Party (Socialistisk Folkeparti - SF) • Leftwing Alliance
• Social Democratic Party (Socialdemokratiet SD)
PARTY(S) ASSIGNED TO “CENTRIST” (LR=3)
PARTY(S) ASSIGNED TO “RIGHT” (LR=4)
PARTY(S) ASSIGNED TO “FAR RIGHT” (LR=5)
• Australian Democrats
• Liberal Party • National (Country) Party
• Oesterreichische Volkspartei (OEVP) • Freiheitliche Partei Oesterreichs (FPOE) [1985-1990] • LIF (Liberal)
• Freiheitliche Partei Oesterreichs (FPOE) [1991-2000]
• Liberal Party of Canada –LP • PC
• Reform Party of Canada - RPC
• Libertarian • Confederation of regions
• Radical Liberal Party (Det Radikale Venstre RV) • Centre Democratic (Centrum-Demokraterne - CD) • Christian People's Party (Kristeligt Folkeparti KrF) • Freisinnige Demokratische Partei – FDP (Radical Party)
• Liberal (Venstre - V) • Conservative Party
• Progressive (Fremskridtspartiet FP) • Danish Peoples Party
36
• One Nation
PARTY(S) ASSIGNED TO “OTHER” (LR=6) • Democratic Labour Party • Nuclear Disarmement Party
• VGOE (conservative Green Party)
• Democratic Renewal
Table: Party classification scheme (continued)
COUNTRY
PARTY(S) ASSIGNED TO “FAR LEFT” (LR=1)
PARTY(S) ASSIGNED TO “LEFT” (LR=2)
Finland • Social Democratic Party • Left Alliance • Green League France
• Parti Communiste Francais - PCF (French Communist Party) • Far left
• Parti Socialiste - PS (Socialist Party) • Green Party
• PDS • Deutsche Kommunistische Partei (DKP)
• Sozialdemokratische Partei Deutschlands (SPD) • [Buendinis 90 /] Die Gruenen • Alternative Liste
• Workers Party • Democratic Left • Sinn Fein
• Labour • Green Party
Germany
Ireland
PARTY(S) ASSIGNED TO “CENTRIST” (LR=3) • • • • • •
Centre Party of Finland Swedish Peoples Party National Coalition party Christian League Reform Group Union pour la Démocratie Francaise - UDF (Union for French Democracy/Liberal Parties)
PARTY(S) ASSIGNED TO “RIGHT” (LR=4)
PARTY(S) ASSIGNED TO “FAR RIGHT” (LR=5)
• True Finns
• Rassemblement pour la République - RPR (Rally for the Republic/Conservative)
• Front National FN (National Front)
• Christlich Demokratische Union (CDU / CSU)
• Freie Demokratische Partei (FDP)
• NPD • Republikaner
• Fianna Fail • Fine Gael
• Progressive Party
37
PARTY(S) ASSIGNED TO “OTHER” (LR=6)
• SEW • DSU
Table: Party classification scheme (continued) COUNTRY
PARTY(S) ASSIGNED TO “FAR LEFT” (LR=1)
PARTY(S) ASSIGNED TO “LEFT” (LR=2)
PARTY(S) ASSIGNED TO “CENTRIST” (LR=3)
• Christian Democratic
• Volkspartij voor Vrijheid en Democratie - VVD (People's Party for Freedom and Democracy; Liberal Party) • Calvinist State Party - SGP • Calvinist Political Alliance GPV • Calvinist Political Federation RPF
Netherlands • Groen Links GL (Green Left Party) • Socialist Party SP New Zealand
• Partij van de Arbeid PvdA (Labour Party) • Democraten '66 D66 (Democrats '66)
PARTY(S) ASSIGNED TO “RIGHT” (LR=4)
• New Labour
• Alliance • Labour Party
• New Zealand First • Social Credit
• • • •
• Red Electoral Alliance (Roed Valgallianse)
• Socialist Left Party (Sosialistisk Venstreparti) • Labour Party (Det norske Arbeiderparti) Social Democrats
• Liberal Party (Venstre) • Centre Party (Senterpartiet) • Christian Democratic Party (Kristelig Folkeparti)
• Conservative Party (Hoyre)
Norway
38
PARTY(S) ASSIGNED TO “FAR RIGHT” (LR=5)
• Centrum Democrats
PARTY(S) ASSIGNED TO “OTHER” (LR=6)
• Union 55 Plus • General Union of the Netherlands
• Green • Democrats • Social Democrats • Liberal Party
National Party ACT Christian Coalition United
• Progress Party (Fremskrittspartiet)
Table: Party classification scheme (continued)
COUNTRY
Portugal
PARTY(S) ASSIGNED TO “FAR LEFT” (LR=1)
PARTY(S) ASSIGNED TO “LEFT” (LR=2)
• UDP - Uniao Democrática Popular (Popular Democratic Union) • PSR (Revolutionary Socialist Party) • Bloco de Esquerda (Left Block)
• CDU / PCP - Coligacao Democrático Unitária (United Democratic Coalition) / Partido Communista Portugues (Portuguese Communist Party) • MRPP (Revolutionary Movement of Portuguese Proletariat) • PS (Socialist Party)
PARTY(S) ASSIGNED TO “CENTRIST” (LR=3)
• PPD, renamed PSD Partido Popular Democrático (Popular Democratic Party), Partido Social Democráta (Social Democratic Party)
• CDS, 1995 renamed PP Partido do Centro Democrático Social (Centre Social Democrats), Partido Popular (Popular Party)
• Centró Democrático y Social - CDS (Centre Democrats) • Convergència i Unió - CiU (Convergence and Union) • PNV (Nationalists from Basque) • Regional Party of Center • White
• Partido Aragon´s Regionalista - PAR (Aragonese Regionalist Party/Nationalists from Aragon) • Partidu Andalucista - PA (Andalusian Party/Nationalists from Andalucia) • Partido Popular - PP (Popular Party) • CC (Nationalists from Canaries) • UV (Regionalists from Valencia) • Right national parties
Spain • Herri Batasuna HB - Nationalists from Basque • Esquerra Republicana de Catalunya - ERC (Catalan Republican Left) • Izquierda Unida IU (United Left) • BNG (Nationalists from Galicia) • Left national parties
• Partido Socialista Obrero Espanol - PSOE (Spanish Socialist Workers Party) • Eusko Alkartasuna (Basque Solidarity) - EA-EUE Nationalists from Basque • Communist Party • Regional Party of Left • Ecologist Party
PARTY(S) ASSIGNED TO “RIGHT” (LR=4)
39
PARTY(S) ASSIGNED TO “FAR RIGHT” (LR=5)
PARTY(S) ASSIGNED TO “OTHER” (LR=6)
• IC-(E)V • Independent Liberal Group
Table: Party classification scheme (continued)
COUNTRY
PARTY(S) ASSIGNED TO “FAR LEFT” (LR=1)
PARTY(S) ASSIGNED TO “LEFT” (LR=2)
PARTY(S) ASSIGNED TO “CENTRIST” (LR=3)
• MP - Miljöpartiet de Gröna (Green Ecology Party) • S (Social Democrats)
• CP - Centerpartiet (Centre Party) • FP - Folkepartiet Liberalerna (Liberal Peoples Party) • KdS Kristdemokratiska Samhällspartiet (Christian Democratic Community Party)
• M (Conservative)
• Evangelische Volkspartei - EVP (Protestant Peoples Party) • Landesring der Unabhaengigen - LdU (Independents Party) • Christlich demokratische Volkspartei - CVP (Christian Democratic Peoples Party)
• Schweizerische Volkspartei - SVP (Swiss Peoples Party) • Liberale Partei - LIB (Liberal Conservatives) • LPS (Liberal Party) • Christlich-soziale Partei (Conservative Christian Social Party) • Freisinnigedemokratische Partei – FDP (Radical Party)
Sweden
• Vp - Vänsterpartiet (Left Party)
Switzerland
• Partei der Arbeit PDA (Labour Party) • Progressive Organisationen POCH (Progressive Organisations of Switzerland)
• Sozialdemokratische Partei - SP (Social Democrats) • Gruene Partei (Ecologists) • GB (Green Alliance)
40
PARTY(S) ASSIGNED TO “RIGHT” (LR=4)
PARTY(S) ASSIGNED TO “FAR RIGHT” (LR=5)
• Schweizer Demokraten - SD (Swiss Democrats) • Freiheitspartei der Schweiz - FPS (Freedom Party)
PARTY(S) ASSIGNED TO “OTHER” (LR=6)
• Nationale Organisationen NA (National action) • Freie Liste - FL (Free List) • LEGA
Table: Party classification scheme (continued)
COUNTRY
PARTY(S) ASSIGNED TO “FAR LEFT” (LR=1)
PARTY(S) ASSIGNED TO “LEFT” (LR=2) •
United Kingdom • Labour
USA • Strong Democrat • Not (very) strong democrat
• • • • • •
PARTY(S) ASSIGNED TO “CENTRIST” (LR=3) Social Democratic Party (SDP) Liberal Alliance Alliance (Liberal/Social Democratic Alliance) Liberal Democrats, SLD Independent (near democrat) Independent (near republican) Independent
41
PARTY(S) ASSIGNED TO “RIGHT” (LR=4)
• Conservative
• Strong republican • Not (very) strong republican
PARTY(S) ASSIGNED TO “FAR RIGHT” (LR=5)
PARTY(S) ASSIGNED TO “OTHER” (LR=6) • Plaid Cymru • Scottish Nationalists • Green Party