A Program Behavior Matching Architecture for Probabilistic File System Forensics Ying Xia, Kevin Fairbanks, Henry Owen Georgia Institute of Technology Department of Electrical and Computer Engineering Atlanta Georgia, 30332
{yxia, kevin.fairbanks, owen}@gatech.edu processes of file metadata archiving [3], and detailed monitoring of system calls [4], we are able to link together information between system calls and the results as seen from the file system. Some of the data obtained include the name of the executed program, its assigned process identification, the names and inodes of opened files, the frequency of reads and writes, and the timestamps of these actions as seen from both the operating system as well as the journal. With this information, we can construct a program behavior database of the system in question. This database makes it possible to probabilistically reconstruct sequences of events using metadata stored in the journal.
ABSTRACT Even the most secure computing system can be successfully attacked by a sufficiently motivated entity. To investigate the means of entry, the victim machine will come under the scrutiny of forensic analysis tools. In this era where system compromises occur on a regular basis, the design and implementation of operating systems should consider the necessity of computer forensics. Additionally, forensics techniques should take advantage of existing system capabilities such as the journaling feature of the Ext3 file system. With our forensics enabling architecture, we provide a means of using the metadata inherent in the Ext3 file system to reconstruct probable sequences of events that occurred during the journaling process. The reconstruction procedure is achieved by generating program behavior signatures. These signatures allow forensic investigators to perform probabilistic analysis by using information theory models to extract a more significant set of data.
The reconstruction process faces a wide variety of challenges. There are many uncontrollable factors that may increase the difficulty of this process, such as intentional obfuscation of journal data, virtual file system caching, and the inherent limitations of the journaling system. These factors make it very difficult, if not impossible, to reconstruct with complete certainty the sequence of events that have taken place on the system. Therefore, at best, we are able to perform probabilistic analysis using information theory models to extract a more significant set of data. This additional information can be invaluable to forensics investigators in their work.
Categories and Subject Descriptors K.6.5 [Computing Milieux]: Security and Protection – Unauthorized access (e.g., hacking, phreaking): D.4.6 [Operating Systems]: Security and Protection – Information flow controls
The remainder of the paper is organized as follows. Section two provides the background information about file system forensics, the Ext3 journaling mechanism, and related work in forensics and system call monitoring. Section three discusses the method for generating the program behavior database and the data analysis models. Section four contains details of the experimental setup as well as the tools used for data generation. The results of our research are presented in section five and we conclude in section six.
General Terms Security, Management, Design
Keywords Forensics, Ext3 Journal, File Systems, System Monitoring
1. INTRODUCTION Although the ability to identify and monitor various behaviors on a computer during all executions and intrusions is not a realistic expectation, it is possible to implement additional logging tools to increase the retention rate of some volatile data on the system. More often than not, the forensic investigator is left with the aftermath of a breach and thus must piece together the sequence of events with the evidence retained during the attack. One such example is the data stored in the Ext3 file system journal. In this paper, we present an architecture that can probabilistically reconstruct the sequence of events that occurred on the computer from the data resident in the journal.
2. BACKGROUND AND RELATED WORK In the field of file system forensics, there are many toolkits that are used in post intrusion analysis. Tools such as Inotify [6], which has been compiled into the kernel, allow the file system to be monitored. This work is an effort to take file system forensics one step further by providing a method to gather and analyze previously untapped data by combining live and dead data extraction techniques. This section provides a brief overview of some concepts and prior work used to develop the ideas presented in future sections.
2.1 File System Forensics
Our forensics architecture achieves this goal by correlating system calls and journaling metadata to extract a richer set of information for the creation of program behavior patterns. For example, the lack of backward pointers makes the process of determining the names from inode numbers non-trivial in Ext3. By combining the
Forensics consists of using scientific methods to determine what events have transpired on a computer. File system forensics is a subset of this practice that requires in depth knowledge of a particular implementation to overcome anti-forensic practices
4
such as the deletion and hiding of files. There exist a wide variety of forensic toolkits, both commercial and free, such as the Sleuth Kit, that aid forensic investigations in accessing the layers of abstraction employed by modern computing systems. The file system alone, for example, operates on top of a raw device that recognizes sectors. File systems such as Ext3 reside in disk partitions and normally group sectors together to form units called blocks. On top of the block layer are the categories of actual file data, file metadata, and file system metadata as well as data structures. File System Forensics Analysis [1] may be the best source of information for the following layers of abstraction in the file system: • File System • Content • Metadata • Filename • Application Each of these must be considered when performing a forensic investigation. The model that Carrier presents in [1] is also useful when comparing file systems to one another.
Figure 1. Journal data sample [1]
2.3 TimeKeeper When expertly examined, the file metadata contained in the journal can reveal detailed information about the history of the system. Although this information is not protected and can be easily manipulated, additional tools such as TimeKeeper [3] can be applied to enhance the robustness of the data. TimeKeeper allows the examination of specific files by storing metadata history to detect potential anomalies. In our research, we use this tool to preserve the volatile data in the journal log for analysis in file forensics. By doing so, we take advantage of this inherent functionality of the file system without increasing the overhead by a noticeable amount.
2.2 EXT3 Journaling The major purpose of journaling is to reduce the time it takes to bring a file system to a consistent state after it has been unmounted uncleanly, such as in the case of a power outage or system crash. This technique has recently become even more important as hard disk sizes on end user systems have expanded to the point where it could take an extended period of time for a program such as e2fsck to restore consistency.
2.4 System Call Monitoring Tools Strace, proc, and lsof are three programs that can be used to supply information similar to our monitoring of system calls. However, there are several drawbacks, which resulted in our need for a different tool. First of all, program tracing is done on a per process level and is performed in user space. Our desired method of monitoring requires system wide access of information without targeting specific processes. Second, although Proc and lsof supply file usage information about every process on the system, they also have several drawbacks. If a file is no longer in use by the process, it will not be listed with those tools. Even repeated calls to these programs will not guarantee the completeness of data. Finally, proc and lsof do not provide the required time information for comparison with the journal data.
Journaling has three well-known modes of operation: •
•
•
Journal Mode: Both file system data and metadata are written to the journal area before being written to the file system. This is the most costly, but safest form of journaling. Ordered Mode: Only metadata is written to the journal, but file data is written to disk before the journal entry is committed. Ordered mode ensures that atomicity is enforced. This mode is used by default in most Linux distributions Writeback Mode: Only metadata is written to the journal, but no care is taken to write either file system or metadata first. This can result in both the actual file system and the journal being accessed simultaneously. Writeback mode is the fastest and most risky form of journaling.
Syscalltrack [5] is a program developed for the 2.4.x Linux Kernel that allows the root user to track invocations of all system calls by hijacking them. Syscalltrack supports logging to several devices and allows the suspension of system calls based on usage. Such a program would be ideal for our research. Unfortunately, the syscall table is no longer being exported in current Linux kernels and thus this approach is now obsolete. Consequently, this software is no longer supported by the original authors.
Journaling takes advantage of a concept known as atomicity. This means that either something happened or it did not happen. Atomicity can be enforced in different ways, one of which is described below.
3. ARCHITECTURE The generation of our program behavior database requires two components: a system call database and a journal entry database. These must be created concurrently while performing standard program and code execution on the target computer. This database generation phase is referred to as the data acquisition period. The nature of our architecture allows it to be used in both a proactive or reactive manner. In the former, both the system call logging and journal data archiving must be active on the system and the database will be created during normal runtime usage. For forensics analysis solely based on the journal information, it is not required for this database to be created before the occurrence of intrusions. In fact, in most investigations, this database will
In Ext3, the journal is a fixed size circular log, which requires the use of a super block to identify the first descriptor block in the journal. It uses descriptor and commit blocks to enclose a set of operations known as transactions. The commit block is written last to ensure consistency. A revoke block is used to identify file system blocks that should not be restored. This is graphically represented in Figure 1. The Ext3 file system and its journaling behavior are discussed more thoroughly in [1], [9] and [10].
5
most likely be generated after an intrusion event on a duplicate of the original system to preserve necessary data. We do this because the journal is often a circular log and will overwrite previous entries as they are no longer needed after commitment. For post intrusion analysis, the forensic investigator will have to execute all possible permutations of programs on the target machine to generate this behavioral database. It should be noted that the use of advanced applications requires more resources which increases the complexity of this analysis, thereby increasing the time required for the forensic investigation. However, this system is designed to aid in offline forensic investigations and thus the retrieval of more extensive evidence offsets the heavier computational requirements. The database will be used to derive events from the original journal log.
3.1 System Call Monitoring As discussed in section 2, system call monitoring is not a new concept. However, in our architecture, we apply system call monitoring in a new application by using it to aid in file system forensics rather than intrusion detection. Our primary motivation for this approach is to retrieve information about the file system, such as file names of particular inodes and the sequences of syscalls performed to identify and catalog relationships.
3.1.1 Motivation for Operating System Instrumentation One of the required operating system modifications for this architecture is the insertion of monitoring code into the following system calls that deal with the file system: sys_open, sys_close, sys_read, sys_write, sys_link, and sys_unlink. Two other system calls, sys_execve and sys_fork, have to be altered as well to provide the necessary process information. Sys_creat logging is not required as it simply calls sys_open. In these system calls, we insert additional lines to export the system call data appended with a timestamp accurate to the microsecond. This is stored on a separate partition from the monitored file system to avoid the generation of irrelevant data in the journal file. The reason we chose this particular method of monitoring is to minimize our chances of introducing anomalous behavior into the runtime activities of the operating system while retrieving significant amounts data. Thus, we can state with a high degree of confidence that the data gathered via system call monitoring is almost identical to the sequences of instructions in an unaltered operating system. The only noticeable difference will be a very slight delay on the order of microseconds due to the overhead of additional logging instructions in the system calls. The second modification for the monitoring system is the increase of the kernel message buffer size. This modification, while being optional, will decrease the possibility of data loss with our particular monitoring method. Our reasons for making the aforementioned changes will be discussed below. Table 1. Syscalls and data System Calls sys_execve sys_fork
Data Process filename, process id
sys_write
Parent process id, child process id Process id, filename, inode number, file descriptor, file creations Process id, file descriptor, data
Figure 2. Forensic process
sys_read
Process id, file descriptor, data
A program behavior database will be created from a combination of system call and journal harvested metadata databases. The system call database contains information as seen from the operating system such as file opens, reads, writes, program executions, and terminations. The journaling database contains inode metadata inserted into the file system. By correlating the syscall data with the information that has been written to the file system journal, we are able to detect a range of identifying information from the programs being executed on the system. This gathered evidence allows us to identify key processes and events by examining the journal log in detail. Figure 2 presents our forensic process.
sys_close
Process id, file descriptor
sys_unlink
Process id, inode number
sys_link
Process id, new file name, inode number
sys_open
3.1.2
System Call Monitoring Architecture
For our system call logging, we take advantage of the kernel message buffer to extract information from the system calls in an ordered manner. If the kernel message buffer size is increased, the possibility of data being truncated due to a full buffer is lowered. An additional advantage of using the kernel buffer is that we can use the inherent kernel message-prioritizing algorithm to sort our data by relevancy.
6
missed by the system call monitoring due to buffer overflows caused by the archive being updated.
Inside each system call, we place a few lines of code that adds a timestamp and formats the system call data (see Table 1) into a single message. These messages are then assigned a priority level and inserted into the kernel message buffer. Next, we use the kernel-logging daemon to read the messages and write them to specified data files as text. With this extraction method, we are able to obtain the necessary time stamped events from various system calls without creating possible loops through additional file modifications. This method also avoids kernel-spacing issues.
3.3 Data Analysis We must first generate the program behavior database to empower the forensic investigators with the ability to reconstruct events based on the journal metadata. At this point in our system, we have two separate master databases containing the behavior information of various processes as they execute on the system in question. The next step is to apply our data extraction models to obtain the various program signatures for forensic reconstruction of events documented in the journal log. This is perhaps the most time consuming phase of the forensics investigation as there is often a vast quantity of data to dissect. Moreover, there are additional data modeling techniques that may be applied to these logs to create different program signatures. To demonstrate our architecture, however, we chose the methods described below.
Once the program execution phase has been completed, we export the data from the log file into a sqlite3 database for analysis (see section 3.3). For additional information about making kernel modifications, see [8].
3.2 Metadata Archiving Most modern file systems track modification, access, and change (MAC) times for files. It is not uncommon for MAC times to be used in the construction of a timeline of events that have transpired. The file system journal can serve as a source for metadata information, but due to its circular nature, historical transactions can be overwritten. Furthermore, depending on the type of journaling employed by the operating system and the types of activities that take place on a system, the rate at which that data is overwritten can vary.
3.3.1 System Call Monitoring Data Figure 3 shows a raw sample of data obtained from system call monitoring. The first column is the system call followed by the process id, timestamp in seconds and micro seconds, the file being opened, the file descriptor number, the inode of the file, and v1 for a successful open while v2 means failure to open. With this information, we can directly generate several important subset databases for data modeling.
3.2.1 Metadata Archiving Motivation
sys_open|7010|1192730750|892841|/etc/ld.so.cache|4|13747 11|v1| sys_open|7010|1192730750|892880|/lib/tls/i686/cmov/librea dline.so|-2|v2| sys_open|7010|1192730750|892970|/etc/ld.so.cache|4|13747 11|v1| sys_open|7010|1192730750|893025|/usr/lib/libedit.so.2|4|83 4021||v1| sys_open|7010|1192730750|892888|/lib/tls/i686/libreadline. so|-2|v2| sys_open|7010|1192730750|892896|/lib/tls/libreadline.so|2|v2|
In [2], there are several anti-forensic methods mentioned. One of which is the altering of MAC time information to increase the difficulty of creating a timeline. To address this issue, in [3], a method was developed that archives this data. This pool of information is not restricted to only time information as full inode structures can be captured and archived. The focus of that effort was to create a richer data set to aid in the forensic investigation of honeypots. The data set produced by this system has the advantage of being historical so it can be compared with the metadata times retrieved from a copy of the disk to draw attention to irregularities. Another benefit of this data set is that the archive of metadata allows the viewing of a greater time frame than that of the journal alone. This information can then be exported from the computer to a server to keep the archive from being tainted.
Figure 3. Raw sys_open data
3.2.2 Metadata Archiving Architecture
898630|1176638725|1192740160|1185815806|0
The metadata archiving system is implemented as a proof of concept python script that makes use of the debugfs tool to gather file system information. The major thrust behind this implementation decision was to use what was readily available in the kernel while expediting the process of gathering data. The system must process the file system super block and group descriptors in order to determine the type of block that appears in the journal. Different archival actions are then taken depending on the contents of the block. The current focus is the identification of inode tables as they appear in the journal and processing of the blocks to obtain metadata time.
898631|1176638618|1192740160|1185815806|0 2107354|1192740160|1192740160|1192740160|119274016 0 2105282|1192740160|1192740088|1192740160|0 833391|1185815764|1192740160|1185815764|0 1371410|1185817047|1192740160|1185817047|0 833068|1179869455|1192740160|1185816934|0 2072713|1185815732|1192740160|1185815732|0
In order to avoid an exponential infinite loop, TimeKeeper must be executed on a separate partition than the one that it is logging. Also, due to the system call logging previously described, the system uses an in-memory database that dumps to disk at predefined intervals. This reduces the chances of data being
1372700|1173583961|1192740160|1185815731|0 Figure 4. Raw journal data
7
The first journal-based database is obtained by applying a data clustering approach with a distance measure calculated by using the MAC and deletion time values for the inodes being considered. Currently, the distance measure is calculated using
The first database generated contains program-file relationships (PFR). In this database, we keep track of every file required for the execution of any particular process. A counter is used for every instance of the program to keep track of the number of executions. The inode number and filename of every file touched by that program is also entered into the database along with a counter showing how many times that process has accessed that particular file. This information allows us to quickly identify the library and data files required by tracking files that are read during every execution of the process. Lsof produces a similar data set without the benefit of knowing the order in which the files were accessed.
formula given below. α and β are weight factors to determine the importance of each field in the overall distance measure calculation. These values are tailored specifically to the target system for maximum accuracy and thus must be re-derived for each system. If the calculated measure for the inodes falls under a threshold T, then a relationship between the two inodes is established. It is impossible to predefine a range of values for α, β and T because they are dependant on the characteristics of the particular machine. α is used to offset the speed at which processes access files on the system. On slower systems with larger seek times for files, the value for α will be smaller to offset the increased distance in timestamps. β is dependant on the characteristics of the file system. On systems with large directories containing many files with adjacent inode numbers, β will be large. On the other hand, smaller file systems with fewer files per directory on average will have smaller β values. Thus the absolute distances between inodes are more drastic on the smaller file system. The T value will have to be determined through the testing of known identified relationship pairs on the system during the data acquisition period. In future research and experimentation, we plan to improve upon this formula with a variety of methods. More information about this can be found in section 5.4.
The second database, using only the system call information, is a time ordered behavior database (TOB). Given that most processes follow an ordered sequence of algorithms to perform certain tasks, we can develop an order of events for any particular program in terms of file accesses. For example, some programs may choose to load all the libraries in one particular directory first while others will load files as needed in no particular order. To generate this database, different instances of program execution are compared with each other to identify the similarities and differences under varying program behavior. File access orders are compared as well as the times between each file access.
3.3.2 File Journal Data Similarly, several databases can be created with just the raw journal data (see Figure 4). Along with system call monitoring, these databases are used to generate the program behavior database as well as to verify or reject detected patterns. The first column of the data is the inode number, followed by mtime, atime, ctime, and dtime.
α
∑
( time 1 − time 2 ) 2 + β
MACD
Figure 5. Data analysis procedure
8
inum 1 − inum 2
≤ Τ
keyboard and mouse actions repeatedly as some programs have a graphical aspect that requires more than just command prompt input. Cnee is a command prompt version of Xnee, and Gnee is a graphical version.
With this approach, files that are touched in a relatively short time period from each other and files with similar inode numbers will be added into the database as being “related.” As this database grows, more and more relations between files will be inserted, and files that become strongly related due to a large amount of near concurrent accesses in the system will stand out more than others. This database is called the Time Relationship (TR) Database.
4.1.2 e2fsprogs The usage of the Ext3 file system in the implementation of the prototype was a very logical decision. It is both open source and has amassed a great following. Also, e2fsprogs, which is a suite of tools used to analyze, debug, and configure an Ext2 or Ext3 file system, is available as a package in most major Linux distributions. Of the suite of tools, the dumpe2fs and debugfs tools are used by the metadata archival system. This suite of tools provides the benefit of allowing a prototype that uses file system information to be rapidly developed based on its output. The drawback is that when using e2fsprogs commands, this suite may access libraries that are not required by the invoking program.
Several further refinements can be applied to the TR Database to generate additional relationships by examining the specific MAC times that created the link between the two inodes. For example, if we repeatedly see an atime in the first file matching the mtime in a second file, we can establish a flow relationship read-write between those particular inodes. Some other relationships include read-delete, read-create, read-read, write-write, and so on. Figure 5 gives an overview of our data analysis process.
3.3.3 Dominant Feature Extraction The list of files and behaviors used to uniquely identify a process is called a “dominant feature”. This information is extracted from the TRD and PFR databases. There are times where multiple programs may share some or all library files resulting in the dominant features of one program masking that of the other, we call this phenomena data collusion. The extraction of the library files to identify dominant features is performed through analyzing the PFR database. Combining the information about the program library files and the TOB generates a time ordered dominate feature list. This step and other dominant feature extraction methods will be performed in the program behavior engine.
Dumpe2fs is a tool that is used to obtain the super block and block group information about an Ext2 or Ext3 file system. Debugfs is used to invoke an interactive shell from which several commands can be issued to troubleshoot or obtain information about a file system. The metadata archival system makes use of just one of the commands, logdump. This command returns a listing of the data in an Ext3 journal. [7]
4.1.3 Sqlite3 Sqlite3 is an open source serverless embedded SQL database. It uses a single file on the host to construct all of its database structures. As such, Sqlite3 is an excellent alternative for data storage in large applications as opposed to the creation of various customized file formats. The main goal behind the design of Sqlite3 is to make it easy to administer, operate, embed into programs, maintain, and customize when compared to large enterprise database solutions such as PostgreSQL or Oracle while maintaining simplicity. It should be noted that sqlite was not intended to replace enterprise type database solutions, but meet the needs of data storage.
The final objective of the program behavior engine is the creation of various program signatures from the dominant feature extraction routines. These signatures can fall under several categories such as program library files, program file access behavior, and time based behavior. Program library file signatures identify programs based on the library files accessed during runtime. Program file access behavior signatures identify specific methods and ordering a program uses to access files. Program time based behavior signatures identify the amount of time programs may take to perform common actions. The creation of these signatures makes it possible to uniquely distinguish program executions from the file system journal.
To meet the design goals, certain features are not available. An abbreviated list of the features normally associated with larger database systems that are not available to users of sqlite follows [11]: • High concurrency • Fine-grained access control • Stored procedures • XML and/or Java extensions
4. EXPERIMENTAL SETUP Our experimental machine is a Dell Precision 340 running Ubuntu 7.04 with a modified 2.6.20 kernel. For our purposes of demonstrating a proof of concept of this research, we choose to use the architecture to analyze the following list of common tools and editors: cp, cat, vi, emacs, qemacs, vim, and gedit. The results of this research will be presented in section five.
4.2 Operation The first step in our experiment is to create a recording for every program we wish to test. The following steps summarize the execution of the playback: • Copy the old file to a backup location. • Remove the old file using rm. • Open the editor with the filename where applicable. • Type in some sample text. • Save the file. • Exit the program.
In our experiment, we recorded actions of a user performing common tasks with the tools and replayed the recorded actions to collect data for analysis. The results discussed in this paper are the analysis of the creation and saving of a new text file using these editors. We do this to show that our framework can distinguish between various similar applications.
4.1 Tools and Scripts 4.1.1 Cnee, Xnee, and Gnee
These recordings were accomplished using Gnee configured to record the following list of events: KeyPress, KeyRelease, ButtonPress, ButtonRelease, MotionNotify, EnterNotify,
Xnee is a tool that can record and replay an X session. For our experiments, we required a method of replaying the same
9
LeaveNotify, FocusIn, and FocusOut. The total time required to conduct this experiment with all seven scenarios (cp, cat, vi, emacs, qemacs, vim, and gedit) was approximately 80 seconds. Our goal for the experiment was to execute 50-100 iterations per trial to reduce anomalous data. During the first few trials, we noticed that the system call monitoring system was losing data. We hypothesized that it was due to the overwhelming amounts of information TimeKeeper and dumpe2fs generated and thus incorporated our playback loop into the source code of TimeKeeper. Our new approach called dumpe2fs between replay iterations to reserve the kernel message buffer for only program monitoring data. This approach has proven to be successful and we were able to obtain system call and journaling data for many trial runs. Typically, a trial run of 50 iterations for each use case scenario lasted for 3 hours and generated over 600 megabytes of data.
5.1.1 Dominant Features Extraction Results The dominant feature targeted in this demonstration was the set of library and support files for each program. Using our PFR database, we compared the number of times a program used a file during execution to the number of times a program was executed. Files were sorted based on priority depending on the correlation between the file usage and program execution. Files accessed upon every program execution were labeled as a library file. Files accessed above a certain threshold (in this case 80%) were labeled as potential library files. Files with a correlation above 10% and below 80% were considered behavior files that relied on program usage. All other files were considered temporary files that were touched in only a few scenarios. Table 2 shows a subset of a file list for one program and the file categories. Table 2. Sample /bin/cat file list
5. RESULTS AND ANALYSIS In this section, we will present some of the more interesting results obtained from our experimentation. Thus far, we have successfully detected the execution of programs through the correlation of the journal data with our database via dominant feature extraction as well as program behavior signature identification. In the process, we have learned in great detail the operations of these programs and the background events that are typically obscured from the user.
Program - /bin/cat
usage
424463 - /tmp/v750125/0
1 (temp)
898622 - /usr/lib/locale/en_US.utf8/LC_CTYPE
98 (lib)
836025 - /usr/lib/gconv/gconv-modules.cache
98 (lib)
1371027 - /usr/share/locale/locale.alias
98 (lib)
1371051 - /etc/papersize
49 (behavior)
898620 - /usr/lib/locale/en_US.utf8/LC_ADDRESS
98 (lib)
5.1 Signatures In order to distinguish program behavior in the event of data collusion, additional files have to be added to the dominant feature list. Although some programs may camouflage others, the lack of a library or data file may be a telltale distinction as well. For example, although vim uses every library file cat uses, it also uses several additional library files that cat does not use. Thus,
Applying dominant feature extraction and program behavior models to the data generated in the experiment identified several unique program signatures. Several smaller programs were less readily identifiable due to data collusion, which will be discussed in section 5.2.
Figure 6. Vi program behavior example
10
notable absentee files are also appended to the set of library files for programs known to be masked by others.
False Values Versus Threshold 100
5.1.2 Program Behavior Modeling Results False Values (percent)
90
The sequence of actions for each program was examined to detect uncommon flows of events. In Figure 6, we show the behavior of vi and vim when editing a new file that was passed to the program at the prompt. This sequence of the creation and deletion of the backup files .swp and .swpx upon program execution is a unique behavior only exhibited in vi and vim. Using this pattern, it is then possible to detect the creation and editing of new files if done through these two editors.
80 70 60 50 40 30 20 10
5.1.3 Distance Measure Results
0 50
Using the TR database, we detect relationships between files that are not in the library list of the programs. In our example (see Figure 7), we first identify several key library file inodes used by each program and then examine the database to detect additional files that may have a correlation to those library files. In this example, we know that inodes 1374711 and 2075940 are a pair of files that are opened concurrently only by cat and vi. With this knowledge, we examine some of the other files that have been given a relationship to 1374711 with roughly the same number of established relationships, and we see that inodes 2075946, 836025, and 898620 have this pattern and thus are potentially related to the execution of cat and vi/vim. Examination of the PFR database confirms those files as being location files used by those processes.
60
70
80
Threshold (percent) False Positives
90
100
False Negatives
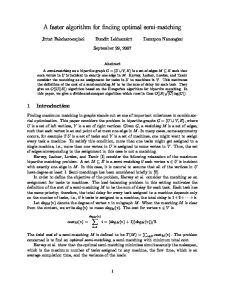
Figure 8. Dominant feature extraction accuracy We also noticed that programs with bigger dominant feature sets generated less false positives but more false negatives than programs with smaller sets. There were also more false negatives than false positives for programs with a small dominant feature set. For programs that may involve partial data collusion where they share a majority of libraries and files, such as vi and vim, the false positive value drops off sharply after the threshold is raised to be above the percentage of files that each program shares with the other. Table 3 displays the false positive and negative values for one trial of 50 executions of vi and vim. From this table, we can conclude that between 70% to 80% of the files in the dominant feature set of vim is also a subset of vi while almost 100% of the dominant feature set of vi is a subset of vim. Table 3. Vi and vim accuracy comparison Threshold - vim
Figure 7. Distance measure analysis
5.2 Analysis Models 5.2.1 Dominant Feature Extraction
False Positive #
False Negative #
50
127
0
60
89
0
70
46
1
80
0
4
90
0
49
100
0
49
50
149
0
60
149
0
70
93
0
80
49
0
90
46
1
100
0
1
Threshold - vi
Given the list of program libraries and files used in section 5.1.1, we created a database of dominant features for the sample programs we chose. With this database, we performed dominant feature extraction on a set of journal data generated from the execution of these programs. Figure 8 shows the accuracy of our method when given a varying set of thresholds. In our experiment, we define a false positive as a time segment incorrectly identified as a target program execution. A false negative is defined as a target program execution that was not identified based on the journal data. The threshold value used here is the percentage of files from the dominant feature list that must be matched for positive program identification. From this graph, we can see that as the threshold percentage is increased to 100%, the amount of false positives drops to 11% while the amount of false negatives increases from 16% to 35%. We also can conclude that for the programs and tools used in this experiment, the optimal threshold value is approximately 76%.
5.2.2 Program Behavior Matching The first type of program behavior matching we performed was the identification of read-write relationships. During a trial execution, we created, edited, copied, and deleted various test files using our chosen programs. Using the data collected with TimeKeeper, we built our TR database and extracted file pairings
11
dominant features of the hidden process are a subset of those of the hiding process. Data collusion may take place for fairly simple operations such as a copy or a move, but as more complex applications are used, such as a word processing program, it is believed the probability of this occurring will drastically decrease.
that exhibited this read-write relationship. Using this relationship, we attempted to pick out instances where a write to a file occurred and matched the program execution at that interval with the file. From Figure 9, we can see that the degree of accuracy at which our program behavior model identified read-write flow relationships between files is independent of the number of relationship links. This result is rather surprising as we expected to see a growing degree of accuracy as more relationship link pairs are identified. We hypothesize that this may be due to the large number of temporary files that certain editors such as vi create and delete as part of normal operation. This behavior may have skewed the accuracy of files pairs with a low number of relationship links.
5.3.2 Journal Resolution and Caching The syscall monitoring architecture previously described captures file system operations with sub-second resolution while the modification, access, and change times of inodes are only recorded with second resolution. This causes some of the actions seen by the syscall monitoring system to be hidden at the journal level, as several sub-second file accesses may result in just one update of the a metadata time in that particular inode. This difference in resolution is compounded by a delay between the actions observed through syscall monitoring and journal archiving. It is hypothesized that this delay is caused by the caching of I/O operations to improve overall system efficiency. Also, multiple rapid file accesses and changes may not be recorded by the journal possibly due to the caching at the vfs or the file system itself. We must overcome these challenges for fine grain signature detection to become achievable.
Currently, we are unable to perform program behavior matching on unique signatures as discussed in section 5.1.2 due to several reasons which will be discussed in section 5.3.2.
Accuracy Versus Relationship Count 100
Accuracy (percent)
90 80
5.3.3 Raw Device Access
70
It should be noted that writing data directly to the raw device could circumvent the metadata archival system. In this case, because the file system is not used, no journaling will take place. Performing this action requires in depth knowledge of the file system and the partition topology of a potential victims disk. This technique is risky and can result in file system corruption.
60 50 40 30 20 10 0 1
3
5
7
9
11
13
15
17
19
21
23
25
27
5.4 Future Work
29
5.4.1 Distance Measure Models
Number of Relationships
The work currently presented uses a simplified approach to determining the distance between two events. In order to optimize the algorithm in terms of time, and to obtain better results, an improved method of determining the distance between two events must be developed. This not only includes the method with which difference is calculated, but what factors should be considered in that calculation and with what weights. Additionally, it may be beneficial to implement machine-learning techniques in order to generate the required weight values rather than performing them manually through trial and error.
Figure 9. Read-write relationship accuracy
5.2.3 Distance Measure Calculations The previously discussed dominant features that are manifested in the journal due to the execution of a program are but one view of the information. There also exist other files that are regularly accessed. These files may not be as prominent as the dominant features, but are still telltale signs that a particular program may have been executed. The formula presented in section 3.3.2 is an attempt to capture the relationship between certain files. If files are accessed during the same period of time, there may be a relationship. In addition, files which have close inode numbers may be related as they may be in the same directory structure. It is difficult to derive a standard parameter to determine the closeness as every file system should be viewed as unique, but it is known that as the distance increases the probability of the files being related should decrease. Therefore, a threshold is set that attempts to use the distance between inodes and the time values to establish a relationship. This model should be viewed as a starting point and is by no means a final version due to several factors which can cause a skewed view point.
5.3 Short Comings
The previously discussed distance formula uses mtime, atime, ctime, and in the case of Ext3, dtime to calculate a time based distance between file system events. Currently, distance is based on the difference between one timestamp and its counterpart in another inode. In the future, diagonal relationships should be captured which for example compare mtime to atime. For Ext3, the inclusion of a comparison of dtimes may yield great inaccuracy, as normally, an inode dtime is either 0 or a timestamp. In this case the distance will either be great or nonexistent. A better technique may look at inodes close to a target inode that has been deleted to determine any type of relationship. In this case the dtime will be compared to the MAC times of the other inodes in the calculation.
5.3.1 Signature Masking
5.4.2 Conditional Probability
Signature masking due to data collusion is defined as the dominant features of one process being hidden due to those of another process being present. This can only occur if the
Currently, we have many measurements to identify the probability of individual events. In the future, we would like to improve our method to include probabilities for simultaneous and sequential
12
events by applying conditional probability methods to our analysis.
7. ACKNOWLEDGMENTS We thank Chris Lee, Yusun Chang, and the members of the Communications Systems Center at the Georgia Institute of Technology for their interest, insights, feedback, and support. We also thank the National Science Foundation and the Department of Homeland Security S&T directorate fellowship programs for supporting our research efforts. Ying Xia was supported by a NSF grant. Kevin Fairbanks was supported by a DHS fellowship.
5.4.3 Implementation Details The previously discussed TimeKeeper prototype is implemented in the form of python scripts. If this program where translated into a kernel module, then libraries resident on the system can be used to determine the file system topology instead of relying on tools from e2fsprogs. This may result in less file system traffic being detected by syscall monitoring during the collection of journal data.
REFERENCES [1] Carrier, B. File System Forensic Analysis. Addison-Wesley. Upper Saddle River, NJ. 2005.
5.4.4 Performance Measurements There are no measurements available to determine the computational impact for our architecture. This is due to the fact that the system is not optimized and the purpose of its presentation is to demonstrate the advantages of instrumenting the operating system for forensics. In the future as better models for the correlation of file system events are derived and the overall project matures, these measurements will be provided.
[2] Garfinkel, S. “Anti-Forensics: Techniques, Detection and Countermeasures” The 2nd International Conference on iWarfare and Security (ICIW), Navel Postgraduate School, Monterey, CA 2007. [3] Fairbanks, K., Lee, C., Xia, Y., Owen, H. "TimeKeeper: A Metadata Archiving Method for Honeypot Forensics.” 8th Annual IEEE SMC Information Assurance Workshop. West Point, NY. 20-22 June 2007.
6. CONCLUSION In this paper, we have presented our architecture that performs probabilistic forensics using information theory models to extract a richer set of data from the file system journal. This work provides a bridge between live and dead forensic analysis by using offline forensic processing to determine the meaning of data collected in real time. In our architecture, we applied system call monitoring to assist file system forensics rather than intrusion detection. We also employed metadata archiving to preserve historical information. This facilitates comparisons between epochs to highlight irregularities. Finally, we used the data collected from these two methods to create a program behavior database to aid in forensic investigations.
[4] Xia, Y., Fairbanks, K., Owen, H. "Establishing trust in blackbox programs." SoutheastCon, 2007. IEEE, Vol., Iss., March 2007, pp. 462-465.
We believe that instrumenting the operating system is important to our approach because it minimizes program disruption for low data disparity between the modified and original systems. Instrumenting also allows us to collect data more readily due to system wide access of relevant functions and system calls during.
[8] Love, R. Linux System Programming: Talking Directly to the Kernel and C Library. O’Reilly Media, Inc. Sebastopol, CA 2007.
[5] Keren, G., Ben-Yehuda, M. Syscalltrack, DOI= http://syscalltrack.sourceforge.net/faq.html Accessed January 22, 2008 [6] Love, R. “Kernel Korner: Intro to Inotify.” Linux Journal, November 2005, 8. [7] Ts’o, T. “Debugfs(8) – Linux man page”, DOI= http://linux.die.net/man/8/debugfs Accessed January 22, 2008
[9] Cao, M., Tso, T.Y., Pulavarty, B. & Bhattacharya, S. "State of the Art: Where we are with the Ext3 file system." Proceedings of the Ottawa Linux Symposium (OLS). 2005. pp. 69-96.
We have also shown that when given this data, the file system forensic architecture is capable of identifying the programs and tools used in the demonstration. Although the results are probabilistic, this architecture grants forensic investigators a greater sense of understanding about the events logged in the file system journal. We will continue to refine, improve, and draw additional conclusions from our research based on the experiences gained.
[10] Tweedie, S. "Journaling the (Linux) ext2fs File system." The Fourth Annual Linux Expo. 1998. [11] “Appropriate Uses for Sqlite”, Sqlite DOI: http://www.sqlite.org/docs.html Accessed January 22, 2008
13