Proceedings of IV Biennial International Workshop “Advances in Energy Studies”. Unicamp, Campinas, SP, Brazil. June 16-19, 2004. Pages 361-372 GRAPHICAL TOOL FOR EMERGY ANALYSIS: CONCEPTS AND AN EXAMPLE OF APPLICATION Cecília M.V.B. Almeida, Flávio A. Barrella and Biagio F. Giannetti(*) Laboratório de Físico-Química Teórica e Aplicada Programa de Pós-Graduação em Engenharia de Produção Universidade Paulista Rua Dr Bacelar 1212, Mirandópolis, 04026-002 - São Paulo, Brazil ABSTRACT Emergy analysis is commonly performed through a sequence that includes drawing energy flow diagrams and the construction of emergy tables. In view of the quantity and of the diversity of data in emergy tables, the interpretation of the results may be not always clear or easy. This work presents a graphical tool that allows clear and uniform representation of emergy based indicators with the aid of ternary diagrams. Ternary diagrams make possible the immediate visualization of the results of emergy analysis and the comparison between different systems or different moments of the same system. Besides exploring the intrinsic information of emergy accounting, the graphical tool allows the use of two additional approaches to assist and complement emergy analysis: (i) sensitivity and (ii) synergy of emergy (called herein symergy; meaning synergy of emergy) denominated, in this work, tool’s functionalities. It is also possible to define areas in the diagram that characterize any product or process in relation to the sustainability index: (i) region of long term sustainability, (ii) region of short term sustainability and (iii) region of non sustainability. To illustrate the use of the graphical tool, a case study found in the literature (Brown, M.T.; Ulgiati, S. Emergy Evaluations and Environmental Loading of Electricity Production Systems. Journal of Cleaner Production, v.10, p.321-334, 2002) is employed. 1. INTRODUCTION
The use of conventional economic analysis for decision-making including environmental issues, in spite of being usually accepted, doesn' t contemplate intangible benefits and costs. The evaluation of environmental aspects is quite complex and must consider a great number of factors, some of which cannot be appraised by traditional economic analysis, since it is very difficult to establish monetary values to intangible costs and benefits, such as the value of natural resources or the cost for the environment to absorb pollutants. Therefore, it is at least inconsistent to establish economic analysis as a tool to evaluate environmental issues. The environmental evaluation based on emergy analysis takes into account the exploitation rate of natural resources, the efficient use of these resources and the environmental support capacity [1]. The indicators that result from emergy analysis reflect the contribution of the economic system as well as the contributions of the environment [2-3]. These indicators can be used to assess the relationships between components of productive systems and the resources used for obtaining a given product, as they depend on the fraction of renewable and non-renewable inputs and consider the locally available inputs and those imported from outside the system. In this way, valuable information is obtained about the development and the operation of anthropogenic systems, taking into account the carrying capacity of the environment. Assuming there are no co-products, which will violate input-output balance conventions, emergy analysis can also evaluate the thermodynamic efficiency of the system, the quality of the input flows and yield of any production system and especially the interaction between the system and the surrounding environment. Several complementary studies have been accomplished [4-15], which consolidate the importance of emergy analysis and its indicators [16]. New indices and approaches have been proposed for different processes [17, 10-14, 18-20] expanding the importance of emergy analysis, but at the same time generating more analytic complexity. In this work, E-mail:
[email protected]
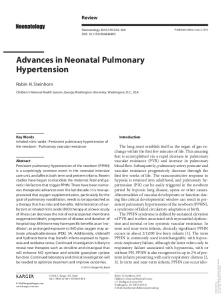
the use of a graphic tool [21-22] is proposed to represent emergy-based indices obtained from the assessment of ecological and man-made systems. The tool, developed in Visual Basic for applications, is based on phase diagrams or three components diagrams, widely used to describe equilibrium situations in which two or more phases of matter exist together in pure substances or in solutions [23], especially in the fields of metallurgy, materials science, geology, and physical chemistry. The clear and uniform representation of emergy data with the aid of phase diagrams allows visualization of the results of emergy analysis and comparison of different systems or time series evaluations of the same system. Moreover, the use of ternary diagrams allows users to explore their intrinsic properties [23] and to add two new approaches to emergy analysis: the sensitivity and the symergy (synergy of emergy, discussed below in the text). It is demonstrated that the interpretation of the results is facilitated with the use of the graphic tool, assisting decision-making. 2. METHOD Ternary diagrams offer a very efficient graphical representation for the characterization of systems, which can be described with three variables [23]. This method, extensively used in physical sciences, is based on the geometric properties of equilateral triangles. Most commonly, three fractions or proportions add to 1 (corresponding to the height of the triangle), or three percents add to 100 as presented in the figure 1a. The constant sum constraint means that there are just two independent pieces of information. Hence, it is possible to plot observations in two dimensions within the diagram. The main properties of these diagrams are the sum of the coordinates; the composition of mixtures and the proportionality, as shown in Figures 1b, 1c and 1d. 1
(a)
(b)
A
0,62
0,16 0,22 0
(c)
(d) 0,32
P
X
0,16
Q
A
B 0,44
0,22
Figure 1. Geometric properties of emergetic triangular diagrams: (a) dashed lines indicate the unitary heights; (b) the sum of perpendicular lines joining each side of the triangle to point A equal 1.0, the height of the triangle. These perpendicular lines define the point A coordinates. The dashed line, parallel to the side of the triangle, shows all points that have the same coordinate value of point A (0.22); (c) the combination between points P and Q would be represented in a point laying at any point of segment PQ. Point X shows one of the possibilities of combination. (d) any point on the line that passes through an apex would maintain the proportionality between the perpendicular joining the point to the sides of this apex. Points A and B show the proportionality (0.16/0.22 = 0.32/0.44)
A graphical tool that allies the properties of the equilateral triangle and the emergy concepts was developed in Microsoft Excel 2002 (10.2614.3501) SP-1, using the graphic capacities of Visual Basic for Applications 6.3–version 9108–VBA: Retail 6.3.0863 Forms3: 2.01. The tool is composed by two modules: (i) Data Input and (ii) Configuration and Triangular Diagram. Both modules are presented in the figure 2.
Module Analisys (Graphics) [.xls]
Data files [.eMe] Module Data Input (Tables) [.xlt]
Report (Graphics and Tables) [.xls]
Report (Tables) [.xls]
Figure 2. Software modules The emergy values of renewable (R), non-renewable (N) and economic (F) resources were defined with their relative values in relation to the output of the system (Y), according to Eqs. 1.
(a) R = R Y
(b) N = N Y
(c) F = F Y
(d) Y = Y = 1 Y
(1)
The values of EYR, EIR, ELR and SI don’t change with this procedure and can be calculated according to Eqs. 2.
(a) EYR= 1 F
(b) EIR=
F F(1 - F)
(c) ELR= 1 - R R
(d) SI= EYR = R ELR F(1 - R)
Some functionalities of the tool are presented as follows: (i) Lines of constant values of
(2)
R,
N and F , (ii) lines of the sustainability, (iii) lines of sensitivity and (iv) synergy of emergy point (symergic point) (Fig. 3).
Renewable
Renewable N = 0.1
F = 0.1
(a)
SI = 5
(b)
SI = 1 R = 0.1 Nonrenewable
Economy
Renewable
Renewable SF
SN
A
(c)
Nonrenewable
Economy
Nonrenewable
A
(d)
Economy
SR
Nonrenewable
S
B Economy
Figure 3. Emergetic triangular diagram properties: (a) Resources, where the line N = 0.1 shows the points in the diagram where the percentage of non-renewable resources equals 10% of the total emergy. The same reasoning is applied to R and F, regarding renewable resources and purchased inputs, respectively. (b) Sustainability, where the lines SI represent the points in the diagram associated to sustainability indices of 1, 2 and 5 (c) Sensitivity, where point A represent a system composed by R, N and F flows. The line SF, passing through A, show the points in the diagram where varying the F flow, the proportion between R and N flows remains constant. The same reasoning can be applied to SR and SN, which are the sensitivity lines for renewable and non-renewable inputs, respectively. (d) Symergy, where, points A and B represent two systems with their respective fluxes R, N and F. Point S, represent the composition of both systems, that is, if systems A and B were joint, the resulting system would be represented by system S, which can be located at any point of the segment AB. This diagram property can be only applied if the fluxes composing systems A and B are independent For each line R , N and F there is a selection key to activate or to disable the line. The new functionalities, which were implemented in the analysis tool, are the lines of sustainability. For the symergic point there is a selection key to activate or to disable each one of the inputs. This point represents a “composition / combination” of two or more products or processes. It uses the composition property, Figure 3d and it summarizes the behavior of a system composed by different products or processes. Two calculation methods are possible: the sum of the inputs (Eqn. 3) or a weighted average (Eqn. 4). n
(a) Rs =
n
Ri i =1
(b) N s =
n
Ni i =1
(c) Fs =
Fi i=1
where R, N and F are the input fluxes associated to point i
(3)
n
(a) Rs =
n
Ri × k i i =1
(b) N s =
n
Ni × ki i =1
(c) Fs =
Fi × k i
(4)
i=1
where R, N and F are the input fluxes associated to point i and k is the weight factor It is important to clarify that three-component systems thermodynamics use the expression “composition of mixtures” to define the composition of a system composed by the mixture of two or more systems, each of them an independent three-component system. The designation “composition of mixture” does not denote the significance of that is obtained by the combination of two systems accounted by emergy synthesis (constituted each of them of three emergy fluxes). The term synergic seems to be more appropriate as it may denote cooperative, co-acting, coactive and conjoint. Moreover, the same term also can be defined as the combined power of a group of things when they are working together, which is greater than the total power achieved by each working separately. For instance, synergic or synergetic points should represent the result of a combination of two or more industries (supplied by R, N and F fluxes) to compose an industrial sector (supplied by all its industries’ inputs). It is worthy to attention that activities that compose a sector interact forming a network, where each component should be connected with one or more components improving the network efficiency, and promoting competition for a long term empower transformation (observing the Maximum Empower principle). The same reasoning could be applied to environmental systems. In this way, the use of this property of the tool should be limited to the cases in which there is a network formation, and for these reasons, this text employs the terms symergy and symergic denoting the synergy of emergy. Figure 4 shows the screen for data input. For the graphic presentation, analysis and simulation, the tool operates with two screens.
Figure 4. Screen for data input
The options offered in the main screen are: visualization of the basic concepts, definitions and the navigation to the triangular diagram screen (Fig 5a). In this screen, dialogue boxes, menus and selective buttons allow one to choose points and lines to be presented in the triangular diagram, to load data, to print reports, to export data and graphics, to visualize information of specific points and to configure the general aspect of the diagram (Fig. 5b).
(a)
(b)
Figure 5. Analysis module screens: (a) Main (b) Diagram 3. THE CASE STUDY As a first example to illustrate the use of ternary diagrams applied to emergy accounting a case study, which evaluates six electricity production systems in Italy, we selected a case study that evaluated six electricity production systems in Italy [1]. The authors divided this case study in two papers. The first compares six different production systems using renewable energy sources (geothermal, hydroelectric, and wind plants) and nonrenewable energy sources (natural gas, oil, and coal thermal plants). The output/input energy ratio as well as the emergy-based emergy yield ratio (EYR) and environmental loading ratio (ELR)
have been used to explore and compare system performances. Generation of CO2 has also been accounted in order to evaluate a ratio of CO2 released to CO2 avoided, according to the fact that renewable power plants do not require a direct combustion and therefore release a lower amount of CO2 than a thermal plant for the same electricity output. The second paper quantifies the environmental support for dilution and abatement of process emissions, accounting for the environmental services required to dilute emissions of each process [2]. In this paper the role of environmental services in disposing of chemicals that are released after electricity has been produced is explored and a method of quantitatively determining carrying capacity is presented. Under this approach, emergy based yield indicators may decrease by 40–70% coupled to a parallel increase of a loading indicator, when the environmental services required for the dilution of pollutants are accounted for. As a consequence of including environmental services for waste assimilation, a lower sustainability is calculated for each investigated process when compared to evaluations that do not include them. Accounting for environmental services also provides a way to evaluate the carrying capacity of the environment in relation to human dominated processes. 4. RESULTS The Figure 6 presents the triangular diagram for the six electric power plants [1]. In this diagram, the plants of electric power that use different sources of energy (Eolic, Geothermal, Hydroelectric, Methane, Coal and Oil) were identified. It is clear that they form two different groups, the first formed by the electric power plants using eolic, geothermal and hydroelectric resources, which use non-fossil energy. The second group is formed by the electric power plants that use fossil fuels (methane, oil and coal). Renewable 1 3
2
1 – Eolic 2 – Geothermal 3 – Hydroelectric 4 – Methane 5 – Oil 6 - Coal
4 5 6
Nonrenewable
Economic
Figure 6. Representation of six electricity production systems with the aim of emergetic ternary diagrams The complementary article analyzed [2] accounts for the environmental services required to absorb and to dilute the by-products of the electric power plants. The mitigation strategies to suppress the by-products consider that as the economic investment in treatment processes for elimination of undesirable emissions increases, the service of the environment to dilute or to absorb these emissions will decrease. In this way, this service should be accounted together with the economic resources [2]. The indices EYR, EIR, ELR and SI under this point of view are calculated by Eqs. 5, where the renewable resources are represented by R1 and the necessary resources to absorb and to dilute the undesirable co-products are represented by R2.
(a) EYR=
R1 + R2 + N + F F + R2
(b) EIR=
F + R2 N + R1
(c) ELR=
N + F + R2 R1
Y F + R2 (d) SI= (5) N + F + R2 R1 The triangular diagram, considering the services of the environment is presented in the Figure 7, where the shift of the points can be observed when the environmental services are considered for absorption and dilution of the co-product. Renewable
(a)
Renewable
(b)
2 7
48 Nonrenewable
Economy + Environmental services
Nonrenewable
Renewable
Renewable
(c)
Economy + Environmental services
(d) 5 9
Nonrenewable
6 10 Nonrenewable Economy + Environmental services
Economy + Environmental services
Figure 7. Representation of four electricity production systems with the aim of ternary diagrams, and the use of sensitivity lines, where (a) represents the geothermal plant (point 2) and (b), (c) and (d) represent the thermoelectric plants, supplied by methane (point 4), oil (point 5) and coal (point 6), respectively. Points (2), (4), (5) and (6) do not include environmental services, R2. Points (7-10) represent the same four electricity production systems including environmental services to dilute and abate process emissions Another possibility of analysis offered by triangular diagram is presented in the Figure 8. Figure 8a represents the symergic point for the production of electric power of each plant per MW (column 2, table 1), that is, the emergetic density per unit of energy production. As can be observed with the ternary diagram, the resulting system, composed by the six energy production systems, presents an SI = 1.5, indicating that this set of systems is characterized with medium run sustainability, but has sustainable contribution to the economy [1]. In figure 8b, the Italian matrix for energy production [24] (column 3, table 1) was considered. As it can be observed, the resulting system, associated to the six energy production systems, presents an SI = 0.5, indicating that this set of systems is not sustainable in the long run [1].
Renewable
Renewable
1
(a)
1
3 2
(b)
3 2
SI = 1,5 4 56
4 56
Nonrenewable
Economy
Nonrenewable
SI = 0,5
Economy
Figure 8. Symergic point (a) Weight by MW. (b) Weight by Italian energetic matrix Table 1. Weight factors for electric production units Type of power plant Eolic Geothermic Hydroelectric Fossil fuels Methane Oil Coal
Production / (MW) 2.5 20.0 85.0 171.0 1,280.0 1,280.0
% Electricity production (Italian matrix) 0.3 0.8 27.7 71.2 4.5 33.4 33.4
Weighting factor / (MW-1) 0.400000 0.050000 0.011765 0.005848 0.000781 0.000781
5. DISCUSSION
Figure 9 presents the sustainability lines for the values 1 and 5, along with the representation of the energy production systems. The systems using nonrenewable resources are located below the line S = 1, while the systems using renewable resources are located above the line SI = 5. As pointed out by Brown and Ulgiati [1], SI indexes of less than 1 appear to be indicative of processes that are not sustainable in the long run, while processes with long range sustainability have SI indexes greater than 5. As the wind plant, located closer to the R apex, offers very high SI value (SI = 48), the diagram makes clear that, even in comparison with the hydroelectric and geothermal plants, the wind plant has longer term sustainability. Renewable 1 – Eolic 2 – Geothermal 3 – Hydroelectric 4 – Methane 5 – Oil 6 - Coal
1 3
2 SI = 5
SI = 1
4 5 6
Nonrenewable
Economic
Figure 9. Six power plants with the lines SI = 1 and SI = 5
The diagram shows also the use of the resource lines (Fig 10). It can be observed that systems 4, 5 and 6 (natural gas, coal and oil) are practically located on the line R = 0,08 which indicates the use of 8% of renewable resources. As ELR may be estimated by the quantity of renewable resources employed, it can be inferred that these three systems have similar characteristics concerning the environmental impact that they produce. The diagram shows also that all six systems are located close to the line F = 0,16. In this way, it is worthy noting that for both types of energy generation, using either renewable (geothermal, hydroelectric, and wind plants) or nonrenewable resources (natural gas, coal and oil plants), the economic investment is similar. In fact, the value of EYR is strongly tied to the quantity of purchased inputs, and all energy production systems have this index between 4,21 and 7,47, indicative of secondary or primary energy sources [1, 2]. In the same way, it can also be readily observed that hydroelectric and geothermal plants have similar environmental loading, despite the difference in their EYR values. Renewable 1 R = 0.68 ELR = 0.47
3
F = 0.16 EYR = 6.25 EIR = 0.19
2 SI = 5
N = 0.69
SI = 1
4 5 6
Nonrenewable
R = 0.08 ELR = 11.5
Economic
Figure 10. Six power plants with lines R, N e F The requirement for environmental services to effectively recycle emissions translates into the need for a suitable support area for each process. The shift of the points that represent each system on the sensitivity lines is in agreement with the equations proposed by the authors [2]. Accordingly, the shift in direction to the bottom of the diagrams indicates clearly an increase in the environmental loading of all four systems. The points of symergy, when the unit of electric power production (MW) is considered, is positioned in a point with sustainability index is equal to 1.5 (Fig. 8). It is worth pointing out that the calculations of the sustainability index for the symergic point are only valid when the absolute values of the emergy of each resource are used. In the case were the current matrix of energy production of Italy was used, the symergic point has a sustainability index 0.5 in the non-sustainability area. Then, the current Italian system has a simergy point that equates to a sustainability index of 0.5 and should they employ alternative sources of production in the future, the change in simergy point could help to interpreted progress toward sustainability. 6. CONCLUSIONS
Adopting emergy based ternary diagrams provides a better visualization of the actual contribution of given inputs and the global sustainability of production processes and especially industrial sectors. Ternary diagrams allow one to rank and to assess significant differences that can be immediately evaluated. The use of the triangle based on emergy accounting and emergy indices to assess production processes and industrial sectors permits, not only to evaluate the actual situation of a given process, but also to identify
critical parameters that may be changed to improve the environmental performance of the whole system. The triangle properties, especially the sensitivity lines and the symergic point, complement emergy based analysis and permit monitoring the present state of a system by means of well-defined sustainability indicators and forecasting the system’s behavior according to changes in its driving forces. With the use of sensitivity lines, one can assess a process; identify the main driving force that will enhance its sustainability, to diminish the environmental loading and to evaluate the need for economic investment or change of inputs. It is possible to visualize the effects of any economic or technological change and to determine the real consequences of these actions. For example, if emergy is invested in removing emissions using technological solutions, this emergy can be accounted and the position of the point will change in the interior of the triangle. Analogously, if environmental services are needed to absorb and dispose the same emissions, performance of a production process becomes more time and location dependent. When the free services of the environment are accounted [2], a shift of the point in the diagram will be also noticed, showing the actual condition of the system under evaluation. The introduction of the symergic point permits investigation. The calculation of the symergic point, taking into account the production capacity of each component of an industrial sector, allows one to evaluate not only the sector as a whole, but principally to identify the processes with inferior environmental performance and areas where investment is necessary. The best alternatives can be simulated and analyzed. In the decision making process regarding sustainability of economic development, governments and society will have a powerful tool to establish policies and to choose alternatives concerning the environment. Emergy based ternary diagrams may well be seen as progress compared to methods that result in a list of interventions or an impact score profile. Such a tool for graphical analysis allows a transparent presentation of the results and may serve as an interface between emergy scientists and decision makers, provided the meaning of each line in the diagram is carefully explained. ACKNOWLEDGEMENTS
The authors thank the support from Vice Reitoria de Pós Graduação e Pesquisa da Universidade Paulista. The presented tool, still in its initial phase of development, needs to be tested, revised and altered. The tool is available by request to the authors. Any collaboration and criticisms that may help to improve it are welcomed. Special thanks are addressed to Dr. Corrado Giannantoni, Dr. Mark T. Brown and Dr Matt Cohen for their valuable comments. References [1] Brown MT, Ulgiati S. Emergy Evaluations and Environmental Loading of Electricity Production Systems. Journal Cleaner Production 2002;10:321-334. [2] Ulgiati S, Brown MT. Quantifying the environmental support for dilution and abatement of process emissions – The case of electricity production. Journal Cleaner Production 2002;10:335-348. [3] Odum HT. Environmental Accounting – EMERGY and Environmental Decision Making. Ed. John Wiley & Songs Ltd. 1996, 370p. [4] Fath BD, Patten BC, Choi JS. Complementarity of Ecological Goal Functions. Journal Theory. Biological 2001;208:493-506. [5] Bakshi BR. A thermodynamic framework for ecologically conscious process system engineering. Computers and Chemical Engineering 2000;24:1767-1783. [6] Bastianoni S, Marchettini N. Emergy/exergy ratio as measure of the level of organization of systems. Ecological Modelling 1997;99:33-40.
[7] Bastianoni S, Marchettini N. Environmental cost and state: the problem of adiabaticity in the emergy value. Ecological Modeling 1996;90:33-37. [8] Patten BC. Network integration of ecological external principles: exergy, emergy, power, ascendancy, and indirect effects. Ecological Modeling 1995;79:75-84. [9] Jörgensen SE, Nielsen SN, Mejer H. Emergy, environ, exergy and ecological modeling. Ecological Modeling 1995;77:99-109. [10] Popp J, Hoag D, Hyatt DE. Sustainability indices with multiple objectives. Ecological Indicators 2001;1:37-47. [11] Manoliadis OG. Development of ecological indicators-a methodological framework using compromise programming. Ecological Indicators 2002;2:169-176. [12] Ronchi E. Federico A, Musmeci F. A system oriented integrated indicator for sustainable development in Italy. Ecological Indicators 2002;2:197-210. [13] Barrera-Roldán A, Saldívar-Valdés A. Proposal and application of a Sustainable Development Index. Ecological Indicators 2002;2:251-256. [14] Spangenberg JH. Environmental space and the prism of sustainability: frameworks for indicators measuring sustainable development. Ecological Indicators 2002;2:295-309. [15] Federici M, Ulgiati S, Verdesca D, Basosi R. Efficiency and sustainability indicators for passenger and commodities transportation systems. Ecological Indicators 2003;3:155-169. [16] Ortega E. Índices emergéticos. In Marques JF, Skorupa L, Gusman JM. Ferraz (Editores). Indicadores de Sustentabilidade em Agroecossistemas. Embrapa-CNPMA, Jaguariúna,SP, 2003. Capítulo de livro publicado. [17] Ulgiati S, Brown MT, Bastianoni S, Marchettini N. Emergy-based indices and ratios to evaluate the sustainable use of resources. Ecological Engineering 1995;5:519-531. [18] Seager TP, Theis TL. A uniform definition and quantitative basis for industrial ecology. Journal of Cleaner Production 2002;10:225-235. [19] Hui Yang, Yourun Li, Jingzshu Shen, Shanuing Hu. Evaluating waste treatment, recycle and reuse in industrial system: an application of the eMergy approach. Ecological Modeling 2003;160:13-21. [20] Geber U, Björklund J. The relationship between ecosystem services and purchased input in Swedish wastewater treatment systems – a case study. Ecological Engineering 2002;19:97-107. [21] Jacoson R. Microsoft Excel 2002 Visual Basic for Applications Passo a Passo. Makron Books 2002, 326p. [22] Roos N. Visual Basic for Windows Versão 3.0. Ed. Makron Books, 1994, 390p. [23] Castellan GW. Físico Química 1. Livros Técnicos e Científicos Editora S.A 1984; 465p. p.363-365: Diagrama de Fases. [24] Pubblicazione della Presidenza del Consiglio dei Ministri - Dipartimento per l’Informazione e l’Editoria Direttore: Mauro Mais - Coordinamento editoriale Augusta Busico - Stampa e diffusione Istituto Poligrafico e Zecca dello Stato S.p.A. Relatório. Salário, Roma, 2003.