Application Communities: Using Monoculture for Dependability Michael E. Locasto, Stelios Sidiroglou, and Angelos D. Keromytis Network Security Lab, Computer Science Department, Columbia University {locasto, stelios, angelos}@cs.columbia.edu Abstract Artificial diversity is one method for mitigating the security risks of software monoculture. Introducing diversity increases resilience by obfuscating the system parameters an attacker must control for a successful exploit. We take a different approach to resilience and introduce the concept of Application Communities (AC): collections of independent instances of the same application that cooperatively monitor their execution for flaws and attacks and notify the community when such events are detected. We propose a set of parameters that define an AC and explore the tradeoffs between the minimal size of an AC, the marginal overhead imposed on each member, and the speed with which new faults are detected. We provide a sketch of both analytical and experimental results that show ACs are feasible for current applications: an AC of 15,000 members can monitor Apache for new faults with a 6% performance degradation for each member.
1 Introduction Software monoculture has been identified as a major problem for networked computing environments [7, 6, 12]. Monocultures act as force amplifiers for attackers, allowing them to exploit the same vulnerability across thousands or millions of instances of the same application. Such attacks have the potential to rapidly cause widespread disruption, as evidenced by several recent incidents. However, creating a large number of different systems manually [1] not only presents certain practical challenges but can result in systems that are not diverse enough [4]. As a result, research has focused on creating artificial diversity by introducing “controlled uncertainty” into system parameters that the attacker must govern in order to carry out a successful attack. Such parameters include the instruction set [2], the high-level implementation [9], the memory layout [3], and the operating system interface [5], with varying levels of success [10]. However, diversity creates its own set of problems involving configuration, man-
agement, and certification of each new platform [13]. In certain cases, such environments can decrease the overall security of the network [8]. Little attention has been paid to the question of whether a large, homogeneous software base can improve security and reliability relative to a single isolated application instance. Given a large number of autonomous application instances, is it possible to employ a collaborative distributed scheme that improves overall group security? To answer this question, we introduce the concept of an Application Community1 (AC), a collection of autonomous application instances running across a wide area network. The members of an AC collaborate in identifying previously unknown flaws or attacks and exchange information so that failures are prevented from recurring. Individual members may succumb to new flaws; however, over time the AC converges to a state of immunity against that specific fault. The system learns new faults and adapts to them, exploiting the AC size to achieve both coverage (in detecting faults) and fairness (in distributing the monitoring task). This definition raises several questions. First, is the approach feasible and, if so, for what types of faults? Second, how expensive can the monitoring, coordination, and reaction mechanisms be, and is it possible to share the burden equitably across the AC? Third, what is the performance impact of the additional computation on individual members? Fourth, how small can an AC be to achieve coverage and fairness at the same time? Fifth, how robust is this scheme in the presence of mutually untrusted (or subverted) participants? This paper does not answer all of these questions, although directions for future work are outlined. Instead, we provide an analysis of the parameters that govern an AC and apply it to a prototype AC using our Selective Transactional EMulator (STEM) [11] for both fault-monitoring and immunization. AC members emulate different “slices” of the application, monitoring for failures such as buffer overflows or illegal memory accesses. When a fault is detected, information about the fault is transmitted to the rest of the 1 The term first appeared in the title of the DARPA Application Communities Workshop, in October 2004.
AC so they can also supervise the code area containing the fault. Furthermore, members that have succumbed to the fault can be reconstituted with the appropriate fix. These measures prevent the AC from continuously degrading. STEM STEM is an x86 emulator that can be selectively invoked for arbitrary code segments, allowing us to mix emulated and non-emulated execution inside the same process. The emulator lets us (a) monitor for the specific type of failure prior to executing the instruction, (b) undo any memory changes made by the code function inside which the fault occurred, and (c) simulate an error return from said function. One of our key assumptions is that we can create a mapping between the set of errors and exceptions that could occur during a program’s execution and the limited set of errors that are explicitly handled by the program’s code. In a series of experiments using a number of server applications, we showed that our “error virtualization” mapping holds for more than 88% of the cases we examined. Testing with real attacks against Apache, OpenSSH, and Bind, we showed that our technique can be effective in automatically protecting against zero day attacks (attacks that exploit a previously unknown or unpatched vulnerability). Although full emulation is prohibitively expensive (a 30-fold slowdown), using selective emulation imposes between a 1.3X and 2X overhead, depending on the size of the emulated code segment and assuming the fault is localized within a small code region. Due to space limitations, the reader is referred to [11] for details. Our analysis indicates that AC’s are an achievable goal. A moderately sized application (about 200 functions) with a normal distribution of faults requires an AC of about 17,000 members. Our experimental evaluation shows that an AC of size 15,000 can execute Apache with a performance degradation of only 6% at each member. An AC of 15 hosts can run Apache with a performance degradation of approximately 73%.
2 Analysis The primary contribution of this paper is an analysis of the properties that govern the AC. We also consider the problem of distributing work to the AC members and the probability of catching new faults by duplicating monitoring responsibilities. We formalize the notion of total work in the AC, W , by examining the cost of executing discrete slices of the application. Assuming a set of functions F that comprise an application’s callgraph, we denote the ith member of F as fi . The cost of executing each fi is a function of the amount of computation present in fi (we call this component xi ) and the amount of risk in fi (we denote this risk as vi ). The calculation of xi can be driven by at least two metrics: oi , the number of machine instructions executed as part
of fi , or ti , the amount of time spent executing fi . Each metric has advantages and drawbacks. For example, while oi is an intuitive work unit, there is a clear difference in computation between the same number of different types of instructions (e.g., logical operations and floating point operations). On the other hand, using only ti can obscure the effects of nondeterminism or interaction with other systems even though it may provide a more realistic sense of system response. Both oi and ti can vary as a function of time or application workload according to the application’s internal logic. For example, an application may perform logging or cleanup duties after it passes a threshold number of requests. Future work can explore functions that approximate xi ’s value at a given time for either metric. The risk factor vi is somewhat harder to characterize, as it is more likely to vary during runtime, and it is not clear how to classify risk in terms of execution time or number of machine operations. Its purpose is to weight a function such that more members monitor it. We approximate the risk by a simple scaling factor α based on a statistical measure of vulnerability2. Since other measures, such as static source code analysis tools, may be used, exploring the range of risk assessment metrics is interesting future work. We provide a cost function in two phases. The first phase calculates the cost due to the amount of computation for each fi . The second phase normalizes this cost and applies the risk factor vi to determine the final cost of each Pnfi and the total amount of work in the system. Let T = i=1 xi . If we let C(fi , xi ) = xTi ∗ 100, then we can normalize each cost by grouping a subset of F to represent one unit of work. Membership in this subset can be arbitrary, but is meant to provide a flexible means of defining what a work unit translates to in terms of computational effort. A good heuristic is to group the k lowest cost functions together and declare the sum of their work as the base work unit, Z. Every other function cost is normalized to Z, and ri represents the relative weight of each fi . We must also account for the measure of a function’s vulnerability. We can treat vi as a discrete variable with a value of α (where α can take on a range of values according to the amount of risk): � α if fi is vulnerable, α > 1; (1) vi = 1 if fi is not vulnerable. Given vi for each function, we can determine the total amount of work in the system and the total number of members needed for monitoring: W = Nvuln =
n X
vi ∗ r i
(2)
i=1
Work Distribution After each AC member has calculated the amount of work in the system, work units must 2 http://serg.cs.drexel.edu/projects/cosak/
P (AC detect) =
N X 1 ∗ ki N i=1
(3)
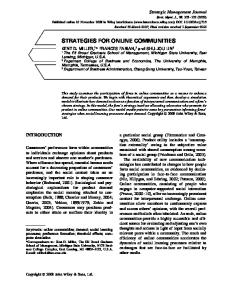
P 1 As each ki goes to 100%, Equation 3 becomes N i=1 N , N or N , a probability of 1 that the fault is detected when it first occurs. The worst case in terms of performance is the best case in terms of rapid detection and requires N ∗ 100% coverage. Analytical Results Our simulations explore the influence of several parameters: (a) the size of the application (in number of functions), (b) the distribution of work between functions, (c) the level of work present in each func-
Progression of New Fault Detection Probability 1
0.8
Individual Detection Rate
be distributed. In the simplest scenario, a central controller assigns each node approximately W N work units. A more robust distribution method would be for each member to determine their own work set. Each member can iterate through the list of work units, flipping a coin weighted with the value vi ∗ ri . If the result of the flip is “true” then the member adds that work unit to its work set. An alternative representation is to have a list of n ∗ W slots. Each function is represented by a number of entries in this list (e.g., vi ∗ri ). Every member iterates through the list, tossing a fair coin. If the coin is “heads” then the AC member will monitor the work unit (function) during a time slice. Since heavily weighted functions have more entries in the list, they will be covered by a greater number of members. A member stops when its total work reaches W N . Such an approach offers statistical coverage of the application. A more elegant method of work distribution is possible; since a full treatment of it is beyond the scope of this paper, Appendix A provides an overview. Overlapping Coverage While full coverage means that every application slice is being monitored for the given time unit, it does not mean that every AC member’s individual application is being fully monitored. Consider the situation where Alice monitors function fi and Bob monitors function fj . If fi contains a fault, Bob will miss it. Even though the community may catch the fault (by virtue of Alice’s willingness to monitor fi ), there may be members that have not yet detected the fault (i.e., Bob). There is a tradeoff between the level of individual coverage and how quickly the AC identifies a new fault. If AC members monitor more than their share, then we have increased coverage and made sure that the fault is detected as quickly as possible. Assuming a uniform random distribution of new faults across AC members, the probability of a fault happening at a member k is: P (fault) = N1 . Thus, the probability of k detecting a new fault is the probability that the fault happens at k and that k detects the fault: P (fault at k ∧ detection) = N1 ∗ ki , where ki is the percentage of coverage at k. The probability of the AC detecting the fault is
0.6
0.4
0.2
0
0
2
4
6
8
10
AC size
Figure 1. Rate of detection varies with AC size. Each
line represents a member-local coverage level in 10% increments, with 10% being the bottom curve. Note how detection degrades as the AC size grows: each member is only doing a constant amount of extra coverage. However, when every member performs 100% local coverage, they regain the best chance to detect the fault, and achieve a community probability of 1 that the fault is detected when it first occurs. For example, an AC of size 2 with each member doing 100% coverage gives each member a probability of 21 in detecting the fault, which is the probability that the fault happens to that member.
tion, and (d) the policy for determining each function’s α score. We simulate applications with sizes that range from 20 to 20000 functions. The level of work for each function ranges from 50 to 50000 work units. We examine three types of distributions of ri . The even distribution defines an equal work level for every function. The norm distribution is a “normal” distribution centered on an average work level value. The skew distribution sets the cost of most functions relatively low, but includes a few functions that account for a large part of the execution cost. We determine α according to two policies: exp and flat. The flat policy applies a static factor of 10 for every function deemed vulnerable. The exp policy exponentially increases the value of α for “more vulnerable” functions. Every function is assigned a default α value of 1. For both policies, we determine a function’s risk score by examining the distance of the function (in the callgraph) from a read() system call, using the heuristics of the COSAK project. Figure 2 shows the relationship between a program’s size and the AC workload. While the values for workload are quite large, they are based on a program where each function performs about 50000 work units. Our simulations for smaller workloads show the same relationship with lower total cost.
Slice size 10.34 5.24 0.25 0.14 0.04 0.01
We also consider a more realistic case for an Apache-like application of medium size (200 functions) with a normal distribution of xi . A flat policy for determining α causes W to scale from 2020 to 16897. Comparison of Actual and Weighted Workloads 1e+11
unweighted workload (norm) unweighted workload (even) unweighted workload (skew) weighted workload (norm-exp) weighted workload (even-exp) weighted workload (skew-exp) weighted workload (norm-flat) weighted workload (even-flat) weighted workload (skew-flat)
1e+09
Number of servers 15 30 635 1135 3973 15893
Table 1. Work-time quantums and their effects on Apache performance and AC size
1e+08
1e+07
1e+06
100000
10
100
1000 10000 100000 program size (# of functions)
1e+06
1e+07
Figure 2. A logscale comparison of workloads given a
vulnerability policy. Note that the raw values are quite high, but are drawn from data that assumes a massive workload value (50000). More important is how the relationship between program size and workload is affected by the choice of vulnerability policy.
while the size of the AC grows to 15893. These results are encouraging and closely follow the intuition in Section 2. Figure 3 illustrates the effect of varying the vulnerability index on the size of the community for 100% coverage. This example doubles the number of servers required to cover an α region. We start with the case where 25% of the code is considered potentially vulnerable and increment the α value until the entire code base is covered. As expected, when a higher percentage of the code base is deemed vulnerable, the community needs to be larger to realize fair coverage. The effect on Apache performance is linear despite an aggressive protection policy. Our experiments demonstrate that an AC can alleviate the problems associated with using an invasive protection mechanism by distributing work.
3 Evaluation
1000
Reqs/sec Number of servers with alpha at 20% 50% 75% 100%
800 reqs/sec
In this section, we quantitatively measure the tradeoffs presented in Section 2. Measurements are conducted using Apache as the protected application and STEM as the monitoring and remediation component. A detailed analysis of Apache’s runtime characteristics was obtained by running a profiled version against a set of test suites and examining the call graph generated with gprof and Valgrind. The graph was analyzed in order to extract the time spent doing work for each function. Using the corresponding costs, we evaluate Apache’s performance in requests per second for 10000 requests at a concurrency level of 5 for 100 trials. As illustrated in Table 1, we examine the use of a variety of work-time quantums on raw Apache performance and coverage. As expected, emulating large slices using STEM translates into lower performance for each participating member but requires the smallest community size for 100% coverage. Using the largest work-time quantum translates into a performance degradation of 73% per member and an AC size of 15 members. As the slice size is reduced (using a less expensive function as the base), the performance overhead per member is decreased at the cost of a larger community. For the smallest work-time quantum, a performance overhead of 6% is experienced per member
STEM: Evaluation
600
30000 25000 20000 15000
400
10000
200 0
35000 Number of servers
W (size of workload)
1e+10
Requests/sec 148 (27%) 333 (62%) 380 (70%) 497 (92%) 471 (87%) 506 (94%)
5000 1
10
100 Slice Size
1000
0 10000
Figure 3. Influence of the vulnerability index on AC size and performance.
4 Conclusions The growing concern about computing monoculture has engendered a body of research focused on increasing artificial diversity. Introducing diversity is no easy task, and it
is often hampered by the complexity of extra management. While we actively research the use of artificial diversity, this paper contravenes the idea of monocultures as dangerous and introduces the concept of Application Communities. We provide a method for exploiting the resources available in large monocultures to provide protection for each community member. As faults are detected, members can proactively monitor code areas containing the faults to prevent further failures, and members who have succumbed to the fault can be restarted with the protection mechanisms in place. Our experimental and analytical results show that members of an AC can reasonably deploy our monitoring framework STEM and collaborate to share the overhead of its protection mechanisms, thus inoculating the community at the cost of a few failed members.
References [1] A. Avizienis. The n-version approach to fault-tolerant software. IEEE Transactions on Software Engineering, 11(12):1491–1501, 1985. [2] E. G. Barrantes, D. H. Ackley, S. Forrest, T. S. Palmer, D. Stefanovic, and D. D. Zovi. Randomized Instruction Set Emulation to Disrupt Binary Code Injection Attacks. In Proceedings of the 10th ACM CCS, pages 281–289, October 2003. [3] S. Bhatkar, D. C. DuVarney, and R. Sekar. Address Obfuscation: an Efficient Approach to Combat a Broad Range of Memory Error Exploits. In Proceedings of the 12th USENIX Security Symposium, pages 105–120, August 2003. [4] S. Brilliant, J. C. Knight, and N. G. Leveson. Analysis of Faults in an N-Version Software Experiment. IEEE Transactions on Software Engineering, 16(2), February 1990. [5] M. Chew and D. Song. Mitigating Buffer Overflows by Operating System Randomization. Technical Report CMU-CS02-197, Carnegie Mellon University, December 2002. [6] D. E. Geer. Monopoly Considered Harmful. IEEE Security & Privacy, 1(6):14 & 17, November/December 2003. [7] G. Goth. Addressing the Monoculture. IEEE Security & Privacy, 1(6):8–10, November/December 2003. [8] V. Prevelakis. A Secure Station for Network Monitoring and Control. In Proceedings of the 8th USENIX Security Symposium, August 1999. [9] J. C. Reynolds, J. Just, L. Clough, and R. Maglich. On-Line Intrusion Detection and Attack Prevention Using Diversity, Generate-and-Test, and Generalization. In Proceedings of the 36th Annual Hawaii International Conference on System Sciences (HICSS), January 2003. [10] H. Shacham, M. Page, B. Pfaff, E. Goh, N. Modadugu, and D. Boneh. On the Effectiveness of Address-Space Randomization. In Proceedings of the 11th ACM Conference on Computer and Communications Security (CCS), pages 298– 307, October 2004.
[11] S. Sidiroglou, M. E. Locasto, S. W. Boyd, and A. D. Keromytis. Building A Reactive Immune System for Software Services. In Proceedings of the 11th USENIX Annual Technical Conference (to appear), April 2005. [12] M. Stamp. Risks of Monoculture. Communications of the ACM, 47(3):120, March 2004. [13] J. A. Whittaker. No Clear Answers on Monoculture Issues. IEEE Security & Privacy, 1(6):18–19, November/December 2003.
A Distributed Bidding The problem of assigning work to AC members can be seen as an instance of the general KNAPSACK problem. Each node in the callgraph G has a weight vi ∗ ri . Some subset of the nodes in F must be assigned to each AC member such that each member does no more than W work. We can relax the threshold to be N within some range � of W . Thus, � is a measure of system fairness. N is calculated, each AC Once the globally fair amount of work W N member can adjust their workload by bargaining with other AC members via a distributed bidding process. Two considerations impact the assignment of work units to AC members. First, we should preferentially allocate work units with higher weights, as these work units likely have a heavier weight due to an high vi . Even if the weight is derived solely from the performance cost, assigning more members to it is beneficial because these members can round-robin the monitoring task so that any one member does not have to assume the full cost. Second, in some situations, vi ∗ ri will be greater than the average amount of work W . Achieving fairness means that vi ∗ri defines the quantity N of AC members that must be assigned to it, and the sum of these quantities defines the minimum number of members in the AC.
fi a() b() c()
xi 100 200 300
ri 1 2 3
vi α1 α2 α3
T 600 600 600
C(fi , xi ) 16 33 50
ri ∗ v i α1 2α2 3α3
Table 2. An example of AC work calculation. Our algorithm works in two rounds. First, each member calculates a table similar to Table 2. Then, AC members enter into a distributed bidding phase to adjust their individual workload. The distributed algorithm uses tokens to bid; tokens map directly to the number of time quanta that an AC member is responsible for monitoring a work unit. A node accumulates tokens by taking on extra computation. The algorithm makes sure that each node does not accumulate more than the total number of tokens allowed by the choice of �. Since we currently assume a collaborative AC, useful future work can address protecting the bidding process in the face of various threats (e.g., insider accumulating tokens) and constraints (e.g., anonymity for AC members).