Supporting Decisions | Inspiring Ideas
Avondale Schools Engagement and Priority Assessment December 2015
MUNICIPAL EMPLOYEES’ RETIREMENT SYSTEM 2015155
© 2015 CobaltCommunityResearch
Background on Cobalt Community Research
501c3 not for profit research coalition Mission to provide research and education Developed to meet the research needs of schools, local governments and nonprofit organizations
2
CobaltCommunityResearch.org
Page 2
Measuring Where You Are:
Why Research Matters
Understanding community values and priorities helps you plan and communicate more effectively about District decisions Perception impacts behaviors you care about Understanding community perception helps you improve and promote your District Community engagement improves support for difficult decisions
Reliable data on community priorities aids in balancing demands of vocal minorities with the reality of limited resources Bottom line outcome measurement of service and trust: Good administration requires quality measurement and reporting 3
CobaltCommunityResearch.org
Page 3
Study Goals
Guide decisions on where to place limited resources Establish service delivery baselines Understand drivers of District satisfaction Compare broad, organizational measures with indices of school performance Compare performance to 2012 parent survey Better understand school choice Strengthen outreach and communication
4
CobaltCommunityResearch.org
Page 4
Bottom Line Scores improved from the 2012 survey in most areas The District has solid performance when compared against the state benchmarks There are several areas where outreach or performance enhancement can have significant impact on overall engagement:
Curriculum Teachers Services Principals
Detailed information by specific demographic groups is available to aid in policy review Detail by: grade, building, years in District, number of children, age, education, marital status, gender and ethnicity 5
CobaltCommunityResearch.org
Page 5
Available Tools Detailed questions and responses broken by demographic group and “thermal mapped” so lower scores are red and higher scores are blue Comparison scores with broader Michigan benchmark Online portal to allow side-by-side comparisons of groups and subgroups (for example, breaking down the core scores of individuals divided by age, gender, etc.) Online portal allowing download of data into MS Excel
6
CobaltCommunityResearch.org
Page 6
Methodology Data collected in October and November 2015 Conducted via email to 2,272 parents over 4 waves Valid response from 750 people, producing a response rate of 33 percent (very strong) ACSI margin of error of +/- 1.5 percent, conventional margin of error of +/- 2.9 percent (95% confidence) 2012 = 835 responses, 32 percent response rate, +/- 1.5 and 2.8 percent
Note: National surveys with a margin of error of +/- 5% require a sample of 384 responses to reflect a population of 300,000,000
7
CobaltCommunityResearch.org
Page 7
0%
8 0%
CobaltCommunityResearch.org 2012
Page 8 2015
2%
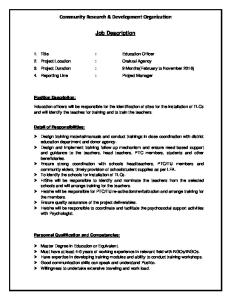
None
20%
Avondale Academy
30%
Avondale High School
12%
Avondale Middle School
14%
Woodland Elementary
5%
R. Grant Graham Elementary
12% 11%
Deerfield Elementary
10%
Auburn Elementary School
Respondent Type by School Building 35%
32% 28%
25% 24%
21%
15%
13% 13%
9%
7% 0% 1%
School Satisfaction Model Family Experiences
Satisfaction=Value
Outcome Behaviors
Curriculum Remain Ancillary Services Speak Favorably
Teachers
CSI
Principals
Volunteer
Facilities
Participate in conferences
Safety and Security
Participate with Orgs
Communication Website
Overall Satisfaction Compared to expectations Compared to ideal
Participate in Planning District Brand Image
Recent Contact
“Parent involvement is a clear driver of a child’s success. Likewise, parent engagement with local schools is a clear driver of a district’s organizational success.” 9
CobaltCommunityResearch.org
Where to improve Where to invest next Page 9
Results
10
CobaltCommunityResearch.org
Page 10
Word Cloud:
Consider all schools you’ve been in contact with, what practice or program should Avondale consider implementing?
Top Themes: 1.
2.
3.
11
Program (quality
programs, enrichment, after school, language, college prep, special needs) Students (strong support system, mentoring, engaged) Teachers (low student to teacher ratio, communicate with parents, integrating technology)
Note: See full list of comments for context CobaltCommunityResearch.org
Page 11
Word Cloud: In your opinion, what are Avondale Schools' two best attributes? Top Themes: 1.
Community (involvement, sense of community, smaller district creates family atmosphere)
2.
Teachers (quality of, dedicated,
devoted, friendly)
3.
12
Diversity
(of students, across the district, economic, racial)
Note: See full list of comments for context CobaltCommunityResearch.org
Page 12
Word Cloud: In your opinion, what are the two most important improvements needed in Avondale Schools? Top Themes: 1.
2.
3.
13
Students (challenge
students with curriculum, better support for students not reaching potential, improve performance) Teachers (more teachers, improve class sizes, more contact with parents, better accountability for poor performing teachers) Programs (better science and technology, after school, tutoring, more for average students)
Note: See full list of comments for context CobaltCommunityResearch.org
Page 13
District ACSI Results In Context 2015 Avondale - Overall
75
2012 Avondale - Overall
71
2015 - Michigan Schools Overall
14
67
2012 - Michigan Schools Overall
65
2015 - Michigan Medium Districts Overall
65
2012 - Michigan Medium Districts Overall
65
35
CobaltCommunityResearch.org
45
Page 14
55
65
75
40
15 CobaltCommunityResearch.org
Page 15
Keep children in next year
MI Overall
Participate in school planning
2015 Avondale
Participate in parent organizations
Volunteer time for school needs
2012 Avondale
Speak favorably about schools
Participate in conferences
Avondale ACSI Score
Outcome Measurements
High score = 100 MI Medium Districts
100
90
80
70
60
50
Word Cloud:
If you answered below 8 on any of the actions above (speak favorably, volunteer, etc.), please help us understand your reasons for doing so:
Top Themes: 1. 2.
Time constraints Work
3.
PTO
(obligations, no free time) (unable to participate, not interested)
16
Note: See full list of comments for context CobaltCommunityResearch.org
Page 16
45
17 CobaltCommunityResearch.org
Page 17
Integrates economic and ethnic diversity to support harmony in the district
Provides life skills
MI Overall
Prepares students
2015 Avondale
Communicates effectively
Well trained employees
2012 Avondale
Trustworthy administrators
Well managed
Partner in childs education
School System Image
Image Components
High score = 100 MI Medium Districts
85
75
65
55
Performance Categories to Benchmarks 2012 Avondale
2015 Avondale
MI Overall
MI Medium Districts
85
75
65
18
CobaltCommunityResearch.org
Page 18
Communications
Recent Contact
Website
Safety and Security
Facilities
Principals
Teachers
Services
45
Curriculum
55
Understanding the Charts:
Perceived Performance
Long-term Drivers High scoring areas that do not High impact areas where the currently have a large impact on organization received high engagement relative to the other scores from parents. They have areas. Action: May show over a high impact on engagement if investment or under improved. Action: Continue communication. investment
Low scoring areas relative to the High impact on engagement other areas with low impact on and a relatively low score. engagement. Action: Limit Action: Prioritize investment to investment unless pressing drive positive changes in safety or regulatory outcomes. consideration.
Impact 19
CobaltCommunityResearch.org
Page 19
Drivers of Satisfaction and Behavior:
Strategic Priorities 85
How are schools performing? (100= Most Positive)
Recent Contact Facilities
Teachers
Safety/Security Principals Website
78
Curriculum
Services Lower Impact, Lower Satisfaction
70
20
Higher Impact, Higher Satisfaction
Communications
0
CobaltCommunityResearch.org
0.7 What drives parent engagement if improved? Page 20
1.4
Drivers of Satisfaction and Behavior:
Strategic Priorities Compared to 2012 85
How are schools performing? (100= Most Positive)
Recent Contact Facilities
Teachers
Safety/Security Principals Website
78
Curriculum
Services
Lower Impact, Lower Satisfaction
70
21
Higher Impact, Higher Satisfaction
Communications
0.0
CobaltCommunityResearch.org
0.7 What drives parent engagement if improved? Page 21
1.4
40
22 CobaltCommunityResearch.org
Page 22
Presented in the way my child learns best
Integration of technology
Critical thinking skill
Foreign language/Intl skill
MI Overall
Social Studies skill
Writing skill development
2015 Avondale
Science skill development
Reading skill development
Problem solving development
2012 Avondale
Music/art skill development
Math skill development
Health/physical education
Computer skill development
Level of challenge
Curriculum
Drivers of Satisfaction and Behavior:
Curriculum MI Medium Districts
80
70
60
50
50
23 CobaltCommunityResearch.org
Page 23
Responsiveness to diversity
Ease of contacting teachers
MI Overall
Demonstrate care for students
2015 Avondale
Organization and preparation
Responsive to parent concerns
2012 Avondale
Responsive to student needs
Ability to motivate students
Qualification in their subject
Teachers
Drivers of Satisfaction and Behavior:
Teachers MI Medium Districts
90
80
70
60
40
24 CobaltCommunityResearch.org
Page 24
English language learner support
Athletic programs
MI Overall
Tuition-based pre-school
2015 Avondale
Tutoring/academic support
Support for students with unique needs
2012 Avondale
Before/after school programs
Transportation
Food service
Services
Drivers of Satisfaction and Behavior:
Services MI Medium Districts
80
70
60
50
50
25 CobaltCommunityResearch.org
Page 25
Responsiveness to diversity
MI Overall
Educational leadership knowledge
2015 Avondale
Availability to parents
Innovation in solving problems
2012 Avondale
Openness to improvement ideas
Responsiveness to concerns
Principals
Drivers of Satisfaction and Behavior:
Principals MI Medium Districts
90
80
70
60
Communications
26
CobaltCommunityResearch.org
Page 26
How do you prefer to receive information from Avondale Schools? 2012
100% 90%
2015
93% 91%
80% 70% 60% 50% 40%
42%43% 35% 33%
30%
31%
30% 28%
20%
29% 22%
25% 22%
22%23%
10%
27
CobaltCommunityResearch.org
Page 27
0%
Other
Facebook/social media
Mail
Conversation with staff
Note home
4% 6%
Newsletter
Text message
School website
Phone
Email
9%
0%
Who was this recent contact with? 2012
60%
2015
56%
50% 48%
40%
30% 27%
24%
20%
14%
10%
10%
11%
28
CobaltCommunityResearch.org
1% 1%
2% 1%
Other
Bus driver/garage
Teacher's aide/parapro
Page 28
0% 0%
3% 2%
None
3% 2%
Board member
2% 2%
District administrator
Guidance counselor
Principal
Office staff
0%
Teacher
8%
Contact ratings by type of contact 10.0 9.0 8.0
9.0 8.8
8.6 8.4 8.2 8.0 7.9
8.78.8
8.8
8.7
8.78.8
8.7
9.0
8.8
8.7
8.2 7.9
7.7
7.6
7.0
7.9 7.7
7.87.8
7.1
7.5 7.3
Completeness of response to your question
Speed with which your question was handled
7.1
7.5
8.9
8.7
7.8
8.28.2 7.9
8.3
7.5
7.4 7.0
6.8 6.5
6.0 5.0 4.0
3.0 2.0 1.0
Ability to reach the appropriate person
Teacher
29
Accuracy of response to your question
Teacher's aide/parapro
CobaltCommunityResearch.org
Principal
District adminstrator
Page 29
Office staff
Overall ease of working with the school system
Guidance counselor
Pleasantness of the person you spoke with Bus driver/garage
Planning and Budget
30
CobaltCommunityResearch.org
Page 30
0%
31 CobaltCommunityResearch.org 2012
Page 31
6% 6% 6% 6% 5% 8% 5%
Buildings/facilities
9%
Athletics programs
4%
Financial stability
7%
Recommendation from friends/family
2015
Before/after school programs
10%
Special education
9%
Variety of coursework
10%
Arts/music/performing arts
22%
Student diversity
20%
Class size
31%
School reputation
30%
Location
66%
Safety & security
60%
Quality of staff
Academic performance
School Selection Criteria 80%
70% 76%
64%65%
50%
40% 36%
31% 29% 25%
21% 19% 15%
7% 4%
Support for Budget Closing Approaches Disagree = 1, Agree = 10 10.0 9.0 8.0 7.0 6.0
6.8 6.3
5.0 4.6
4.0
4.9 4.5 3.8
3.0
3.7
3.7 3.2
3.1
2.7
2.0
1.0
2.9 2.6 2.2
Expand the number of services with area districts
Expand Reduce Reduce athletic Reduce extra Reduce Increase class Reduce outreach vocational programs curricular services at the size elementary around school education (auto programs high school specials (art, of choice to mechanics, (clubs, theater, academic music, physical draw more drafting, etc.) choir, band, center ed, foreign students to the etc.) (mentoring, language) District tutoring)
2012
32
3.3
3.2
CobaltCommunityResearch.org
Page 32
2015
Word Cloud: Other ideas for consideration regarding budget closing approaches: Top Themes:
33
1.
Increase
2.
Pay to play
3.
Reduce costs
(district marketing efforts, fundraising, taxes/millage) (increase fees) (administrative, ancillary, transportation)
Note: See full list of comments for context CobaltCommunityResearch.org
Page 33
0%
34 CobaltCommunityResearch.org
Page 34
Other
10%
Develop biomedical programming
11%
Strengthen students’ international experience with foreign partner schools
Implement International Baccalaureate programming
10%
Develop a media arts academy
Expand on virtual/online course opportunities
20%
Develop an engineering academy
25%
Develop an entrepreneurship/busines s academy
30%
Develop/expand a foreign language and culture program
Expand on advanced course work and dual enrollment offerings
50%
Expand partnership opportunities with Oakland University
Partner with area colleges to offer an Early College program
Priorities for future educational services and programs 60% 56% 52%
40%
32%
24% 23% 20%
14% 10%
3%
0%
35 CobaltCommunityResearch.org Elementary
24%
15% 17% 19%
11% 14%
Junior high
Page 35 Senior high
11% 15% 11% 12%
All levels
12% 13% 11%
9% 7% 11%
9% 8%
Other
17% 24%
Develop biomedical programming
26%
Strengthen students’ international experience with foreign partner schools
20% 23%
Implement International Baccalaureate programming
10% 28%
Develop a media arts academy
33%
Expand on virtual/online course opportunities
29%
Develop an engineering academy
30%
Develop an entrepreneurship/business academy
41%
Develop/expand a foreign language and culture program
Expand on advanced course work and dual enrollment offerings
50%
Expand partnership opportunities with Oakland University
40%
Partner with area colleges to offer an Early College program
Priorities for future educational services and programs by grade level emphasis 70%
60% 66%
56% 58%
53%
47% 51%
44%
37% 41%
32% 29% 27%
21% 21% 24%
18% 14% 12% 7% 2% 1% 4%
Word Cloud: Other ideas for consideration regarding future development priorities: Top Themes: 1.
Programs
2.
College prep courses Start programs early
3.
(trades, vocational, technology)
(elementary to get kids to enjoy learning)
36
Note: See full list of comments for context CobaltCommunityResearch.org
Page 36
Which grade level should have the greatest emphasis? 2012
60%
2015
50% 50% 46% 40%
30%
32%
33%
20%
10%
12%
13%
8% 6% 0%
37
Elementary level
CobaltCommunityResearch.org
Junior high level
Page 37
Senior high level
All levels
0%
38 CobaltCommunityResearch.org
40%
30%
20%
10%
Page 38
69% 69%
Expand on virtual/online course opportunities
50% 70%
Strengthen students’ international experience with foreign partner schools
60% 70%
Develop a media arts academy
71%
Develop an entrepreneurship/busines s academy
74%
Expand partnership opportunities with Oakland University
76%
Develop biomedical programming
70%
Partner with area colleges to offer an Early College program
78%
Develop an engineering academy
Develop/expand a foreign language and culture program
80%
Expand on advanced course work and dual enrollment offerings
Implement International Baccalaureate programming
Willing to pay to develop services and programs selected 80% 78% 74%
Support for recreational millage to help fund after-school programs 2012
70%
60%
2015
64% 60%
50%
40%
30%
30% 28%
20%
10%
10% 8%
0%
39
Yes
CobaltCommunityResearch.org
No
Page 39
Not sure
Title I Services
40
CobaltCommunityResearch.org
Page 40
Is your child enrolled in Title I? 90%
80%
80% 76%
70% 60% 50% 40% 30% 20%
19% 10% 0%
41
12% 8%
5% Yes
CobaltCommunityResearch.org
2012
No
Page 41
2015
Not sure
The Title I supplementary educational service provided to my child has helped him/her… 50%
43%
40%
35% 30%
31% 25%
24%
20%
19% 13%
10%
0%
4% Reach State and District grade Make significant progress level academic performance toward meeting State and expectations District grade level academic performance expectations 2012
42
CobaltCommunityResearch.org
Page 42
Make some progress toward meeting State and District grade level academic performance expectations 2015
Make minimal or no progress toward meeting State and District grade level academic performance expectations
How often did the Title I supplementary educational program provide… 60% 60%
59%
50% 40%
41% 39% 36%
35%
30%
31% 29%
28%
27%
20%
21%
20% 17%
10% 0%
17%
14% 12% 10%
10%
Consistently
Gener- Occasionally ally
Never
Regular, two-way and meaningful communication that supported your parental involvement in the academic learning of your child?
Regularly
Occasion- Rarely ally
CobaltCommunityResearch.org
9%
Never
Regularly
10%10%
10%10%
Occasion- Rarely ally
Never
Opportunities to be a full partner in your Opportunities to learn about the child’s education through parent instructional content and methods used, conferences, parent information your child’s performance evaluations, meetings, surveys, program evaluation, and home-school connections to support and asking for your recommendations? student learning? 2012
43
11%
Page 43
2015
The Title I supplementary educational program documents Parent Involvement Policy and ParentSchool-Student Compact were… 50%
40%
30%
43%
31%
31% 24%
20%
17%
17%
15% 10% 9% 0%
Provided this school year and promoted both your participation in a variety of parental involvement activities at school as well as the use of activities in your home to support your child’s school success
Provided this school year and Provided this school year and Not provided this school year made you aware of some made you aware of some parental involvement activities. parental involvement activities, You participated in one or two but they were not what you of these activities at the school needed to support your child’s or used them at your home to academic work support your child’s school success 2012
44
CobaltCommunityResearch.org
Page 44
2015
Implementing Results
45
CobaltCommunityResearch.org
Page 45
Perception v Reality: Minimize Distortion or Fix Real Performance Issues Perception gap: Respondents rated based on an inaccurate idea or understanding. Address with communication strategy to change that perception. Real performance issue: Address with an improvement plan. When performance improves, it becomes a perception gap to address with a communication strategy.
46
CobaltCommunityResearch.org
Page 46
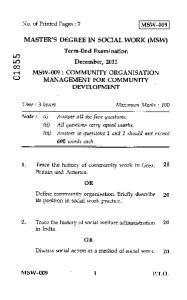
Strategy is About Action:
Improve Performance to Improve Outcomes The diagram at the right provides a framework for following up on this survey. The first step (measurement) is complete. This measurement helps prioritize resources and create a baseline against which progress can be measured. The second step is to use internal teams to further analyze the results and form ideas about why respondents answered as they did and potential actions in response. The third step is to validate ideas and potential actions through conversations with parents, residents and staff – do the ideas and actions make sense. Focus groups, short special-topic surveys and benchmarking are helpful. The fourth step is to provide staff with the skills and tools to effectively implement the actions. The fifth step is to execute the actions. The final step is to re-measure to ensure progress was made and track changes in resident needs. 47
CobaltCommunityResearch.org
Page 47
1 Measure
2 Ideas/ Brainstorm
5 Implement
Outcomes
4 Train
3 Validate/ Confirm