Bootstrapped Discovery and Ranking of Relevant Services and Information in Context-aware Systems Preeti Bhargava, James Lampton, Ashok Agrawala Department of Computer Science, University of Maryland, College Park
prbharga,jlampton,
[email protected]
ABSTRACT A context-aware system uses context to provide relevant information and services to the user, where relevancy depends on the user’s situation. This relevant information could include a wide range of heterogeneous content. Many existing context-aware systems determine this information based on pre-defined ontologies or rules. In addition, they rely on users’ context history to filter it. Moreover, they often provide domain-specific information. Such systems are not applicable to a large and varied set of user situations and information needs, and may suffer from cold start for new users. In this paper, we address these limitations and propose a novel, general and flexible approach for bootstrapped discovery and ranking of heterogeneous relevant services and information in context-aware systems. We design and implement four variations of a base algorithm that ranks candidate relevant services, and the information to be retrieved from them, based on the semantic relatedness between the information provided by the services and the user’s situation description. We conduct a live deployment with 14 subjects to evaluate the efficacy of our algorithms. We demonstrate that they have strong positive correlation with human supplied relevance rankings and can be used as an effective means to discover and rank relevant services and information. We also show that our approach is applicable to a wide set of users’ situations and to new users without requiring any user interaction history.
Categories and Subject Descriptors C.3.2 [Special-Purpose and Application-based Systems]: Realtime and embedded systems, Ubiquitous computing
General Terms Algorithms, Design, Experimentation, Human Factors, Performance
Keywords Context-aware Computing and Systems; Ubiquitous Computing; Discovery and Ranking of Relevant Services and Information
1.
INTRODUCTION
A context-aware system uses context to provide relevant information and services to the user, where relevancy depends on the
user’s task or situation [9]. This involves delivering “the right information at the right place and the right time" i.e. relevant, personalized and timely information to users. Thus, a context-aware system should exhibit the following three capabilities: • Determining relevant information - This capability is the cornerstone of context-aware computing. In today’s world, with the abundance of information available to us, information overload can easily happen. Hence, it is imperative that the system retrieves and displays only that information which is relevant to the user’s task at hand. • Personalization - This is achieved by acquiring a user’s context (needs, preferences, etc.) through implicit or explicit means and using it to filter the relevant information. • Timeliness - The system can achieve timely information delivery by providing the personalized and relevant information to the user at a time when he needs it and can act upon it. However, what constitutes relevant information to an individual user may vary widely according to his tasks or situations. For instance, a user who intends to get a medical test done would benefit from relevant information, such as recommendations for hospitals and laboratories, retrieved from the appropriate sources. A user who is about to leave for work may be interested in the weather forecast and traffic enroute to her workplace. Furthermore, this information should be personalized according to the users’ context such as location, preferences and needs. Finally, the context-aware system should provide this information to the users in a timely manner in order to help them make an informed decision regarding where they should go, which routes they should take and when they should leave so that they can reach their destination on time, thus, saving their time and effort. Ultimately, this enhances their efficiency and facilitates effective decision making. As evident from this discussion, a user’s intended events, activities, tasks and situations (henceforth, collectively referred to as Situations) are the most crucial factors in determining what information is relevant to him. It is also evident that a user’s information needs in the real world vary according to his situations and could include a wide range of heterogeneous content, such as weather, news, traffic information etc. This presents two challenges: recognizing a user’s situations and tasks, and determining information relevant to them. In this paper, we focus on these two challenges. In many existing context-aware systems and applications such as Siri1 , the user explicitly provides his situation or task information and requests for relevant information. For instance, if he is going for lunch, he will request information about restaurants or food options nearby. However, for widespread adoption, it is essential that his situations be detected in an automated and unobtrusive manner. An existing way to recognize a user’s current situation is via activity recognition (as done in [19]) though it can recognize only a limited number of diurnal situations (such as ‘Walking’, ‘Driving’ etc.). On the other hand, user generated content from scheduling 1
MOBIQUITOUS 2015, July 22-24, Coimbra, Portugal Copyright © 2015 ICST DOI 10.4108/eai.22-7-2015.2260179
www.apple.com/ios/siri/
resources (such as calendars, reminders or to-do lists), which users employ prolifically nowadays, can provide a rich platform for implicit recognition of everyday situations and tasks. This content can be easily used to augment activity recognition. Thus, to address the first challenge, we propose to glean as much information, about the user’s tasks and situations, as we can by soft sensing of these user generated sources on smartphones and desktops through application access or content extraction. For instance, consider a user who has a scheduled event, ‘Lunch’, marked in his calendar. A context-aware system can now infer, from this event, that the user’s situation would be ‘Having Lunch’ in the near future. The second key challenge is to determine what information is relevant to a user’s situation. As mentioned earlier, the relevant information varies widely with the user’s situations and could include a range of heterogeneous content. Clearly, it would be infeasible to build an individual system to provide each type of content - a single generic and unified system that could integrate and retrieve a variety of such heterogeneous information from various sources, based on its relevance to the user’s situation, would be the ideal solution. Some of this relevant information can be extracted from internal sources such as user’s emails. However, most of it needs to be obtained from external sources. There are several web-based services and websites (henceforth, referred to as Information services or just services) that complement web search results. They provide domain-specific information (e.g. traffic, weather etc.) aggregated from expert and user contributions and can serve as an excellent source of such content. The question that can be posed now is how to determine the most relevant services, and the most relevant information to be retrieved from them, for a given user situation? Mostefaoui et al. [21] identify that predicting what information would be relevant to a user is challenging. They state that it is possible to determine it using techniques that are based on users’ feedback or the system developer’s observations. Thus, in order to automate the process of discovery and retrieval of relevant information in a context-aware system, the system designer could encode or program rules by hand. Consider the example user situations mentioned earlier - ‘Getting a medical test done’ and ‘Going for lunch’. For these, a system designer could encode rules such as: • If a user’s situation is ‘Get medical test done’ then retrieve information about ‘Hospitals’ or ‘Medical laboratories’, • If a user’s situation is ‘Lunch’ then retrieve information about ‘Restaurants’ or ‘Food’ near the user. However, this approach suffers from several drawbacks: 1. These static rules are expensive to generate and maintain. In addition, they cannot be dynamically adjusted in response to changes in a user’s behavior. 2. A user may be involved in innumerable situations and, hence, it is not possible to enumerate such rules for every situation. 3. Furthermore, these rules, and systems that employ them, can only cover the set of possibilities that system designers anticipated and will not scale to a large number of unanticipated situations and information needs of different users. Xu et al. [31] proposed an OLAP based approach for mining user interaction logs in order to filter information based on its relevance to the user’s context. For instance, if a user has accessed her shopping list most frequently in a certain context (location, day of week and time), then it implies that this is the most useful information to her for that context. Even though user interaction logs are a valuable source for determining relevant information, a major limitation of this approach is that for new users (for whom the system has little or no context history), the system may suffer from a cold start and may not be able to determine any relevant information. Thus, new techniques need to be developed in order to augment this and bootstrap the context-aware system so that it can retrieve information for unanticipated user situations or for new users and avoid a cold start. Yet, enough attention has not been given to this problem. Thus, to address the second challenge and all these limitations,
we propose a novel, flexible and general approach based on Semantic Relatedness [14] - a metric for determining similarity of two documents or phrases based on their semantic meaning. It is normalized to a value between 0 (no relatedness) and 1 (very high relatedness) and is significantly more powerful than simple keyword based matching. This metric has been steadily gaining attention among Natural Language Processing (NLP) researchers and has been used in several applications such as targeted advertising [5] and web search [12] with positive and beneficial results. We propose to utilize this metric as a measure of relevance of the information, provided by a service, to the user’s situation or task. For instance, the semantic relatedness between ‘lunch’ and ‘food’ is 0.76. Clearly, services that provide information or recommendations for food are relevant to a user’s situation ‘Going for lunch’. This demonstrates that this metric can be effectively used for discovering and ranking information relevant to users’ situations. Ultimately, this creates a context-aware system that is flexible, generic, easier to maintain and can retrieve information beyond what could be anticipated by a system designer. Moreover, such a system does not rely on hand coded rules and will be able to provide relevant information for new situations and to new users (for whom there is no past interaction or usage history), thereby, avoiding a cold start. We implement both our proposed ideas in a single generic system which employs various algorithms to discover and rank candidate services relevant to a user’s situation. It retrieves the relevant information from the ranked services, aggregates it and presents it to the user. Our contributions in this paper are: • We propose and implement the idea of inferring a user’s situations via soft sensing of user generated content from sources such as calendars etc. • We address the problem of bootstrapped discovery and ranking of heterogeneous services and information, relevant to a user’s situations, in context-aware systems. We propose a novel approach, based on Semantic Relatedness, to solve it. • We design and implement four variations of a base algorithm that ranks candidate relevant services, and the information to be retrieved from them, based on the semantic relatedness between the information provided by the services and the user’s situation description. • We implement these algorithms as part of a system, called TellMe, and conduct a live deployment and a web-based study with 14 subjects to evaluate their efficacy. We demonstrate that they show strong positive correlation with human supplied relevance rankings and can be used as an effective means to discover and rank relevant services and information. • We also show that our approach is general, applicable to a wide set of users situations and can provide relevant information to new users without requiring any user interaction history, thus, avoiding a cold start.
2.
RELATED WORK
Since our work spans several ideas, we have organized the related work into several different subsections. We highlight their shortcomings as well as differences with our approach.
2.1
Use of Software Sensors
Garlan et al. [11] propose utilizing location information from a user’s calendar, in the Aura system, in order to predict future locations of a user and take appropriate actions on his behalf based on this information. On the other hand, we propose a generalized approach that utilizes user generated content from calendars, reminders and to-do lists to infer the tasks and situations of a user.
2.2
Service Discovery and Selection in Ubiquitous Computing Systems
Service discovery refers to a mechanism that allows users to lo-
cate services on-demand and in reasonable time [20]. Existing works [16, 27, 29] perform context-aware service discovery and selection based on how closely a user’s request and the service description matches. The matching is usually done using a predefined ontology. Most of these works are constrained in their approach as they consider services to be either hardware or network resources such as printers or projectors. In addition, a major drawback of using pre-defined ontologies is that they are usually domain specific and limited to a finite number of concepts that the ontology designer has taken into account. Even though our approach shares similar goals with these works, it stands out in several ways: • We incorporate a variety of services that offer heterogeneous content instead of focusing on just hardware resources. • We utilize state of the art NLP techniques to calculate relevance using content from any of the services present in a context-aware system. • We do not limit ourselves to a pre-defined ontology. We employ powerful, domain-independent and exhaustive databases and repositories such as Wikipedia, Wordnet and other corpora. The use of these repositories ensures that a large amount of world knowledge is exploited for determining relevance instead of relying only on the system designers’ knowledge.
2.3
Smartphone application usage prediction
Predicting smartphone application (referred to as an ‘app’) usage has received significant attention recently. Several works such as Huang et al. [15] and Shin et al. [25] focus on predicting the next smartphone app that a user would use based on contextual information such as time, location, or usage information such as most frequently or recently used app. In contrast, we focus on determining the information and its source, from among several heterogeneous sources, that would prove most relevant to the user’s situation irrespective of the source type - whether its an app or a service. Moreover, we do not rely on usage information in our current system as our main goal is to demonstrate the feasibility of our proposed approach for bootstrapped discovery of relevant information.
2.4
Relevant information discovery in contextaware systems
In most of the notable context-aware systems such as Context Toolkit [24], Context Broker Architecture [6], and Gaia [23], determining relevant services and information based on a user’s situation or task is either not addressed or is achieved using pre-defined rules. As explained earlier, such static pre-defined rules are not suitable for scaling and adapting to a dynamic environment. They will need to be adjusted according to changes in the user’s behavior or situation, or due to new unanticipated situations. A number of existing systems [2, 18, 32] focus on determining relevance of information based on the user’s interests and preferences or their context such as time and location. Furthermore, most of these systems have narrow applicability and are specific to domains such as meeting room environments [6], museums [8], airports [18], tour guides [2, 3, 7, 17] and healthcare [32]. Although these systems serve their intended purpose well, they are limited in scope and can only handle information specific to their particular domain rather than the heterogeneous content that users require and that could help them in effective decision making. In contrast, we do not focus on a specific application or domain. Instead, we develop a generic infrastructure for aggregation of a variety of content in order to satisfy a diverse set of user information needs.
2.5
Relevant information discovery in commercial systems
Tempo2 , a smart calendar iPhone app, uses calendar data to provide users with relevant internal information such as related emails 2
http://tempo.ai/
Calendar and reminder content Notes and to-do lists content
TellMe client
Relevant Information Task and Situation items
TellMe server side system
Figure 1: Overview of the TellMe system and documents, before an appointment is due to happen. It also determines navigation directions to locations mentioned in the user’s upcoming calendar entries. However, to the best of our knowledge, it does not retrieve any other relevant information from external sources that could prove helpful to the user’s situation. Google Now3 is a smartphone app that provides users with information such as flight schedules, weather, and traffic in the form of ‘Google Now Cards’. These cards are often displayed statically based on user’s context such as location (for instance, the ‘Weather’, ‘Photography Spots nearby’ or ‘Events nearby’ cards). They can also be generated dynamically based on the user’s recent search history and emails. Even though internal information (such as that from email) can be valuable to a user, it has limited benefits if he wants to discover new information serendipitously. For instance, a user heading to the airport may benefit significantly from external information (such as transport options to the airport) in addition to internal information (such as flight schedules) from his email. More importantly, displaying relevant information based only on location can prove to be ineffective. As mentioned earlier, a user who needs to get a medical test done would be better assisted by recommendations for hospitals rather than spots for photography nearby. In addition, even though email can be a rich source of situations, we believe that it is constrained for recognizing everyday situations and tasks. Other user generated sources such as calendars and reminders can serve as a more abundant source for them and can be easily mined from a smartphone or a desktop. To address all these limitations, we propose to discover and rank a wide variety of external heterogeneous services and information relevant to a user’s situation (sensed from user generated sources) to enhance his efficiency and quality of life.
3.
THE TELLME SYSTEM
In this section, we describe the TellMe system, its components and its underlying algorithms in detail.
3.1
TellMe client side system
Figure 1 shows an overview of how the TellMe system functions. A TellMe client application running on a smartphone or desktop aggregates situations and tasks information from several user generated information sources such as calendars, reminders, and notes. These situation and task items are sent to the TellMe server side system. The client application receives the relevant information for each item from the server side system and displays it to the user. For prototyping, we have implemented a TellMe client application as a Google Calendar Event Gadget [1]. Users have to import this gadget in their existing Google calendars via a browser and authorize it to access their calendar entries and current geolocation. The gadget appears as an icon on top of each day in the calendar. On clicking the icon, a user can see a list of heterogeneous services and information relevant to each of his calendar entries for that day embedded as a web page in the gadget (see Figure 4). Please note that though the current client prototype focuses on calendar entries, it can be easily extended to include situation information from other sources such as reminders and to-do lists that may reside on a user’s phone. To this end, we are also currently developing a smartphone based TellMe client application. 3
www.google.com/landing/now/
User’s tasks and situations
TellMe Client TellMe server side system
Ranked list of candidate services and relevant information from each service
Service Tier Interface
Retrieve information from each service, for its categories, via service API
ROVER II Context-aware Middleware
Ranked list of candidate services and their most relevant categories
Aggregated list of ranked services and relevant information retrieved from them Task or Situation item
Service Tier Registry
Four square
Map Quest
Service Tier Entry Ranked list of relevant candidate services, and their most relevant categories, for each item
Relevant Services and Information Discovery and Ranking Engine
Service Tier Yelp
Tasks and Situation items for a user
Google News
Figure 2: Architecture of the TellMe server side system Service Yelp Google News FourSquare Angie’s List MapQuest LastFm Weather Underground
Top level Information Categories (# of subcategories) Active Life (74), Arts and Entertainment (20), . . . Sports (26), Entertainment (7), . . . Arts and Entertainment (52), College and University (38), . . . Home, Auto, Wedding, Parties and Entertainment . . . Navigation, Maps, Route, Traffic, Incidents, . . . Music, Music album, Music artist, Music chart, . . . Weather, Environment, Outlook, Temperature, . . .
(a) Services registered in the Service Tier and their top level information categories
Buy Groceries Drop clothes for dry cleaning Clean apartment Laundry Pay utility bill Go to Gym Mow the lawn (b) The most commonly recurring calendar entries, to-do and reminder items
Table 1: Services and their categories, as well as the most common situation items collected as part of our evaluation
3.2
TellMe Server side system
Figure 2 shows the architecture of the TellMe server side system. It is integrated with the Rover II context-aware middleware, introduced in Bhargava et al. [4], which can store and retrieve relevant contextual information and learn user behavior models. The server side system has the following components:
3.2.1
Service Tier
This component registers several external web-based information services, from which relevant information can be retrieved, and consists of client stubs to them. It also provides an API to add or register more services. For our initial prototype, we have selected 8 services based on the wide spectrum of information content that they provide, their popularity and ease of API availability, documentation and usage. These are: • MapQuest4 - a navigation service used for obtaining directions to a destination, traffic information etc. • WeatherUnderground5 - a service typically used for obtaining information on current weather conditions. • LastFm6 - a popular music discovery service. • Google News7 - a news service that provides comprehensive news coverage aggregated from sources all over the world. • Yelp8 - a service for user reviews of local businesses. • Google Feed9 - a service for subscribing to web feeds or blogs such as RSS or media feeds from any website. • Foursquare10 - a location-based social networking service to search for places and venues around the user’s location. • Angie’s list11 - a service that aggregates verified consumer 4
www.mapquestapi.com/traffic/ http://api.wunderground.com/ 6 www.last.fm/ 7 www.news.google.com/ 8 http://www.yelp.com/ 9 https://developers.google.com/feed/ 10 www.foursquare.com/ 11 www.angieslist.com/ 5
reviews of service companies in USA.
3.2.2
Service Tier Registry
This component contains a list of all the services, that are registered in the Service Tier, and the categories of information they provide. Since the information provided by a service can be described succinctly and coherently in terms of its information categories, we use them to compute the semantic relatedness metric. In the current version of our system, all the 8 services mentioned earlier are listed in this Registry. Some of these services and their top level categories are shown in Table 1a. These categories have been retrieved from the websites of these services or generated manually based on their content. Many of these services such as Yelp and Foursquare have a hierarchical category structure where general categories subsume more specific ones. It is evident that some of these services provide similar or overlapping information.
3.2.3
Service Tier Entry
This component functions as a gateway or an entry point to the TellMe server side system. It receives the list of user’s situation items from the Rover II middleware, parses it and sends each item to the Relevant Services and Information Discovery and Ranking Engine. It also receives the ranked list of candidate relevant services and their most relevant categories, for each item, from the engine and sends it to the Service Tier Interface.
3.2.4
Service Tier Interface
This component is responsible for interfacing with the services registered in the Service Tier and aggregating the relevant information retrieved from them. It accesses each ranked candidate service, via its public API, in order to retrieve the information for its most relevant categories and personalizes it based on the user’s context (such as location or preferences) if available. It aggregates this in-
Algorithm 1: Base Relevant Services and Information Discovery and Ranking algorithm (The algorithm can vary depending on the method of calculating semantic relatedness and the mechanisms for ranking.) Input: Situation or Task item description, List of Services and their categories from the Service Tier Registry Output: Ranked list of candidate relevant services and three most relevant categories for each service foreach Service listed in the Service Tier Registry do foreach Category of the Service do Calculate the Semantic Relatedness (SR) Score between the Category and the situation/task item description; Store the Category with Highest Semantic Relatedness (HSR) Score; end Calculate the Average Semantic Relatedness (ASR) for the service over all categories; Calculate the ServiceScore from the Category Scores using HSR or ASR; If ServiceScore < Scorethreshold , replace ServiceScore with 0.0; end Rank the services in decreasing order of ServiceScore; For all services that have ServiceScore = 0.0, set rank as ‘Not Applicable’; For all ranked services, rank their categories in decreasing order of SR scores ; return Ranked list of candidate services and the top three categories with the highest SR scores for each service; Wikipedia
STS
Semantic Relatedness Computation Module
Relatedness Score Relevant Services and Information Discovery and Ranking Algorithm Services and categories
Semantic Relatedness Scores
Service Tier Registry
Semantic Relatedness Scores Cache
Figure 3: Pipeline for the Relevant Services and Information Discovery and Ranking Engine formation and sends it back to the Service Tier Entry.
3.2.5
Relevant Services and Information Discovery and Ranking Engine
This is the core component for determining information relevant to a user’s situation or task item. Figure 3 shows the pipeline for it. It employs four variations of the base Relevant Services and Information Discovery and Ranking algorithm (Algorithm 1). This algorithm processes the situation/task item description, and utilizes the metric of semantic relatedness and a ranking mechanism to discover and generate a ranked list of candidate relevant services (from among those registered in the Service Tier) for it. For each ranked service, it also determines the three most relevant information categories. Currently, we focus only three relevant categories because the relevant information should be available to the user within 2 or 3 interactions (swipes/clicks) with the client application. As shown, the algorithm iterates over each service listed in the ‘Service Tier Registry’ and employs the Semantic Relatedness (SR) Computation Module to calculate the SR score between each of the service categories and the item description. Once the scores have been computed for all the categories of each service, a ‘Service Score’ is calculated for it by aggregating the scores from one or all of its categories. The services are then ranked based on the service score. For each ranked service, we also determine the top 3 categories which have the highest SR scores. These are the three most relevant categories for that service. The SR scores are further cached after retrieval to improve response time on subsequent calls. We implemented four variations of Algorithm 1 by employing two different methods for calculating SR scores and two different
ranking mechanisms. The methods for computing SR scores are: • STS-based SR - This variation employs the Semantic Textual Similarity (STS) System [13] for computing SR. The STS system is based on Latent Semantic Analysis (LSA) along with WordNet knowledge and is trained on LDC Gigawords and Stanford Webbase corpora. Since the STS system incorporates lemmatization, POS tagging and parsing as part of the SR computation, we do not perform these operations on the category and situation phrases. • Wikipedia-based SR - This variation is a novel approach similar to Explicit Semantic Analysis [10]. It uses the crosslingual dictionary created by Spitkovsky and Chang [26] along with the lch calculation from Rada et al. [22] and is further evaluated against Wikipedia by WikiRelate [28]. It is described in Section 3.4 for a more lucid explanation. The service score is computed using the following two different mechanisms and is then used to rank the services: • Highest Semantic Relatedness (HSR) - The service score is the highest SR score for any category of the service. • Average Semantic Relatedness (ASR) - The service score is the average SR score over all the categories of the service. If the service score is below a threshold, it implies that the information provided by the service is not relevant to the given user situation and hence, it is not ranked. This helps in reducing noise and false positives. Since SR is a cosine similarity measure, a threshold of 0.293 (1 - cos 45 ◦ ) is generally considered an appropriate threshold and we use that in our implementation. This ranked list of candidate services, along with their three most relevant categories, is then propagated to the Service Tier Interface component (via the ‘Service Tier Entry’). The Interface retrieves the information for each of the 3 categories, for each service, via the service API. It further filters this information based on the user’s context, such as location or preferences, if available. This ranked list of services, and the information retrieved from them, is then sent to the TellMe client application which displays it to the user.
3.3
Illustrative Use Case
We now illustrate the utility and benefits of the TellMe system via 2 scenarios (including the one described earlier in Section 1).
3.3.1
Use Case 1
For the user’s task ‘Get medical tests done’, a generated list of discovered and ranked candidate relevant services and their categories by the STS-HSR variation of Algorithm 1 is: 1. ‘Laboratory testing’, ‘Health and medical’, and ‘Medical centers’ from Yelp
Algorithm 2: Algorithm to compute semantic relatedness using Wikipedia-derived data. Input: A pair of strings Output: A measure of semantic relatedness. // Calculate the most related concepts from each string: foreach Input String do Tokenize the string into unigrams and bigrams; Map the unigrams and bigrams to associated concepts from the substring dictionary; Keep the combination of tokens that maximizes the sum of the pairwise lch scores; end // Find the most related concepts from each combination: foreach Combination of Concepts do Calculate lch between the two concepts; Maintain the concept pair with the highest lch value; end return Largest lch value and concept pair; Category: Healthcare Occupations
Category: Medical Specialties Category: Pathology
Medical_test
Ambulatory Care
Apgar_score
“Get medical tests done”
Figure 4: Screenshot of the TellMe client application displaying relevant information for a user’s task 2. ‘Doctor’s office’, ‘Medical school’, and ‘Hospital’ from FourSquare 3. ‘Genetic medicine’, ‘Physical medicine’, and ‘Alternative medicine’ from Angie’s List 4. ‘Health’, ‘Science’ and ‘Legal’ from Google News Figure 4 shows a screenshot of the TellMe prototype client application displaying the aggregated ranked list of services, and relevant information retrieved from each service (for each of its 3 most relevant categories), to the user via the calendar event gadget. Since the current client is a web-based system, the server side system utilizes the current geolocation of the user obtained from the user’s browser to filter the information for each category. As other services registered with the Service Tier (such as those for weather, music etc.) do not provide information relevant to this task, they are not discovered or ranked. This list is intuitive and beneficial to the user as it provides him with helpful suggestions on laboratories, medical centers and hospitals, near his current location, where he can go and get the tests done. Moreover, it enables him to discover new information serendipitously, such as information about alternative medicine or latest news regarding health and science, which further aids him in making an informed decision.
3.3.2
Use Case 2
Similarly, consider another situation item - ‘Go sailing’. The STS-ASR variation of Algorithm 1 generates the following ranked list of relevant services and categories: 1. ‘Surfing’, ‘Diving’, and ‘Boats’ from Yelp 2. ‘Wind’, ‘Weather’, and ‘Visibility’ from Weather Underground 3. ‘Navigation’, ‘Routes’ and ‘Maps’ from MapQuest In this case, the STS-ASR algorithm aggregates a wide variety of content which could benefit the user. For instance, the user may want to rent boats for sailing. In addition, he may want to check weather conditions before undertaking any water sport activity. These two use cases highlight the diversity of the information needs of users according to their situations. It also demonstrates
Physician
Foursquare: “Doctor’s office”
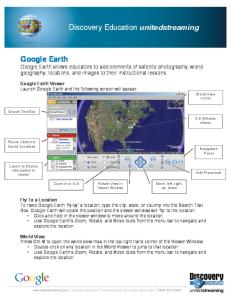
Figure 5: Graphical illustration of the lch calculation for the phrases “Get medical tests done” and “Doctor’s office”. that the TellMe system can aggregate heterogeneous content from various sources, which the user might have been oblivious of but, nonetheless, proves valuable in decision making.
3.4
Wikipedia-based Semantic Relatedness
Algorithm 2 outlines the process of calculating semantic relatedness between two phrases based on Wikipedia. In this algorithm, we first tokenize each phrase (which can be a situation description or a service category in our case) and disambiguate its meaning using the substring dictionary provided by Spitkovsky and Chang [26]. We have processed this dictionary to be of the form: substring → (Concept, pl , pc ) where Concept refers to a Wikipedia article, pl is the probability of the substring linking to the specific concept and pc is the probability of the concept itself. These substrings come from link text in Wikipedia and internet crawls, and their tf-idf values are used to generate pl and pc . For performance optimization, we have discarded substrings shorter than 2 characters (for instance, really short strings such as ‘I’) and longer than 32 (for instance, extremely long words). We have also discarded high probability concepts (pc > 0.01) which represent stop words and low probability concepts (log(pc ) < −17) which represent very rarely used uncommon terms. Finally, we have discarded substrings that have greater than 10,000 concepts (such as “here”). To disambiguate a phrase, we first consider all combinations of unigrams and bigrams obtained from it. We then map these to Wikipedia concepts, retrieve the concepts with the highest likelihood and select the concept combination that has the highest interconcept semantic relatedness. Inter-concept semantic relatedness is a metric to measure how close the concepts are within a phrase. By maximizing this metric within phrases, we are able to correct cases where low-likelihood but high relatedness concepts would be discarded by a context-free statistical calculation. We use the lch function [22] between the concepts to provide a semantic relatedness measure. This function calculates the closest shared ances-
tor between two articles in Wikipedia category space and has been proved to be a decent approximation of semantic relatedness [28]. For each concept combination, we calculate this function and return the pair with the highest score. Figure 5 graphically illustrates the computation of semantic relatedness between the situation description “Get medical test done” (Use case 1) and category “Doctor’s office” from Foursquare using Algorithm 2. First, we map from word phrases to concepts represented by Wikipedia articles. In this case, the bi-gram “medical test” is linked to the Wikipedia article with the same name. It also links to other articles such as “Apgar score” which is a type of medical test. The Foursquare category “Doctor’s office” links to both “Physician” and “Ambulatory care”. In this case, Ambulatory care has a higher link probability, but Physician is a more probable concept. The next step is to calculate the distance between the two phrases by examining their lch score. If “Physician” were selected, the closest common ancestor is the category “Healthcare Occupations” which leads to a distance of 4. If “Ambulatory care” were selected, the distance between “Medical test” and “Ambulatory care” is 3. We have combined these mechanisms to exploit the execution speed and automatic curation available through crowd sourced platforms such as Wikipedia.
4.
EVALUATION
4.1
Goals and Methodologies
The primary goal of our study is to evaluate the effectiveness of the TellMe system, and its underlying algorithms, in discovering and ranking services and information relevant to a user’s situation or task. We test the validity of our hypothesis - that semantic relatedness can be used as a measure of relevance of information to a user’s situation and can be further used to rank it. To this end, we model our experiments after those in Information Retrieval (IR). In IR, retrieval correctness usually cannot be proved formally and hence, evaluation often relies on human assessment of result quality [30]. Thus, we analyze the results generated by our algorithms through various standard performance measures commonly used in IR, such as Precision and Recall, in order to assess their effectiveness and compare their performance with human generated relevance rankings. We also evaluate TellMe against several qualitative metrics such as generality, response time and robustness. In order to evaluate our system, we used two methodologies:
4.1.1
Live deployment
We recruited 14 (8 male and 6 female) subjects, who were either working professionals or campus community members, to evaluate the TellMe system. None of these subjects had interacted with TellMe or Rover II before and hence, we did not have any usage or interaction logs for them. All the subjects had to import the TellMe calendar event gadget client application (as shown in Figure 4) into their Google calendars and had to authorize it to access their calendar data and current geolocation for a period of 1 month. In addition, the subjects were given specific instructions to use their calendars as the main tool for scheduling appointments, to-do tasks and reminders during the study period. For each calendar entry, the gadget displayed in situ the top 3 ranked services, and information for the top 3 categories for each service, as retrieved by the TellMe server side system, to the subject. Since there maybe personal biases of users towards services, we currently do not remove information for overlapping categories between the ranked services in the results. Also, since the TellMe server side system currently has information about the users’ current location but not about their preferences (for food, music etc.), the results are personalized based on current location only. The subjects were asked to provide feedback by marking the information displayed to them as ‘Relevant’/‘Not relevant’ via the gadget.
4.1.2
Web-based study for Ground Truth collection
The methodology for live deployment doesn’t provide a direct means for evaluating the efficacy of the algorithms via standard IR performance measures. This is because the subjects could not provide Ground Truth on what information they considered relevant in comparison to what the system displayed. Moreover, all the subjects had varying calendar entries (with only a few common ones as shown in Table 1b) and could provide feedback only for their calendar entries. This created sparseness in the results. Hence, we used another methodology to collect ground truth for relevance comparison. After the live deployment, we aggregated the calendar, to-do and reminder entries of all the subjects collected during the live deployment period. We further augmented these with diurnal activities such as ‘Driving’ to generate 120 unique situation and task items. Table 1b shows the most commonly recurring situation and task items collected as part of our user study. All the 14 subjects who participated in the live deployment further participated in a web-based study. For each of the 120 items, they were asked to rank up to 3 services (from among the 8 services currently registered in the TellMe server side system) that they considered most relevant to the task or situation. For each ranked service, they were asked to select up to 3 of its most relevant information categories. If none of the categories seemed relevant to them, they were allowed to provide their own keywords. This collected data was then used as ground truth and we compared the results generated by our system with it.
4.2
Evaluation Metrics and Results
Relevance is a subjective measure and as such there may not be agreement among the users. In our study, there is a small subset of services (such as Yelp, Foursquare and Angie’s List) that have some overlap while others provide mostly mutually exclusive information. As a result, the service rankings responses have high agreement. However, among overlapping services there may be slight disagreement among users that can be caused by personal biases towards services (say preferring Yelp to Foursquare). On the other hand, there are significantly more categories than services. For instance, Yelp had 698 and Foursquare had 402 categories at the time this research was conducted. As stated earlier, the category structures are hierarchical. For instance, the general category “restaurants” subsumes more specific categories such as “Indian restaurants” or "Chinese restaurants". Thus, there is lower agreement for category responses mainly caused by either lack of full knowledge of the categories or by a user’s preferences (causing them to pick more specific categories). To address issues with lack of knowledge of categories, we had provided category autosuggestions (based on substring matching) as a user provided relevant categories in the web-based study. Also, service discovery is the first step for retrieval of relevant information in our system. If the appropriate services are not discovered then the relevant information from them can not be retrieved. Due to these inherent differences in the services and categories discovery process and response spaces, we have split our evaluation to independently evaluate service rankings and categories retrieval.
4.2.1
Service ranking
Although all subjects were asked to rank up to 3 services, most subjects ranked only 1 and in a few cases, 2. On the other hand, our algorithms ranked 3 or 4 candidate services as relevant for each situation item. This created data that is too sparse for a thorough accuracy evaluation and hence, we use alternative measures to show how the algorithms performed with respect to Service Ranking:
Friedman Test. To quantify the consistency of responses, we first applied the Friedman test - a non-parametric statistical test that is used to detect differences in treatments across multiple test attempts. We ap-
Service Yelp Foursquare Angie’s List
1 8 3 2
Rank 2 3 2 0 6 0 1 2
Points
Final Rank
8x3+2x2+0x1=28 3x3+6x2+0x1=21 2x3+1x2+2x1=10
1 2 3
Table 2: Service ranking results for all the 14 users and Calculation of points for each ranked service using Borda counting to generate singe user provided baseline
Spearman's Coefficient Distributions 1.0
0.5
Rho
plied it with an α (significance) level of 0.05 to the service ranking responses of all subjects for all items in our study. We use this to determine how consistent the subjects were in ranking the services for each item and if there were any significant differences in their responses. The null hypothesis of this test, when applied to our study, is that there is no difference in the rankings provided by each user. When a difference occurs, it may imply a matter of differing personal biases towards services or an ambiguous task such as ‘Purchase birthday gift’ which has no obvious “correct” answer. Out of the 120 items, for 85 (70.8 %) the null hypothesis held - there was no significant variation in how subjects ranked the services. 4 (3.3 %) of the situations did not have enough services, ranked by the subjects, to provide a meaningful measurement. This occurred when there were no or very few obvious relevant information providers for the specified situation (for instance, a situation item such as ‘Water the plants’). Finally, there were 31 (25.8 %) situations that showed statistically significant variance in subject response. As previously stated, this may imply some underlying difference in personal biases or situations with no “correct” answer.
0.0
Spearman’s rank correlation coefficient. 0.5
1.0
STS-ASR STS-HSR Wiki-ASR Wiki-HSR User 1 User 2 User 3 User 4 User 5 User 6 User 7 User 8 User 9 User 10 User 11 User 12 User 13 User 14
To provide a single user generated baseline for comparison, we applied Borda counting to combine service ranking results from all subjects into a hybrid service ranking for each situation or task item. Borda counting is a type of preference voting which gives varying points for each rank (more for higher, less for lower ranks). Table 2 shows an example of how Borda counting is applied to subjects’ rankings for the task item ‘Get medical tests done’ in order to generate a single unified ranking. Each cell value (in clomuns 2 -4) represents the # of users who assigned the rank, represented by the column, to the service represented by the row. These rankings are used to calculate the points awarded to each service (column 5) and generate the user baseline ranking (column 6). We then applied Spearman’s rank correlation coefficient (ρ) to measure similarity between the user generated baseline and the various service rankings, generated by the four algorithms and the subjects, for each item in the study. Spearman’s ρ is a nonparametric rank statistic that determines how close two variables are by quantifying the strength of the associations between two vectors. Its value ranges from -1 (perfectly reversed; negatively correlated) to 1 (equal; positively correlated). We measured ρ for each algorithm’s service ranking, for each of the 120 situation items, against the user generated baseline produced by Borda counting. We performed the same measurement for all the test subjects to show how well they performed against the baseline. Figure 6 shows the boxplots for the distribution of ρ for all algorithms and subjects against the baseline. First, we note that the STS-based algorithms are very sensitive to the service scoring function. The STS-HSR algorithm shows very strong correlation with the baseline in both its median and its interquartile range (IQR). In contrast, STS-ASR has the poorest performance in both measures showing little to no correlation in many cases. The Wiki-based algorithms are more closely matched and show very strong correlation in both median and IQR. Unlike the STS-based algorithms, the Wiki-based algorithms perform better with the ASR variant probably because of the tight range of the lch calculation. Overall, the algorithms (sans STS-ASR) show a strong positive correlation with the user generated baseline, thus, proving that they perform comparably to human supplied relevance rankings. We also analyze the subjects’ rankings against the baseline to show that it is reasonable. Examining their coefficients, we see similar variation in responses. Almost all subjects have upper quartiles with ρ > 0.5 showing a medium to strong positive correlation with the baseline. Subjects 2, 3, 6, 10, 13, and 14 show strong positive corrections in almost all cases. Subject 8 has the worst median correlation but a fairly tight variance whereas subject 1 has slightly stronger median performance but the largest variance. Overall, the
Figure 6: Summary of the distribution of ρ between user generated baseline and service rankings of individual algorithms and subjects subjects demonstrate a strong positive correlation with the baseline.
Precision and Precision@k. Spearman’s ρ does not map directly to user experience. Hence, to put these measurements into perspective, we measured Precision (P) and Precision@k (P@k) of the service ranking determined by ∩ Relevant services our algorithms where P = Retrieved services Retrieved services As stated earlier, most subjects ranked only 1 or 2 services as relevant in comparison to our algorithms which ranked 3 or 4 services for each situation item. Hence, for P@k, we set k =1 i.e. we compute the % of times the subjects’ rank #1 service matched with the rank # 1 service returned by each algorithm. Table 3 shows a summary of performance for the user generated baseline and the algorithms for service ranking. We can see that the baseline agrees with the subjects’ ranked # 1 service, 70% of the time and this rank # 1 service would appear in the baseline’s top 3 services, 94% of the time. STS-ASR performs the worst in precision, only agreeing with the subjects’ rank # 1 service 33% of the time and only retrieving the # 1 service in its top 3 results, 53% of the time. STS-HSR and Wiki-ASR have very similar correlation profiles (when considering ρ) but Wiki-ASR outperforms STS-HSR (when considering Precision) retrieving the # 1 service in top 3 results, 87% of the time as opposed to 80% for STS-HSR. Finally, Wiki-HSR, which had a slightly weaker median correlation (for ρ) outperforms all the algorithms, ranking the subjects’ # 1 service as its # 1 service, 77% of the time (more than the user generated baseline) and retrieving it in its top 3 services, 92% of the time (comparable to the user generated baseline). This again demonstrates that the algorithms (sans STS-ASR) perform comparably to humans supplied rankings.
4.2.2
Category analysis
Since there is higher disagreement among category selections by users, mainly because of the huge number of categories to choose from, we do not compute a single user generated baseline for it.
Similar to service ranking, we use the metrics of Precision (P), Recall (R), F-score (F) and Precision@k (P@k) to evaluate category ∩ Relevant categories , retrieval by our algorithms. Here, P = Retrieved categories Retrieved categories Retrieved categories ∩ Relevant categories Relevant categories
2∗P ∗R P +R
R= and F = Table 3 provides a summary of the results for these metrics. First, we examine the % of categories that were retrieved by each algorithm for each situation item and were considered relevant by the users (P). Next, we evaluate the % of relevant categories that were selected by the users and retrieved by each algorithm (R). F is the accuracy measure obtained by computing the harmonic mean of P and R. Finally, we measure P@ k. Since our algorithms return 3 categories for each situation item, we set k = 1. Thus, we measure % of times the users’ rank #1 category matched with the rank # 1 category returned by each algorithm. As evident, the STS-HSR algorithm had the best performance for all metrics. It retrieved the rank # 1 category of users as its rank # 1 category (P@1) around 73% of the time while STS-ASR retrieved it around 57% of the time. In addition, it retrieved useful and relevant categories in its top 3 categories (P) 81% of the time while STS-ASR retrieved them around 66% of the time. Overall, STSHSR has an accuracy (F) of 75% as opposed to STS-ASR which has an accuracy of 60%. STS-HSR outperformed STS-ASR mainly because the ASR scoring function did not rank some of the relevant services (as evident by its poor performance in service ranking) and did not retrieve the categories for them. The Wiki-based algorithms performed much worse with an accuracy of 11%. A reason for their poor performance could be that the lch calculation has a very tight range. For a situation such as “Get medical tests done”, many of the medical-based concepts will have the same score leading them to be returned alphabetically. This helped with service discovery because services such as Yelp (which have several medical categories) would score higher than services such as Google News (which has a single health category). To improve these results, a different tie breaking mechanism, based on category probabilities or user preferences, could be used.
4.2.3
Discussion
Our initial results are highly promising. With respect to service ranking, the proposed algorithms performed comparably to humans. However, for category retrieval, the algorithms performed reasonably. A possible reason could be that the current system does not have information on individual user preferences and hence, cannot personalize the categories for users. Similar to service ranking, all subjects were asked to select up to 3 relevant categories for each ranked service. However, most subjects selected only 1 or 2 categories and their selections reflected their individual preferences for some of the situations (such as ‘Indian restaurants’ for ‘Having Lunch’ rather than just ‘Restaurants’). On the other hand, our algorithms retrieved information for general categories such as ‘Restaurants’ and not for specific categories, such as ‘Indian restaurants’. However, since the aim of this study is to show the value of our approach for bootstrapped discovery and ranking of heterogeneous services and information relevant to a user’s situation, we leave preference tuning for the future. It can be addressed by modeling users’ preferences from various sources such as their social media profiles or via preference elicitation. Thus, a hybrid system that combines our approach with user preference modeling for personalizing the results will achieve an even higher accuracy for category retrieval. Please note that a direct comparison of our work with [31] is not possible as they do not present any accuracy evaluation. Also, we observed that there were some subtle relationships, between a situation item and the relevant information selected by users, which are hard to model using existing NLP techniques. For instance, multiple users selected weather information as relevant information for many of the situations (such as “Mow the lawn"). We believe that these subtleties can be captured by mining terms
Algorithm Baseline Wiki-HSR Wiki-ASR STS-HSR STS-ASR
Service Ranking P P@1 0.94 0.7 0.92 0.77 0.87 0.66 0.8 0.51 0.53 0.33
Category Retrieval P R F P@1 — — — — 0.13 0.1 0.11 0.1 0.13 0.1 0.11 0.1 0.81 0.69 0.75 0.73 0.66 0.55 0.6 0.57
Table 3: Analysis of P and P@1 for service ranking of user generated baseline and algorithms and Summary of P, R, F and P@1 for category retrieval by the algorithms that commonly co-occur in web search queries and using them to boost the SR scores. We are currently working in this direction.
4.2.4
Qualitative Metrics and Results
We further evaluate TellMe against several qualitative metrics: • Flexibility and Generality - We note that we have used webbased services as a primary and motivating information source in our current implementation of the system. However, our approach is flexible enough to incorporate other sources such as databases, and smartphone and desktop applications. This only requires a list of categories of information provided by the new sources, along with an API or an access mechanism to retrieve information. Moreover, the system is not restricted to a domain-specific ontology or static pre-defined rules. Instead, it employs techniques that determine relevant information dynamically from services that provide heterogeneous content. It leverages robust and domain-independent databases such as WordNet and Wikipedia that contain a large amount of world knowledge. As a result, it is generic and can support a wide spectrum of users’ tasks and situations from their daily lives. • Turn around time - The STS and Wikipedia based systems for computing Semantic Relatedness are deployed locally on another server where the language models are held in memory. Hence, the turnaround time is very fast (in the order of ms). Moreover, we cache the SR scores, between categories and situation items, for future use. As a result, any recurring items will have faster turnaround time in subsequent calls. • Bootstrapped and Robustness to cold start - As evident by our experiments, the TellMe system can provide relevant information to new users and for new unanticipated user situations without requiring any user interaction history. Thus, it is bootstrapped and capable of avoiding a cold start.
5.
CONCLUSION AND FUTURE WORK
In this paper, we proposed a novel, general and flexible approach for bootstrapped discovery and ranking of heterogeneous services and information relevant to a user’s situation in context-aware systems. We proposed and implemented the idea of inferring a user’s situations via soft sensing of user generated content. We designed and implemented four variations of a base algorithm that ranked candidate relevant services, and the information to be retrieved from them, based on the semantic relatedness between the information provided by the services and the user’s situation description. We implemented these algorithms as part of a system, called TellMe, and conducted a live deployment with 14 subjects to evaluate their efficacy. To this end, we performed statistical analysis of the ground truth generated by the subjects and compared it with the ranked list of services and categories generated by the algorithms. Our results demonstrate that our algorithms show strong positive correlation with human supplied relevance rankings. Hence, they can be used as an effective means to discover and rank relevant services and information in context-aware systems. For service rankings, the algorithms perform comparably to human generated rankings and baseline. For category retrieval, the STS based algo-
rithms perform reasonably well when compared to users’ responses mainly due to lack of personalization. However, they outperformed Wiki based algorithms by a significant margin. We also demonstrated that our approach is general, flexible and can determine relevant information for new users and unanticipated situations without requiring any user history, thus, avoiding cold start. This is an initial step and lays the groundwork for several new directions of research. As stated earlier, we are working on improving the SR scores by mining terms that co-occur in web search queries and will implement it in future versions of our system. We also plan to capture interaction and usage history for different users as this would enable us to refine and improve information retrieved by modeling their individual preferences and personal biases towards services. Another refinement to the algorithm can be achieved by combining and boosting the results generated by an ensemble of algorithms that performed the best (say Wiki-HSR and STS-HSR). We also plan to enhance the lch computation by boosting parts of the category graph by combining it with the user’s context. In future, with the integration of multiple services and databases that may contain personal information, we envision such a system to efficiently support every possible user situation such as retrieving ‘Medical Notes’ before a scheduled ‘Doctor’s appointment’.
6.
REFERENCES
[1] Google calendar event gadgets reference guide. https://developers.google.com/googleapps/calendar/gadgets/event/. [2] G. D. Abowd, C. G. Atkeson, J. Hong, S. Long, R. Kooper, and M. Pinkerton. Cyberguide: A mobile context-aware tour guide. Wireless networks, 3(5):421–433, 1997. [3] F. Bellotti, C. Berta, A. De Gloria, and M. Margarone. User testing a hypermedia tour guide. IEEE Pervasive Computing, 1(2):33–41, 2002. [4] P. Bhargava, S. Krishnamoorthy, and A. Agrawala. An ontological context model for representing a situation and the design of an intelligent context-aware middleware. In Proceedings of the ACM Conference on Ubiquitous Computing, pages 1016–1025, 2012. [5] A. Broder, M. Fontoura, V. Josifovski, and L. Riedel. A semantic approach to contextual advertising. In Proceedings of the 30th annual international ACM SIGIR conference on Research and development in information retrieval, 2007. [6] H. Chen, T. Finin, and A. Joshi. An intelligent broker for context-aware systems. In Adjunct proc. of Ubicomp, 2003. [7] K. Cheverst, N. Davies, K. Mitchell, and A. Friday. Experiences of developing and deploying a context-aware tourist guide: the guide project. In Proceedings of the 2000 ACM international conference on Mobile computing and networking. [8] S.-C. Chou, W.-T. Hsieh, F. L. Gandon, and N. M. Sadeh. Semantic web technologies for context-aware museum tour guide applications. In Proceedings of the19th IEEE International Conference on Advanced Information Networking and Applications. [9] A. Dey. Understanding and using context. Personal and ubiquitous computing, 5(1):4–7, 2001. [10] E. Gabrilovich and S. Markovitch. Computing semantic relatedness using wikipedia-based explicit semantic analysis. In IJCAI, volume 7, pages 1606–1611, 2007. [11] D. Garlan, D. P. Siewiorek, A. Smailagic, and P. Steenkiste. Project aura: Toward distraction-free pervasive computing. Pervasive Computing, IEEE, 1(2):22–31, 2002. [12] R. Guha, R. McCool, and E. Miller. Semantic search. In Proceedings of the 12th international conference on World Wide Web. ACM, 2003. [13] L. Han, A. Kashyap, T. Finin, J. Mayfield, and J. Weese. Umbc ebiquity-core: Semantic textual similarity systems. In
[14]
[15]
[16] [17] [18]
[19]
[20] [21]
[22] [23]
[24]
[25]
[26]
[27] [28] [29] [30] [31]
[32]
Proceedings of the Second Joint Conference on Lexical and Computational Semantics, 2012. S. Harispe, S. Ranwez, S. Janaqi, and J. Montmain. Semantic measures for the comparison of units of language, concepts or instances from text and knowledge representation analysis. arXiv preprint arXiv:1310.1285, 2013. K. Huang, C. Zhang, X. Ma, and G. Chen. Predicting mobile application usage using contextual information. In Proceedings of the ACM Conference on Ubiquitous Computing, 2012. F. Klan. Context-aware service discovery, selection and usage. In Grundlagen von datenbanken, pages 95–99, 2006. R. Kramer, M. Modsching, J. Schulze, and K. ten Hagen. Context-aware adaptation in a mobile tour guide. In Modeling and using context, pages 210–224. Springer, 2005. T. C. Lech and L. W. Wienhofen. Ambieagents: a scalable infrastructure for mobile and context-aware information services. In Proceedings of the fourth ACM international joint conference on Autonomous agents and multiagent systems (AAMAS), 2005. H. Lu, J. Yang, Z. Liu, N. D. Lane, T. Choudhury, and A. T. Campbell. The jigsaw continuous sensing engine for mobile phone applications. In Proceedings of the 8th ACM Conference on Embedded Networked Sensor Systems, 2010. S. A. McIlraith, T. C. Son, and H. Zeng. Semantic web services. IEEE intelligent systems, 16(2):46–53, 2001. G. K. Mostefaoui, J. Pasquier-Rocha, and P. Brezillon. Context-aware computing: a guide for the pervasive computing community. In Proceedings of the IEEE/ACS International Conference on Pervasive Services, 2004. R. Rada, H. Mili, E. Bicknell, and M. Blettner. Development and application of a metric on semantic nets. Systems, Man and Cybernetics, IEEE Transactions on, 19(1):17–30, 1989. A. Ranganathan and R. Campbell. A middleware for context-aware agents in ubiquitous computing environments. In Proceedings of the ACM/IFIP/USENIX International Conference on Middleware, 2003. D. Salber, A. Dey, and G. Abowd. The context toolkit: aiding the development of context-enabled applications. In Proceedings of the ACM SIGCHI conference on Human factors in computing systems, 1999. C. Shin, J.-H. Hong, and A. K. Dey. Understanding and prediction of mobile application usage for smart phones. In Proceedings of the ACM Conference on Ubiquitous Computing, 2012. V. I. Spitkovsky and A. X. Chang. A cross-lingual dictionary for english wikipedia concepts. In Proceedings of the Eight International Conference on Language Resources and Evaluation, 2012. L. Steller, S. Krishnaswamy, and J. Newmarch. Discovering relevant services in pervasive environments using semantics and context. IWUC, 6:3–12, 2006. M. Strube and S. P. Ponzetto. Wikirelate! computing semantic relatedness using wikipedia. In AAAI, 2006. V. Suraci, S. Mignanti, and A. Aiuto. Context-aware semantic service discovery. In Proceedings of the 16th IEEE IST Mobile and Wireless Communications Summitx, 2007. W. E. Webber. Measurement in information retrieval evaluation. University of Melbourne, Department of Computer Science and Software Engineering, 2011. K. Xu, M. Zhu, D. Zhang, and T. Gu. Context-aware content filtering & presentation for pervasive & mobile information systems. In Proceedings of the 1st ICST international conference on Ambient media and systems, 2008. D. Zhang, Z. Yu, and C. Chin. Context-aware infrastructure for personalized healthcare. Studies in health technology and informatics, 117:154–163, 2005.