T Thhee IInnffoorrm maattiioonn T Teecchhnnoollooggyy aanndd IInnnnoovvaattiioonn F Foouunnddaattiioonn Assessing Broadband in America: OECD and ITIF Broadband Rankings Daniel K. Correa April 2007 While the rate of adoption is a useful metric, it is an insufficient measure of a nation’s broadband performance. A more accurate metric also accounts for cost and speed.
T
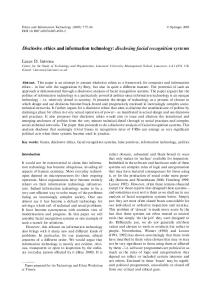
he United States continues to fall behind in broadband adoption, ranking 15th among 30 OECD nations according to the latest installment of the organization’s semiannual survey of broadband subscribership.1 The number of U.S. broadband subscribers per 100 people grew to 19.6 in December 2006, up 0.4 percentage points from 19.2 in June 2006, a growth rate far below the 2.0 percentage point OECD average. Many of the leading European countries – including Denmark, Netherlands, Iceland, Switzerland, and Norway – continue to pull away from the pack with faster adoption rates. When the OECD first collected this data in 2001, the United States ranked 4th among the 30 nations surveyed. After several years of steady decline in the rankings, we now rank 15th (see Figure 1). However, while adoption rate is an important measure, it is not sufficient to accurately assess a nation’s relative position in broadband technology. A more complete measure would also consider speed and price. Increasingly, in the digital economy it is the speed and capacity of the network that matters. Therefore, ITIF has expanded upon the OECD rankings, developing a model that measures broadband penetration, price and speed in OECD countries. The findings show that America, which ranks 12th overall, faces a multifaceted broadband challenge. There are several steps that policymakers should take to ensure faster progress toward ubiquitous high-speed broadband, including: •
Congress should exempt broadband services from federal, state and local taxation and from requirements to pay into the Universal Service Fund.
•
All states should enact video franchise laws.
•
Congress should enact tax incentives for the deployment of new high-speed broadband networks.
•
The FCC should move to a two-tiered definition of high-speed Internet by developing a more robust 3 megabit per second (mbps) asymmetrical “broadband” standard.
April 2007 • The Information Technology and Innovation Foundation • 1
•
The FCC should collect county-level subscriber data for both speed tiers.
•
If Congress fails to mandate changes to FCC local broadband data collection, states should work through non-governmental entities to collect and report local data.
•
The National Telecommunications and Information Administration (NTIA) should help facilitate the development of a bottom-up database of local broadband speeds and prices.
Rank
Figure 1:
U.S. Ranking Among OECD Countries in Broadband Penetration, December 20062
1 2 3 4 5 6 7 8 9 10 11 12 13 14 15 16 17 18 19 20 2001
2002
2003
European Advances In 2001, Korea held a commanding lead in broadband penetration with 17.2 subscribers per 100 people, almost twice the rate of Canada, which ranked second. In recent years, however, several Northern European nations have rapidly increased their subscribership to move to the front of the pack. Eight of the ten leading countries in broadband penetration are in Northern Europe, including the top three (Denmark, Netherlands and Iceland). As these European countries have pushed ahead in subscription rates, the United States and Asian nations such as Korea and Japan have failed to keep up. Indeed, Japan’s 2.5 percentage point increase in broadband penetration last year was the fourth lowest in the OECD, and as a result, the nation dropped from 11th to 14th in the last
2004
2005
2006
year. Over the same period, Korea fell from 2nd to 4th due to sluggish penetration growth in the first half of the year, though the nation’s above average 2.6 percentage point growth over the last six months has kept pace with other leading countries. Meanwhile, broadband penetration growth in the United States has slowed, growing just 3.3 percentage points in the last year compared to the OECD median of 4.3. Over the past six months, America recorded the second slowest growth in the OECD. Only Austria – where broadband penetration per capita actually decreased – fared worse. And while it’s clear that such progress will not move the United States up in the rankings, what is less apparent is how long it will allow us to maintain our current ranking of 15th.
April 2007 • The Information Technology and Innovation Foundation • 2
Luxembourg, France and even Japan overtook America in the last six months. Having already fallen behind most of the European nations where broadband is expanding rapidly, the United States now faces relegation to the bottom half of the rankings. Broadband penetration increased in Australia (16th overall) by 5.5 percentage points last year, and in Germany (18th overall) by 4.1. With persistent robust growth, both of these countries will soon surpass us in the rankings.
Speed and Price Matter While the rate of adoption is a useful metric, it is an insufficient measure of a nation’s broadband performance. A more accurate metric also accounts for cost and speed, two factors which OECD tracks in another report.3 To see why, consider the cases of Japan and Switzerland. Broadband penetration in Switzerland has reached 28.5 subscribers per 100 people, the 5th highest in the OECD. Japan ranks 14th with just 20.2 broadband subscribers per 100 people. From these numbers one might conclude that broadband in Switzerland is more advanced. The real picture, however, is far different. Although a smaller share subscribe in Japan, residents have access to a much more robust network. In the majority of Japan that is served by NTT East, 100 mbps fiber optic service is available to 75 percent of residents, typically for about $27/month (PPP).4 Indeed, Japanese citizens enjoy the fastest broadband in the world at the lowest prices per bit. On the other hand, the fastest connection widely available in Switzerland is 2.4 mbps DSL, at a price of approximately $52/month (PPP).5 That amounts to twice the price of Japanese broadband for a fraction of the performance. Clearly, all broadband is not equal. To capture more completely the state of broadband deployment in OECD countries, we have developed the ITIF Broadband Rankings, a combined measure of penetration on a household basis, the average download speed,
and the price per bit of the fastest generally available technology (see Table 1).6 The first indicator measures household adoption rates. Although the OECD assesses deployment on a per capita basis, household adoption may be a more accurate measure.7 Different average household sizes mean that countries require different numbers of broadband connections to achieve the same levels of penetration. To see why, consider that the average household size in Korea is 3.1 persons compared to 1.9 in Sweden. On average, a single broadband connection (one “subscriber”) in a Korean home gives access to 50 percent more people than a connection does in Sweden. For this reason, Korea’s relative level of broadband penetration is actually significantly higher than the OECD reports (see Table 2).8 As a result, even if the same share of households subscribed in Sweden as in Korea, Korea would rank significantly lower in subscribers per capita because they have larger households. Likewise, some have argued that America is unfairly penalized for its larger average household size. And there appears to be some truth to this claim. Using the household measure, the U.S. penetration ranking does go up somewhat, from 15th to 12th place. The second indicator is average broadband download speed. Speed is important because downloading a 100 MB file at 4 mbps (approximately the speed of most cable broadband in the United States) takes over 3 minutes, while the same file downloads in just 8 seconds at a speed of 100 mbps.9 Higher-speed networks will be crucial if our nation is to fully benefit from broadband technologies and the emerging high bandwidth applications that ride on them. However, measuring speed is not as straightforward as penetration because national networks are normally composed of connections of widely varying speeds. We calculate average download speeds based on OECD data that compiles the advertised speeds offered by several major broadband providers in each country. The OECD gathered this data from national providers wherever possible.10
April 2007 • The Information Technology and Innovation Foundation • 3
Table 1: ITIF Broadband Rankings11 Penetration
Rank 1 2 3 4 5 6 7 8 9 10 11 12 13 14 15 16 17 18 19 20 21 22 23 24 25 26 27 28 29 30
Nation Korea Japan Iceland Finland Netherlands Sweden France Denmark Norway Canada Belgium United States Switzerland Australia Austria Portugal United Kingdom Germany Italy Luxembourg Spain New Zealand Ireland Poland Czech Republic Hungary Greece Slovak Republic Mexico Turkey Average
Speed
Subscribers per Average Speed Household (mbps) 0.90 45.6 0.52 61.0 0.83 6.0 0.57 21.7 0.73 8.8 0.49 18.2 0.49 17.6 0.70 4.6 0.64 7.4 0.62 7.6 0.54 6.2 0.51 4.8 0.68 2.3 0.50 1.7 0.42 7.3 0.42 8.1 0.50 2.6 0.38 6.0 0.38 4.2 0.51 3.1 0.44 1.2 0.36 2.3 0.37 2.2 0.20 7.5 0.27 1.6 0.30 3.0 0.12 1.0 0.16 2.8 0.16 1.1 0.17 2.0 0.46 9.0
Price Price per Month for 1 mbps, Fastest Technology (USD PPP) 0.45 0.27 4.99 2.77 4.31 0.63 1.64 4.92 4.04 6.50 6.69 3.33 21.71 2.39 5.99 10.99 11.02 5.20 3.36 18.48 12.46 9.20 13.82 13.00 24.10 44.24 33.19 50.15 60.01 115.76 16.52
Overall Score 15.73 14.99 12.14 12.11 11.87 11.54 11.41 11.37 11.29 11.11 10.60 10.47 10.40 10.23 10.08 9.92 9.92 9.81 9.78 9.71 9.48 9.26 9.14 8.69 8.11 7.53 6.93 6.58 6.00 3.81 10.00
April 2007 • The Information Technology and Innovation Foundation • 4
Table 2: Penetration Rankings: Per Household vs. Per Capita12 Nation Australia Austria Belgium Canada Czech Republic Denmark Finland France Germany Greece Hungary Iceland Ireland Italy Japan
Per Household 13 18 9 7 25 4 8 16 21 30 24 2 22 20 10
Per Capita 16 17 10 9 25 1 7 13 18 28 24 3 23 20 14
The final measure is the price per bit (USD PPP) of the fastest generally available technology.13 This gives a good indication of whether the highest quality broadband is an affordable option for consumers. It should be noted that an additional measure of broadband availability (as opposed to broadband take-up) would also be useful, but unfortunately such data is not widely available. When penetration, price and speed are considered together, several nations see their ranks change significantly (see Table 3). Korea and Japan move to 1st and 2nd, respectively, both far ahead of the rest due to above average speeds and below average prices, with Korea claiming the top spot because of its more extensive penetration. At 12th overall, America is still stuck in the middle of the pack, ranking 12th in penetration, 15th in average speed, and 6th in price per bit of the fastest available technology. Clearly, slow speeds and slow adoption rates are the twin challenges facing the United States in terms of broadband. However, speeds are beginning to increase in the United States, particularly as fiber is built out by some broadband providers.
Nation Korea Luxembourg Mexico Netherlands New Zealand Norway Poland Portugal Slovak Rep. Spain Sweden Switzerland Turkey U.K. United States
Per Household 1 11 29 3 23 6 26 19 28 17 15 5 27 14 12
Per Capita 4 12 30 2 21 6 26 22 27 19 8 5 29 11 15
Rankings Matter: America is Falling Behind Because ubiquitous high-speed broadband promises important economic and social benefits, it is important to track our progress towards that goal. Yet there are those who argue that America’s lagging broadband position should provide no cause for worry. These Panglossians generally make five main arguments. The first two critique ranking methodology while the last three dispute the basis for examining rankings at all. First, some point to America’s low population density as justification for slower broadband penetration. Certainly, it is far less costly to deploy broadband infrastructure to urban apartment buildings in Seoul than to rural towns in Wyoming. The problem with this argument is that the majority of Americans do not live in rural towns in Wyoming. In fact, densities in leading Scandinavian countries are about half that of the United States.14 However, because the majority of citizens in OECD countries live in urban areas, a nation’s overall population density is not an accurate measure. For example,
April 2007 • The Information Technology and Innovation Foundation • 5
Table 3: Different Measures, Different Ranks15 Nation Japan France Portugal Denmark Luxembourg Switzerland
OECD Broadband Penetration Rank 14 13 22 1 12 5
though Australia is the least densely populated country in the OECD, 93 percent of its citizens live in urban areas (the 3rd highest percentage in the OECD). Therefore, a more appropriate gauge of population density – “urbanicity” – takes into account both the percentage living in urban areas and the average density of those areas.16 Among OECD nations, there is virtually no correlation between a country’s “urbanicity” and its level of broadband penetration (0.07). In other words, OECD countries with more densely urban populations do not necessarily have higher levels of broadband take-up. Population density is not a sufficient explanation for America’s lagging broadband penetration. Second, some find fault with the OECD’s measurement of broadband penetration on a per capita basis, claiming that America is actually ahead on an absolute basis. But by the same token, America also leads the OECD in number of non-subscribers, and we certainly do not hear anybody touting that dubious accomplishment. In short, the only way to make meaningful international comparisons – for broadband and most other measures – is by accounting for different country sizes. This means measuring broadband on a per capita or per household basis. Otherwise, we are comparing apples to oranges. However, as we note above, an assessment based on households is the more accurate measure and on that measure America’s performance is somewhat better. The third critique dismisses concern about America’s broadband position as near-sighted.
ITIF Broadband Rank 2 7 16 8 20 13
Rank Change ↑ 12 ↑ 6 ↑ 6 ↓ 7 ↓ 8 ↓ 8
These critics argue that European ascendance is ephemeral because European countries have been able to achieve higher speeds by relying on DSL enabled by shorter European local loop lengths. Shorter loop lengths allow for faster speeds over copper wires. This is one reason why, for example, Sweden’s TeliaSonera offers download speeds up to 24 mbps on its DSL network. However, because of a general lack of cable competition, European telecom regulatory authorities have promoted competition in large part through unbundling the local loop. It is not likely that Europe can continue down a DSL path, as speeds are limited by the technology itself. Whether they will be able to develop the faster fiber networks of the future is not clear. Only time will tell as to whether or not Europe is facing a DSL “cul-de-sac.” Fourth, some claim that rankings do not matter because market forces alone dictate the proper pace of broadband adoption. If more American consumers wanted broadband or consumers needed faster speeds, we would have more and faster broadband. In fact, other nations, the argument goes, may have “too much” broadband due to market-distorting government subsidies. What this argument overlooks is that broadband is different than most items consumers purchase. In the case of broadband, there are market failures that hinder the market from supplying the amount necessary to optimize total social benefits.17 These market failures involve various forms of what economists call “positive externalities.” For example, the fastest broadband connections simultaneously support a host of digital video, voice, and data applications. Yet the development and
April 2007 • The Information Technology and Innovation Foundation • 6
high-speed broadband data services. Currently, they are required to go through a time-consuming process of obtaining cable TV franchise agreements in every community in a state. In order to facilitate that process, states should enact statewide franchise laws. A number of states, including California, Indiana, Kansas, Michigan New Jersey, North Carolina, South Carolina, Texas, and Virginia, have already passed franchise reform legislation.
deployment of these applications – such as telemedicine – is hindered by a classic “chicken or egg” dilemma: they will not develop without a market of high-speed broadband subscribers, but consumers need these applications as a lure to enter the high-speed broadband market in the first place. Finally, there are those who discount the notion of rankings entirely, claiming they are meaningless because countries are different. To be sure, attending to rankings for their own sake is misguided. But we need to examine these measures because they yield useful information about the upper limit of what is possible. Japan, for example, has demonstrated that deploying an affordable 100 mbps fiber network can be done. Nobody would argue that America is exactly like Japan, but many technological, economic, and geographic obstacles are shared between countries. For this reason, studying rankings is both important and instructive.
•
Congress should enact temporary tax incentives for the deployment of new high-speed broadband networks, including allowing telecommunications companies to expense new high-speed broadband investments in the first year. It should come as no surprise that many of the top ranking nations rely on such incentives to spur the deployment of their advanced telecommunications infrastructures. For example, Japan and Korea have allowed providers to write off the cost of building their high-capacity fiber networks. Likewise, Austria and Sweden offer broadband consumers tax deductions for broadband expenses.
•
The FCC should move to a two-tiered definition of high-speed Internet services, with a more robust 3 mbps asymmetrical “broadband” standard to balance the existing 200 kbps standard. The FCC currently considers service to be “highspeed” if it exceeds 200 kilobits per second (kbps) in one direction. This standard – far below that set in most countries – is out of date, rendering FCC data collection and reporting efforts less useful than they could be. The proposed 3 mbps standard should be an evolving one to reflect the fact that basic uses of the Internet will inevitably change over time and our definition of broadband must keep up.
•
Congress should mandate that the FCC collect county-level subscriber data for both speed tiers. The current practice of tracking broadband availability by zip code – as defined by the presence of a
Policy Recommendations Although it is beyond the scope of this policy brief to outline a comprehensive broadband policy, there are several steps that the United States should take to boost broadband penetration and climb in the rankings. In fact, because several nations ranking below America are adopting broadband at faster rates, merely remaining in 15th place will require prompt action. A number of immediate steps will be instrumental: •
Congress should exempt broadband services from federal, state and local taxation and from requirements to pay into the Universal Service Fund for at least the next five years, until many more Americans subscribe to higher-speed broadband. This is critical because broadband adoption is sensitive to prices and marginally lower prices would spur more deployment.18
•
All states should enact video franchise laws. A number of telecommunications carriers are rolling out higher-speed fiber optic video services, which also include
April 2007 • The Information Technology and Innovation Foundation • 7
single broadband subscriber in a particular zip code – is woefully insufficient. It makes it very difficult for local, state and national policy makers to actually know where broadband is and is not available. Actual subscriber data is only available at the state level.19 Better data means a better understanding of where we stand and more informed policymaking to meet a goal of ubiquitous broadband. However, Congress should ensure that such data is exempt from Freedom of Information Act rules in order to protect sensitive company data. •
•
If Congress fails to mandate changes to FCC local broadband data collection, states should work through nongovernmental entities to collect and report local data. In the absence of federally-provided local broadband data, some states have already taken the initiative. ConnectKentucky, a non-governmental organization, has developed a viable model for tracking county-level broadband subscriber rates in Kentucky.20 Because the organization is not subject to the government’s Freedom of Information Act, broadband providers have been more willing to disclose potentially sensitive data. It is a model that other states should follow.
should help facilitate the development of a bottom-up database of local broadband speeds and prices. Broadband penetration data alone does not tell the full story. Accordingly, efforts also must be made to collect price and speed data at the local level. This could most easily be accomplished with an open-source model, whereby participating broadband consumers across the country could visit a website to test the speed of their internet connection and voluntarily enter their zip code and monthly service price. With the help of mapping technology such as that offered by Google Maps, the resulting proliferation of data points could very quickly yield a nationwide picture of local broadband deployment, prices and speeds.
Conclusion The broadband future promises a digital world we can only imagine, with a host of economic and social benefits accruing to all Americans. Yet reaching that future will require first acknowledging the scope of the broadband challenge we face, and responding decisively. By taking these steps now, we will accelerate down the path to our digital future.
The National Telecommunications and Information Administration (NTIA)
Endnotes 1
OECD Directorate for Science, Technology, and Industry, “Broadband Statistics to December 2006,” (April 2007):
. 2
Ibid.
3
OECD Directorate for Science, Technology, and Industry, “Multiple Play: Pricing and Policy Trends,” (April 2006):
4
Takashi Ebihara, “Presentation: Understanding the Japanese Broadband Miracle,” (Washington, DC: The Information Technology and Innovation Foundation, April 2007): . All prices cited in this report are adjusted for Purchasing Power Parity (PPP). The PPP exchange rate equalizes the purchasing power of two currencies measured against a fixed basket of goods.
April 2007 • The Information Technology and Innovation Foundation • 8
5
OECD Directorate for Science, Technology, and Industry, April 2006.
6
The penetration data used, from December 2006, is more recent than the available price and speed data, which is from September 2005. 7
OECD measures penetration on a per capita basis because comprehensive data on household penetration is generally unavailable. ITIF has used average household size as a multiplier to convert OECD per capita penetration data to household penetration data. It should be noted that one problem with this method is that the OECD data likely also includes some DSL business subscribers. 8
Data for average household size were obtained from a variety of sources. 2001 household data for 15 European countries were taken from Eurostat, “Tables: Population and Social Conditions.” The most recent household data available for the remaining 15 countries were obtained either through their respective national statistical agencies or “Encyclopaedia Britannica Online,” www.britannica.com, which compiles these data. 9
There are 8 megabits in a megabyte, so a 100 megabit per second connection takes 8 seconds to transmit a 100 megabyte file. 10
OECD’s 2006 report “Multiple Play: Pricing and Policy Trends” benchmarks the speed offerings of some major incumbent DSL, cable and fiber providers in OECD countries. We recognize that this is not a perfect measure because these speeds may not be perfectly representative, but believe that it provides the best and most current possible snapshot. Our methodology for calculating broadband speed in the ITIF Broadband Rankings involves averaging the speeds of the incumbent DSL, cable and fiber offerings provided in OECD’s April 2006 “Multiple Play” report, with each assigned a weight according to that technology’s respective percentage of the nation’s overall broadband subscribership, as reported in OECD’s “Broadband Statistics to December 2006.” For nations that did not have a listed fiber speed in the “Multiple Play” report but had fiber subscribers, a speed of 10 mpbs was assigned. This analysis omits alternatives to these technologies because the data do not allow for an accurate calculation of their market share. However, the market share of most alternative technologies is minimal in OECD countries.
11
OECD Directorate for Science, Technology and Industry and ITIF calculations. Each nation’s overall score is the sum of its standard deviation score for each of the three indicators. For indicator methodology, see endnotes 7, 10 and 13.
12
OECD Directorate for Science, Technology, and Industry and ITIF calculations.
13
USD price per bit (PPP) of the fastest available technology is calculated from the broadband offerings examined in the OECD’s “Multiple Play: Pricing and Policy Trends” report.
14
The United States has the 12th highest urban population percentage in the OECD, according to United Nations, “World Population Prospects: The 2004 Revision,” (2004). 15
OECD Directorate for Science, Technology, and Industry and ITIF calculations.
16
Urban population data obtained from United Nations, “World Population Prospects: The 2004 Revision,” (2004). Population density of largest metropolitan areas obtained from Demographia, “Demographia World Urban Areas,” (March 2007): .
17
Robert D. Atkinson and Andrew S. McKay, “Digital Prosperity: Understanding the Economic Benefits of the Information Technology Revolution,” (Washington, DC: The Information Technology and Innovation Foundation, 2007): .
April 2007 • The Information Technology and Innovation Foundation • 9
18
Austan Goolsbee, “The Value of Broadband and the Deadweight Loss of Taxing New Technology,” NBER Working Paper 11994 (National Bureau of Economic Research, Feb. 2006): . 19
Robert D. Atkinson and Daniel K. Correa, “2007 State New Economy Index,” (Washington, DC: The Information Technology and Innovation Foundation, Feb. 2007): .
20
See www.connectkentucky.org.
Sources: ITIF Broadband Rankings Penetration: OECD Directorate for Science, Technology, and Industry, “Broadband Statistics to December 2006,” (April 2007): . Price: OECD Directorate for Science, Technology, and Industry, “Multiple Play: Pricing and Policy Trends,” (April 2006):
Speed: OECD Directorate for Science, Technology, and Industry, “Multiple Play: Pricing and Policy Trends,” (April 2006):
About the Author Daniel K. Correa is a Research Analyst at the Information Technology and Innovation Foundation and co-author of ITIF’s 2007 State New Economy Index.
About the Information Technology and Innovation Foundation The Information Technology and Innovation Foundation (ITIF) is a nonprofit, non-partisan public policy think tank committed to articulating and advancing a pro-productivity, pro-innovation and protechnology public policy agenda internationally, in Washington and in the states. Through its research, policies proposals, and commentary, ITIF is working to advance and support public policies that boost innovation, e-transformation and productivity. For more information contact ITIF at 202-449-1351 or at [email protected], or go online to www.innovationpolicy.org ITIF • 1250 I St. N.W. • Suite 200 • Washington, DC 20005
April 2007 • The Information Technology and Innovation Foundation • 10