Bronx Community District 11

See BX 11's profile online

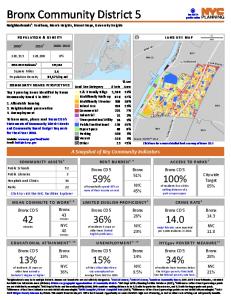
Neighborhoods1: Allerton, Bronxdale, Indian Village, Morris Park, Pelham Gardens, Pelham Parkway, Van Nest PO P U L ATI O N & D E N S I T Y 2000-2010

110,706

113,232

+2%

Website: www.nyc.gov/bxcb11 Email: [email protected]

Public Schools

47

Hospitals and Clinics

34

3 6

Click to visit the NYC Facilities Explorer

M E A N C O M M U T E T O W O R K 4, 8

42 minutes

Bronx 43 minutes

NYC 40

minutes

E D U C AT I O N A L AT TA I N M E N T 4 , 1 0

Bronx CD 11

24%

of residents 25 years or older have earned a bachelor's degree or higher

t Av BX E Tremon 6

ver Pkw y BX 10

BX 9

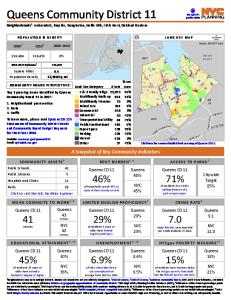
Source: PLUTOTM 16v2

Click here for a more detailed land use map of Bronx CD 11

A Snapshot of Key Community Indicators

CO M M U N I T Y A S S E T S 5

Bronx CD 11

Bronx Park

Pelham Bay Park

in son R i

To learn more, please read Bronx CD 11's Statements of Community District Needs and Community Board Budget Requests for Fiscal Year 2018.

Pelham Pkwy

Bronx River Pkwy

1. Crime 2. Neighborhood preservation 3. Traffic

% Lot Land Use Category # Lots Area 1 & 2 Family Bldgs 9,215 42% Multifamily Walk-up 1,692 9% Multifamily Elevator 159 9% Mixed Use 383 4% Commercial 338 8% Industrial 68 2% Transportation/Utility 77 2% Public/Institutional 136 18% Open Space 15 1% Parking 227 2% Vacant 382 2% Other 20 1%

Hutch

3.6 31,453/sq mi

Top 3 pressing issues identified by Bronx Community Board 11 in 2017:

Parks

BX 12

130,836

COMMUNITY BOARD PERSPECTIVES

Public Libraries

nH ill R d

y

Square Miles Population Density

E Gu

hrw

20103

0.5

Miles

New E nglan d T

20002

2011-2015 Estimate4

LA N D U S E M A P

[

Bronx 19% NYC 36%

R E N T B U R D E N 4, 6

Bronx CD 11

47%

of households spend 35% or more of their income on rent

Bronx 51% NYC 45%

LI M I T E D EN GL I S H P RO FI CI EN C Y 4

Bronx CD 11

23%

of residents 5 years or older have limited English proficiency

Bronx 26% NYC 23%

U N E M P L OY M E N T 4 , 1 0

Bronx CD 11

13.2%

of the civilian labor force was unemployed on average from 2011 to 2015

Bronx 14% NYC 9.5%

A C C E S S TO PA R KS 7

Bronx CD 11

86%

of residents live within walking distance of a park or open space

C R I M E R AT E 9

Bronx CD 11

9.4

major felonies were reported per 1,000 residents in 2016

Citywide Target 85%

Bronx 14.3 NYC 11.8

N YC g o v P O V E R T Y M E A S U R E 1 1

Bronx CD 11

22%

of residents have incomes below the NYCgov poverty threshold. See the federal poverty rate here.

Bronx 28% NYC 21%

Neighborhoods may be in multiple districts. Names and boundaries are not officially designated. 22000 US Census; 32010 US Census; 4American Community Survey 2011-2015 5-Year Estimates, calculated for Public Use Microdata Areas (PUMAs). PUMAs are geographic approximations of community districts. 5NYC Dept of City Planning Facilites Database (2017); 6 Differences of less than 3 percentage points are not statistically meaningful. 7NYC Dept of Parks and Recreation (DPR) (2016). DPR considers walking distance to be 1/4 mile for parks less than 6 acres, and 1/2 mile for larger parks and pools. 8 Differences of less than 2 minutes are not statistically meaningful. 9NYPD CompStat, Historic Complaint Data (2017); 10 Differences of less than 2 percentage points are not statistically meaningful. 11 20112015 NYCgov Poverty Measure by PUMA. This metric from the Mayor's Office for Economic Opportunity accounts for NYC's high cost of housing, as well as other costs of living and anti-poverty benefits. 1

Bronx Community District 11 - GitHub

Square Miles. Population Density. 3.6. 31,453/sq mi. [. 0.5. Miles. 1Neighborhoods may be in multiple districts. Names and boundaries are not officially designated. 22000 US Census; 32010 US Census; 4American Community Survey 2011-2015 5-Year Estimates, calculated for Public Use Microdata Areas (PUMAs).

530KB Sizes 0 Downloads 286 Views

Recommend Documents

Bronx Community District 2 - GitHub
for Public Use Microdata Areas (PUMAs). PUMAs are geographic approximations of community districts. BX 2 shares PUMA 3710 with BX 1, and the ACS population estimate cannot be reliably disaggregated. 5NYC Dept of City Planning Facilites Database (2017

Bronx Community District 4 - GitHub
4%. 1%. 1 & 2 Family Bldgs. Multifamily Walk-up. Multifamily Elevator. Mixed Use. Commercial. Industrial. Transportation/Utility. Public/Institutional. Open Space. Parking. Vacant. Other. 748. 1,095. 305. 317. 194. 37. 59. 164. 92. 181. 198. 25. M aj

Bronx Community District 1 - GitHub
Square Miles. Population Density. 2.2. 41,590/sq mi. [. 0.5. Miles. 1Neighborhoods may be in multiple districts. Names and boundaries are not officially designated. 22000 US Census; 32010 US Census; 4American Community Survey 2011-2015 5-Year Estimat

Bronx Community District 8 - GitHub
Page 1. 23%. 4%. 15%. 2%. 3%. 1%. 2%. 16%. 16%. 1%. 17%.

Bronx Community District 5 - GitHub
This metric from the Mayor's Office for Economic Opportunity accounts for NYC's high cost of housing, as well as other costs of living and anti-poverty benefits. Land Use Category. % Lot. Area. # Lots. Click here for a more detailed land use map of B

Bronx Community District 7 - GitHub
2015 NYCgov Poverty Measure by PUMA. This metric from the Mayor's Office for Economic Opportunity accounts for NYC's high cost of housing, as well as other costs of living and anti-poverty benefits. Land Use Category. % Lot. Area. # Lots. Click here

Bronx Community District 10 - GitHub
Street flooding. To learn more, please read Bronx CD 10's · Statements of Community District Needs · and Community Board Budget Requests · for Fiscal Year 2018. A Snapshot of Key Community Indicators. Website: www.nyc.gov/bronxcb10. Email: [email protected]

Bronx Community District 9 - GitHub
This metric from the Mayor's Office for Economic Opportunity accounts for NYC's high cost of housing, as well as other costs of living and anti-poverty benefits. Land Use Category. % Lot. Area. # Lots. Click here for a more detailed land use map of B

Bronx Community District 3 - GitHub
for Public Use Microdata Areas (PUMAs). PUMAs are geographic approximations of community districts. BX 3 shares PUMA 3705 with BX 6, and the ACS population estimate cannot be reliably disaggregated. 5NYC Dept of City Planning Facilites Database (2017

Bronx Community District 6 - GitHub
11%. 16%. 10%. 8%. 7%. 3%. 3%. 25%. 6%. 6%. 3%.

Bronx Community District 1 Basemap - GitHub
B. R. O. N. X. K. ILL. Mill. Pond. Park. Franz. Sigel. Park. St. Mary's. Park. Randall's. Island Park. EAST 149 ST. EAST 149 ST. 3 AVBRIDGE. BR. OO. K. AV. GR. AN. D. CO. NC. O. UR. SE. EAST 140 ST. CY. PR. ESS A. V. EAST144 ST. EAST 136 ST. EAST 143

Bronx Community District 2 Basemap - GitHub
South. Brother. Island. Rainey. Park. Soundview. Park. Tiffany. Street Pier. Barretto. Point Park. C o n cre te. P lan t P ark. Bronx. River. Parkway. North. Brother. Island. LAFAYETTE AV. HUNTS. PO. INT. AV. BARRETTO. ST. LONGWOOD. AV. BR. UC. KN. E

Bronx Community District 5 Basemap - GitHub
Crotona. Park. Tremont. Park. Sherman. Creek. Devoe. Park. St. James. Park. C lare m o n t. P ark. Bridge Park. Highbridge. Park. Harlem River Park. PRO. SPECT AV. OA. K. TR. EE. PL. EA. ST. 183 ST. HIG. H. BR. ID. GE. EA. ST. 181. ST. GRAND CONCOURS

Bronx Community District 3 Basemap - GitHub
RD. BRUCKN. ER. EX. PY. ST ANNSAV. TOW. NSEND AV. EA. ST. 174 ST. BR. ID. GE. BROOK AV. BROOK AV. CLA. REM. ON. T. PK. W. Y. W. ESTCH. EST. ER. AV. W. ESTCH. EST. ER. AV. TINTON AV. EA. ST. 16. 3ST. UNION AV. BRUCKN. ER. BLVD. BRYANTAV. BRUC. KN. ER.

Bronx Community District 12 Basemap - GitHub
DEMEYER ST. DELANOY AV. EAST 234 ST. MARION. AV. BRITTO. NST. ROMBOUTS AV. EAST 241 ST. EAST 243 ST. EAST 204 ST. PELHAM BRIDGE. YOUNG AV. EAST 210 ST. VIREO AV. CHESTER ST. HOLLAND AV. EAST 215 ST. VARIAN AV. DARK ST. EAST 239 ST. TILLOTSON AV. WOOD

Brooklyn Community District 11 - GitHub
BK 13. BK 15. Brooklyn Community District 11. Neighborhoods1: Bath Beach, Bensonhurst, Gravesend, Mapleton. Top 3 pressing issues identified by. Brooklyn Community Board 11 in 2017: LAND USE MAP. 172,129. 181,981. +6%. POPULATION & DENSITY. 20002. 20

Manhattan Community District 11 - GitHub
Email: [email protected] · See MN 11's · profile online. Manhattan. 18%. 33%. NYC. 21%. Manhattan CD 11 of residents had incomes · below the poverty level.

2010 Census Tracts within Bronx Community District 5 - GitHub
Note: Census tracts and community district boundaries are not coterminous. Some census tracts span multiple community districts or park areas. For census tract data visit Census FactFinder at maps.nyc.gov/census. Community. District Boundary. 2010 Ce

2010 Census Tracts within Bronx Community District 4 - GitHub
Note: Census tracts and community district boundaries are not coterminous. Some census tracts span multiple community districts or park areas. For census tract data visit Census FactFinder at maps.nyc.gov/census. Community. District Boundary. 2010 Ce

2010 Census Tracts within Bronx Community District 7 - GitHub
Note: Census tracts and community district boundaries are not coterminous. Some census tracts span multiple community districts or park areas. For census tract data visit Census FactFinder at maps.nyc.gov/census. Community. District Boundary. 2010 Ce

Queens Community District 11 Basemap - GitHub
LONGISLANDEXPY. LONG. ISLAND EXPY. LONGISLANDEXPY. 194 LA. 94 AV. 33 AV. 214 PL. 212 ST. JAMAICA AV. JAMAICA AV. 214 ST. 34 AV. UNION TPKE. UNION TPKE. UNION TPKE. UNION TPKE. UNIONTPKE. UNION TPKE. 69 AV. SPRINGFIELD. BLVD. SPRINGFIELD. BLVD. 212PL.

2010 Census Tracts within Bronx Community District 8 - GitHub
Note: Census tracts and community district boundaries are not coterminous. Some census tracts span multiple community districts or park areas. For census tract data visit Census FactFinder at maps.nyc.gov/census. Community. District Boundary. 2010 Ce