Chronic Myeloid Leukemia: Origin, Development, Response to Therapy, and Relapse David Dingli, MD, PhD *
*†
†
, Arne Traulsen, PhD , and Jorge M. Pacheco, PhD
†‡
Division of Hematology, Mayo Clinic College of Medicine, Rochester, MN 55905,
USA †
‡
Program for Evolutionary Dynamics, Harvard University, Cambridge, MA 02138, USA ATP-Group, CFTC & Departamento de Física da Faculdade de Ciências, P-1649-003
Lisboa Codex, Portugal ABSTRACT The introduction of imatinib, the first of a family of abl kinase inhibitors, opened a new era in the therapy of chronic myeloid leukemia (CML). The majority of treated patients achieve complete cytogenetic response, although the disease is often still detectable by molecular techniques. Using a mathematical model for the architecture of hematopoesis and progression of the disease as well as clinical data, we develop a unified framework which models the origin and clonal expansion of CML, the response to abl kinase inhibitors and relapse upon cessation of therapy. The model predicts that a small pool of mutated stem cells is enough to drive CML. Inhibition of the abl kinase decreases the self-renewal capability of CML progenitors, altering their fitness compared to normal progenitors. Persistence of CML progenitors, however, is responsible for the rapid relapses observed upon cessation of therapy. We demonstrate how the architecture of hematopoiesis plays an instrumental role both in growth of the CML clone and its response to treatment. A small pool of stem cells is enough to drive the chronic phase of CML. Imatinib reverses the fitness advantage of CML cells allowing return of normal hematopoiesis in most patients. Persistence of CML progenitor cells seems to be responsible for the observed relapse kinetics.
1
INTRODUCTION Chronic myeloid leukemia (CML) is one of the classic myeloproliferative disorders
1, 2
that has served as a paradigm in hematology and oncology. The disease is
characterized by the Philadelphia chromosome
3
where the c-abl proto-oncogene,
normally present on chromosome 9, is translocated to the major breakpoint cluster region (bcr) on chromosome 22. The result is the formation of the bcr-abl fusion gene and its aberrant expression as an oncoprotein 4. This oncoprotein is the target of imatinib mesylate, the first of a series of recently designed reversible abl-kinase inhibiting drugs 5 that gives high response rates in patients with this disease
6, 7
. There is still some
controversy whether bcr-abl alone is responsible for the development of the disorder 8. Recent work on the age-specific incidence of CML
9
and animal models suggest that
aberrant expression of bcr-abl in hematopoietic stem cells (HSC) may be enough to explain the chronic phase of the disease
10, 11
. CML is a true HSC disorder since bcr-abl
is found in both myeloid and lymphoid cells, including a small fraction of T and NK cells 12
. A characteristic feature of CML is expansion of granulocyte production with
extramedullary hematopoiesis leading to splenomegaly and an increase in the circulating number of granulocytes and their precursors. Normal marrow output in an adult is ~ 3.5 × 10¹¹ cells/day, while output in patients with CML often exceeds 1012 cells/day 8, a
3-fold increase. The current consensus is that the HSC pool is not expanded in CML
13, 14
.
However, it has been shown that bcr-abl induces the production of IL-3 and G-CSF by progenitor cells that may act in an autocrine fashion to enhance self-renewal of more mature progenitors leading to progenitor cell expansion 15. Moreover, it is known that the combination of IL-3 and G-CSF can enhance the limited self-renewal capability of hematopoietic progenitor cells
16
. Therefore, current evidence suggests that while CML
arises in the HSC, it is driven by progenitor cell expansion due to a higher probability of limited self-renewal of these cells 17, 18. In addition, when CFU-GM isolated from patients
with CML are exposed to pharmacologically achievable concentrations of imatinib in vitro, they display a decrease in self-renewal capability down to normal or subnormal
levels 19. A major difference between HSC and progenitor self-renewal is that HSC can self-renew for much longer than progenitor cells. Hence HSC contribute to hematopoiesis
2
for a long time (possibly the life-time of the mammal) while progenitor cells contribute to hematopoiesis for a few weeks to months at most. There is still considerable controversy on whether imatinib actually induces cell death in the most primitive CML cells. Under normal conditions, hematopoiesis can be metaphorically represented by a multi-compartmental model in dynamic equilibrium in which cells “move” from one compartment to the next as they become increasingly differentiated 20. In a healthy adult, approximately 400 HSC, that replicate on average once per year 21, 22 are responsible for the daily marrow output of ~ 3.5 × 10¹¹ cells. In this work, we investigate how CML perturbs this system in order to understand clonal expansion as well as the response to therapy and relapse upon cessation of treatment.
MATERIALS AND METHODS
Allometric scaling and experimental evidence suggests that hematopoiesis is maintained by an active pool of ~400 HSC in a healthy adult
21, 22
. These cells replicate
~1/year and yet are responsible for a normal marrow output of ~ 3.5 × 10¹¹ cells per day. A recently developed multi-compartment model of hematopoiesis
20
has linked the slow
replication of the HSC with the high cellular output of the bone marrow. In this model, cell division in any compartment i leads to two daughter cells that are either transferred to the next downstream compartment ( i + 1, compatible with differentiation) or the cells retain the properties of their parent and stay in the same compartment (self-renewal)
20
.
The probability of differentiation is ε, whereas the probability of self-renewal is given by 1 − ε . Both probabilities are considered to be constant across normal hematopoiesis. The
normal value of ε was determined as ε 0 = 0.85. In the case of normal hematopoiesis, we could estimate the total number of divisions (K) that link the HSC with the circulating compartment as well as the exponential increase in replication rate that occurs between compartments ( r ≈ 1.26 )
20
. Our estimate for K (~31) is compatible with prior
predictions 23-25, while the estimated values of both ε and r proved robust with respect to changes in the number of HSC contributing to hematopoiesis suggesting that they are characteristics of hematopoiesis. The parameters of this model for healthy individuals were determined using data from polymorphonuclear leukocyte production, the number
3
of active hematopoietic stem cells, the average output of the bone marrow, and the rates of cell division of stem cells and granulocyte precursors 20.
Model constraints
The total number of active HSC in patients with CML is not expanded
13, 14
, but
there is an increase in the number of myeloid progenitors by >14% 26 due to higher selfrenewal ( ε CML < ε 0 )
17, 27
. We assume that whenever the marrow output exceeds 1012
cells per day, CML is diagnosed 8 and treatment starts long before hematopoiesis reaches a stationary state under the reduced ε. The only known external hazard for the development of CML is radiation exposure and from observations of the population exposed to the Hiroshima nuclear detonation, it appears that the time for the disease to become clinically evident ranges from 3.5 to 6 years
28
. We utilize these experimental
observations to constrain our parameter fits. Disease progression
Although the number of cells in compartment
i , N i , is an integer, we can
approximate the average dynamics by a differential equation. During hematopoiesis, the number of cells in each compartment i ≥ 1 changes as: N& i = −d i ⋅ N i + bi −1 ⋅ N i −1
(1)
where d i = (2ε − 1)ri represents the rate at which cells leave compartment “i” and bi −1 = 2 ⋅ ε ⋅ ri −1 represent the rate at which cells originating from compartment “ i + 1 ” are
injected in compartment “ i ”. The stationary state N& i = 0 leads to the model of normal hematopoiesis
20
. In this case, N 0 is constant and given by N 0 ≈ 400
22
, leading to an
influx of r0 ⋅ 2 ⋅ ε ⋅ N 0 into the first compartment. Experimental data suggests, that even in CML, N 0 is not expanded and hence we assume it remains ~400 13, 14. A mutation in the HSC compartment leads to 1 cancer stem cell, in our case a CML stem cell, and N 0 − 1 normal HSC. In such a scenario we have to consider two different systems of equations,
Eq. (1) for normal cells with ε 0 = 0.85 and a second equation, formally
identical to the first, but for CML cells ( N iCML ) with ε CML < ε 0 . The dynamics of disease
4
expansion is shown in Figure 1B, and corresponds to the initial growth of the bcr-abl/bcr ratio. Increased cell replication
The model allows us to estimate the average number of divisions C that a cell experiences during its trajectory from the stem cell compartment to the peripheral blood. If the number of compartments for normal hematopoiesis is given by K, then it follows that C¥K. Let D=C-K. A cell in compartment i moves to compartment i + 1 with probability ε or makes an amplification step with probability 1-ε. The probability that a given cell undergoes D divisions that do not lead to the next compartment is given by a Poisson distribution with a characteristic parameter λ = K (1 − ε ) ,
λ D −λ P( D) = e . D! Therefore, C = K + P ( D ) = K + K (1 − ε ) . Hence, CML cells with a decreased ε will on average undergo more cell divisions (>4), as indicated by experimental observations 29. Treatment with abl kinase inhibitors
We simulate the effect of, e.g., imatinib by modifying ε CML to normal (or supra-normal) levels in those CML cells to which the drug binds. In this way, the advantage of the clone is lost
19
. Mature cells are not sensitive to the effects of the drug and simply undergo
apoptosis as dictated by their natural life history. The tumor burden in CML is monitored using the bcr-abl to bcr ratio determined via quantitative real-time polymerase chain reaction (Q-RT-PCR), such that reductions in the absolute amount of bcr-abl/bcr detected serially in patients are considered to infer a decrease in tumor burden. During imatinib therapy, a fraction, z of CML cells responds to treatment. Thus, the number of CML cells in compartments i ≥ 1 , changes as: CML IMAT CML N& iCML = −(1 − z ) ⋅ d iCML ⋅ N iCML − z ⋅ d iIMAT ⋅ N iCML + (1 − z ) ⋅ biCML −1 N i −1 + z ⋅ bi −1 N i −1
where the definitions of d and b remain the same except that ε must be replaced by the appropriate one for the IMAT and CML coefficients, respectively. In our model, we obtain ε CML , ε IMAT and z from a least squares fit to clinical data for bcr-
abl/bcr 30. In principle, our model has a total of only 7 parameters: The differentiation probabilities for the three types of cells, the increase in the replication rate r = ri / ri −1 , the
5
fraction of cells responding to treatment z, the number of compartments K and the number of mutated stem cells. However, three of these parameters, ε0 , K and r are fixed from the outset, based on data obtained in healthy individuals 20. Fitting the model to the available clinical data for bcr-abl/bcr from the study of Michor et al. 30 fixes ε CML , ε IMAT and z, and hence we are left with a single undetermined parameter, the number of mutated stem cells. We analyze our model for a different number of mutated stem cells in compartment 0, taking into account that bcr-abl expression increases self-renewal in progenitor cells 19 but not in the HSC 31. The results of the best fits of z , ε CML and ε IMAT are presented in Figure 2B for the three phases of the disease: before, during and after imatinib treatment. Finally, we tested the model and parameter values obtained previously on an independent dataset published by Roeder et al.32 that has the advantage of up to 6 years of follow-up. A very good agreement is obtained, as shown in Figure 1D.
RESULTS Disease progression
Details about the model are provided in the Materials and Methods section. We start from the view of normal hematopoiesis as a hierarchical multi-compartmental structure connecting hematopoietic stem cells to terminally differentiated cells. In each compartment, cells stochastically differentiate with the same probability ε 0 , or selfrenew otherwise. CML originates in the aberrant expression of the abl kinase which takes place in some stem cells (CML stem cells). This acts to modify the probability of differentiation of the CML cells ( ε CML ) across compartments.
Hence, our free
parameters are the number of CML stem cells which drive the disease, the probability of differentiation of the CML cells ( ε CML ) and the impact of therapy (via e.g., imatinib) on this differentiation probability ( ε IMAT ). We fix the model parameters via a fit to the available experimental data for bcr-abl by Q-RT-PCR from Michor et al
30
, shown in
Figure 1A. The results indicate that CML cells exhibit a differentiation probability
ε CML = 0.72 while normal hematopoietic cells have ε 0 = 0.85 20. Starting from a single
6
mutated stem cell, it takes ~5.8 years for full blown disease to appear, associated with a marrow output >1012 cells/day.
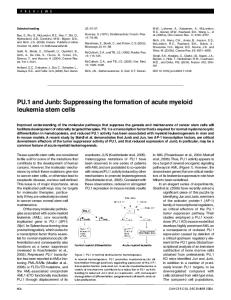
Figure 1. CML dynamics before and under imatinib therapy. (A) Our model was fitted to experimental data for bcr-abl/bcr obtained from cohorts of patients with CML treated with imatinib. We consider the data from Michor et al 30. Solid squares and error bars represent the median and quartiles, respectively, for a given time point after the start of therapy. Solid circles joined with a dashed line represent the best fit obtained for ε CML = 0.72, ε IMAT = 0.90 with 4.6% of the cells responding to imatinib, CML being driven by a single CML stem cell. (B) The time interval from initiation to full-blown disease depends on the number of CML stem cells (NCML) which drive the disease; time to diagnosis decreases as NCML increases. A larger NCML also leads to a less than optimal depth of response to imatinib. (C) The model is robust with very little change in parameter estimates as NCML is varied from 1 to 8. (D) Fitting of an independent dataset from Roeder et al 32, using the parameters obtained in (C) confirms the robustness and validity of the model.
As the number of CML stem cells increases, the time required for the disease to become clinically diagnosed decreases, with 8 neoplastic stem cells giving rise to the disease in
7
3.8 years (Figure 1B). This is compatible with the data from Hiroshima after the nuclear weapons detonation in 1945 28. The best fit to the data was obtained when the number of active CML stem cells was 1 to 2 cells. The condition, ε CML < ε 0 leads to an increased self-renewal capability of CML mutated cells. This is supported by experimental data showing a higher frequency of self renewal in CML progenitors
19
and compatible with the concept of an enhanced fitness
for mutations that increase the self-renewal capability of cells
33
. In addition, the
parameters in Figure 1A, in which CML is initially driven by a single mutated stem cell, imply that patients with CML have a CFU-GEMM pool that is expanded by ~14% compared to healthy adults, in excellent agreement with the data from
14, 26
. Although
slight changes in ε alter the kinetics of the disease (Figure 1C), the overall features remain unchanged, showing the robustness of the model. Imatinib treatment
In this section we refer explicitly to imatinib, given that we are comparing our model results with experimental data involving patients treated with this drug. However, most of our results should also apply to other abl kinase inhibitors. Despite their increased potency and broader spectrum of inhibition, they should induce a qualitatively similar response of the hematopoietic system even in imatinib-resistant patients. At any time step, imatinib is taken up by normal and CML cells. It is active only in bcr-abl expressing cells where it modifies the value ε CML in a fraction of the cells. Imatinib increases ε CML to supra-normal levels, ε IMAT > ε 0 > ε CML (Figure 1C), giving
normal cells a fitness advantage
19
. In this respect, it is noteworthy that imatinib is the
first drug in the history of cancer therapy that reduces the fitness of mutant cells compared to normal cells, enabling the latter to dominate most compartments and return hematopoiesis to normal or near-normal levels. Circulating cells have a finite life-time and are continuously being washed out. Therefore the response to imatinib is also determined to a great extent by the underlying architecture and dynamics of hematopoiesis. As a result, the disease burden decreases by 3 to 4 log (Figure 1A and D) as observed clinically
7, 30
. The steep slope in the response to imatinib is determined by
the efficacy of the interaction between the drug and CML cells. Our model suggests that
8
at any time, ≈ 5% of the cells are responding to imatinib. A higher fraction of cells responding to the drug leads to a faster rate of decay. Such behavior is expected to take place with more recent drugs, such as nilotinib or dasatinib, which are known to bind more effectively to the abl kinase 34. Despite therapy, CML progenitors persist (albeit with a lower ε ). As long as resistance to imatinib does not develop, the disease burden decreases (Figure 1 and 2) until it reaches a plateau. The level of this plateau depends on i) the relative advantage of normal progenitor cells compared to their CML counterparts in the presence of imatinib, and ii) the number of CML stem cells that drive the disease. The same parameter estimates obtained based on the data of Michor et al.
30
are
also compatible with the data reported by Roeder et al. 32 for an independent set of CML patients treated with imatinib (Figure 1D) but with (a more than 5 times) longer followup. Note that the values obtained for both ε CML and ε IMAT (the disadvantage given to CML progenitors by imatinib) do not vary significantly as the pool of CML stem cells expands from 1 to 8 (Figure 1C), compatible with the fact that these two parameters are characteristics given to the cell due to bcr-abl expression in the absence, and presence of imatinib respectively. Relapse after cessation of therapy
The model predicts that once therapy is stopped, relapse occurs rapidly (Figure 2A) as observed clinically Michor et al
30
30
. This suggests that the rapidity of relapse reported by
is based on a persistent pool of CML progenitors that rapidly take over
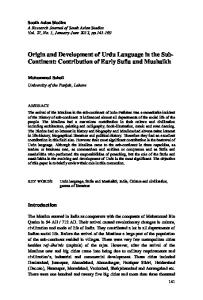
hematopoiesis once treatment is withdrawn. The reversible interaction between ablkinase inhibitors and bcr-abl allows CML cells to regain their enhanced fitness compared to normal progenitors when therapy is stopped. These observations also explain why relapse kinetics occurs promptly and is much faster compared to the initial growth of the tumor before therapy: the drug does not simply reduce the tumor burden and re-set the clock. Results show that if treatment is given for 3 years with an excellent response and then withheld, the disease burden will reach pre-therapeutic levels within ~2 years in the
absence of acquired resistance to the drug (Figure 2A) although relapse will be detectable much earlier at the molecular level. Without CML progenitors, the process would take ~4 years. On the other hand, the reversible nature of imatinib (as well as other abl kinase
9
inhibitors, albeit exhibiting longer binding times) is also directly responsible for the rapidity of the overall relapse upon cessation of therapy. Indeed, for an irreversible ablkinase inhibitor, a considerable delay in the time to relapse is predicted, as shown in Figure 2B.
Figure 2. Myeloproliferation in the presence of CML and response to therapy. (A) Starting with 1 CML stem cell, the disease takes almost 6 years to be clinically diagnosed (same parameters as in Figure 1A). When therapy with imatinib starts, the characteristic 2 slope response emerges as a consequence of the underlying architecture of the bone marrow. However, CML progenitors persist and if imatinib is stopped after 3 years of therapy, relapse occurs rapidly being driven by the progenitors; hence the steeper slope compared to the initial growth of the disease. (B) Therapy with an irreversible abl kinase inhibitor will lead to a longer time to relapse once therapy is stopped, relapse occurring also at a slower rate.
DISCUSSION
In this work, we propose a unified framework for the dynamics of CML to include the expansion of the clonal population from a single mutant cell, the response to therapy using abl kinase inhibitors as well as relapse once treatment is withdrawn. To this end, we start from a hierarchical, multi-compartmental description of hematopoiesis and investigate in which way CML cells differ from normal cells and how they influence the dynamics of hematopoiesis. Subsequently, we studied how abl kinase inhibitors influence the overall dynamics of CML. The model is compatible with the available experimental data on this disorder. While the total number of active HSC in CML is not expanded, there is an increase in the number of myeloid progenitors
26
14
. Expression of bcr-abl in
progenitor cells enhances their self-renewal 27 resulting in an increase in the size of each subsequent compartment: The effect is slowly transmitted and amplified throughout all
10
downstream compartments with the result that the total daily marrow output increases. For the purposes of our model and in the absence of available quantitative data, we assume that, similar to normal hematopoiesis, CML mutated cells express the same ε CML in all compartments. This may be modified once experimental data become available. Moreover our results do not critically depend on it, while the clinical data are compatible with an overall reduction of ε . Our work shows that the disease can be driven by a very small pool of bcr-abl positive hematopoietic stem cells that replicate slowly. Indeed, one CML stem cell may be enough to drive the disorder. Bcr-abl does not give a fitness advantage to the CML stem cell 31 within the most primitive pool and so expansion of this cell lineage within the HSC pool will proceed by neutral drift. However, whenever the CML stem cell pool expands, the time for diagnosis gets progressively shorter. The model illustrates how the architecture and dynamics of hematopoiesis enable the progeny of CML stem cells to dominate hematopoiesis and how therapy itself benefits from the same architecture to control the disease. Given the small number of CML stem cells driving the disease, one expects it will be very unlikely to eradicate these cells. Simple mass action considerations show how difficult it is for imatinib or other abl kinase inhibitors to interact effectively with such a small population of cells. The enhanced fitness bestowed by Bcr-abl expression in CML progenitors is manifest as a higher self-renewal capability that leads both to myeloproliferation and domination of hematopoiesis by the CML clone. The higher self-renewal capability of CML progenitors ( ε CML < ε 0 ) also results in a higher number of cell divisions for the clonal cells compared to controls, leading to shorter telomeres as reported by Brummendorf et al
29
. The model predicts that all else being
equal, patients with a smaller pool of CML stem cells will have a larger reduction in tumor burden compared to those with a larger number of active CML stem cells. CML stem cell expansion by neutral drift within the active stem cell pool 35 provides a potential explanation for the variability in the depth of responses observed clinically despite the lack of mutant (drug resistant) cells. Tumor cells can acquire resistance to imatinib, an observation that fuelled the introduction of novel agents such as dasatinib and nilotinib to control most of the imatinib resistant mutants of bcr-abl
34, 36
. Both nilotinib and dasatinib are more potent 11
than imatinib in inhibiting the abl kinase
34
. Our model predicts that therapy with these
agents should lead to a faster decline in the tumor burden with a higher fraction of cells responding to therapy ( z > 5% ). However, the reduction of disease burden will depend on how much the drug is capable of reversing the value of ε DRUG with respect to normal ( ε 0 ). Simulations for a hypothetical drug that irreversibly inhibits abl (Figure 2B) suggest that the benefit of such an approach will be to substantially delay relapse of the disease together with a slower rate of disease expansion. Therapeutic approaches that lower the number of CML stem cells will be necessary to reduce the disease burden further. The model presented here is not the first mathematical model for CML progression and response to imatinib. In a seminal paper, Michor et al.30 made the first approach to tackle this problem. Shortly after that, Roeder et al.32 pointed out some potential problems with this model and proposed a more elaborate approach. The work presented here is a further step, as the model is based on the architecture of hematopoiesis in healthy individuals. One remarkable feature of chronic phase CML is that while marrow production is enhanced, the function of the produced cells is fairly normal. The previous models
30, 32
did not explicitly discuss marrow expansion, while in our model,
myeloproliferation under normal cell replication rates occurs naturally. Furthermore, both models are based on the ‘two slope’ decay of the bcr-abl/bcr ratio in response to imatinib 30, 32
. This has been interpreted as a consequence of four operational compartments that
comprise hematopoiesis: hematopoietic stem cells, progenitor cells, differentiated cells and mature cells. The parameters of this four-compartment model of hematopoiesis were adjusted to reproduce the ‘two slope’ decay for one year of therapy. Perhaps unsurprisingly, longer follow-up treatments cannot be explained without extending this model30. In fact, a close look at individual patient data indicates that the two slope proposition may not reflect the response to therapy well enough. This notwithstanding, yet another phenomenological model of CML has been introduced by specifically
imposing a 2-slope decay in response to imatinib 32. As a result, the authors conclude that stimulating CML stem cells to replicate would increase imatinib sensitivity. However, stimulating stem cell proliferation could increase the risk of acquired resistance to imatinib with failure of therapy. A study combining G-CSF with imatinib therapy was 12
initiated in patients with CML 37, based on this model.32. The study was stopped due to a lack of benefit and a potential for harm could not be excluded 38. Both prior models assume that relapse is driven only by CML stem cells. Here, we propose that the fast relapse dynamics, often observed after stopping therapy, are due to the persistence of a significant number of CML progenitors. Recently, Rousselot et al 39
reported that some patients have not experienced relapse after a median of 18 months
of stopping imatinib. Our model predicts that relapse can occur up to 4 years after stopping therapy. Consequently, we believe that it is premature to assume that patients are actually cured. Moreover, the fact that a significant number of patients in that report had prior treatment with interferon alpha - an agent that is known to induce delayed therapeutic effects and that can cure some patients with this disease - limits what can be inferred about the effect of imatinib in this group of patients. Our model shows that the ‘two slopes’ emerge due to the combined effect of drug efficiency and the fact that only a fraction of the cells are responding to imatinib at any time. The model originates from a compartmental architecture of hematopoiesis which, under normal conditions, maintains a stochastic dynamic equilibrium between adjacent compartments, compatible with current thinking of hematopoiesis as a stochastic process 40, 41
. It predicts that newer abl-kinase inhibitors with a higher affinity for the kinase will
lead to faster responses. Finally, for the first time it was possible to assess how many active stem cells might actually drive a tumor. Our prediction of a small number of cells is in keeping with the clonal nature of a tumor as well as recent experimental data proving that a single cancer stem cell can lead to full tumor development in an animal model 42. The apparent ease with which CML cells can be engrafted in immunodeficient mice to induce a disease similar to CML might suggest that the pool of CML stem cells may be large. However, recent results show that such engrafted cells disappear after a few weeks, suggesting that the CML cells injected were not stem cells. The difficulty in successfully identifying CML stem cells correlates with our results which predict that the number of CML stem cells is small 43.
Abl kinase inhibitors reverse the fitness advantage of CML cells inducing characteristic response profiles under therapy. Once the fitness of CML progenitors is reduced, normal progenitors take over hematopoiesis with the normalization of blood
13
counts and elimination of the Philadelphia chromosome by FISH
6, 7
. However, CML
progenitors (not simply CML stem cells) persist and are responsible for rapid relapse once treatment is stopped, even in the absence of acquired resistance to the drug. If relapse was simply driven by the persistence of CML stem cells, the time taken for relapse would be significantly longer. Our work suggests that abl kinase inhibitors alone may not be able to eliminate CML. However, by reducing the disease burden, they may enhance the anti-CML immune response that could be able to suppress the disease even further and perhaps operationally cure some patients.
Acknowledgements and Funding
The authors wish to thank Dr Franziska Michor, Professor Martin A. Nowak (Harvard University) and Dr Susan Branford (Adelaide) for many helpful suggestions. This work was supported by Mayo Foundation (DD), “Deutsche Akademie der Naturforscher Leopoldina” (AT) and FCT Portugal (JMP). The Program for Evolutionary Dynamics is supported by J. Epstein.
14
REFERENCES 1. Fialkow PJ, Jacobson RJ, Papayannopoulou T. Chronic myelocytic leukemia: clonal origin in a stem cell common to the granulocyte, erythrocyte, platelet and monocyte/macrophage. Am J Med 1977;63(1):125-30. 2. Goldman JM. Chronic myeloid leukemia-still a few questions. Exp Hematol 2004;32(1):2-10. 3. Rowley JD. Letter: A new consistent chromosomal abnormality in chronic myelogenous leukaemia identified by quinacrine fluorescence and Giemsa staining. Nature 1973;243(5405):290-3. 4. Groffen J, Stephenson JR, Heisterkamp N, de Klein A, Bartram CR, Grosveld G. Philadelphia chromosomal breakpoints are clustered within a limited region, bcr, on chromosome 22. Cell 1984;36(1):93-9. 5. Druker BJ, Tamura S, Buchdunger E, et al. Effects of a selective inhibitor of the Abl tyrosine kinase on the growth of Bcr-Abl positive cells. Nat Med 1996;2(5):561-6. 6. Druker BJ, Guilhot F, O'Brien SG, et al. Five-year follow-up of patients receiving imatinib for chronic myeloid leukemia. N Engl J Med 2006;355(23):2408-17. 7. Hughes TP, Kaeda J, Branford S, et al. Frequency of major molecular responses to imatinib or interferon alfa plus cytarabine in newly diagnosed chronic myeloid leukemia. N Engl J Med 2003;349(15):1423-32. 8. Holyoake TL, Jiang X, Drummond MW, Eaves AC, Eaves CJ. Elucidating critical mechanisms of deregulated stem cell turnover in the chronic phase of chronic myeloid leukemia. Leukemia 2002;16(4):549-58. 9. Michor F, Iwasa Y, Nowak MA. The age incidence of chronic myeloid leukemia can be explained by a one-mutation model. Proc Natl Acad Sci U S A 2006;103(40):14931-4. 10. Daley GQ, Van Etten RA, Baltimore D. Induction of chronic myelogenous leukemia in mice by the P210bcr/abl gene of the Philadelphia chromosome. Science 1990;247(4944):824-30. 11. Zhao RC, Jiang Y, Verfaillie CM. A model of human p210(bcr/ABL)-mediated chronic myelogenous leukemia by transduction of primary normal human CD34(+) cells with a BCR/ABL-containing retroviral vector. Blood 2001;97(8):2406-12. 12. Martin PJ, Najfeld V, Hansen JA, Penfold GK, Jacobson RJ, Fialkow PJ. Involvement of the B-lymphoid system in chronic myelogenous leukaemia. Nature 1980;287(5777):49-50. 13. Udomsakdi C, Eaves CJ, Swolin B, Reid DS, Barnett MJ, Eaves AC. Rapid decline of chronic myeloid leukemic cells in long-term culture due to a defect at the leukemic stem cell level. Proc Natl Acad Sci U S A 1992;89(13):6192-6. 14. Jamieson CH, Ailles LE, Dylla SJ, et al. Granulocyte-macrophage progenitors as candidate leukemic stem cells in blast-crisis CML. N Engl J Med 2004;351(7):657-67. 15. Jiang X, Lopez A, Holyoake T, Eaves A, Eaves C. Autocrine production and action of IL-3 and granulocyte colony-stimulating factor in chronic myeloid leukemia. Proc Natl Acad Sci U S A 1999;96(22):12804-9. 16. Marley SB, Lewis JL, Gordon MY. Progenitor cells divide symmetrically to generate new colony-forming cells and clonal heterogeneity. Br J Haematol 2003;121(4):643-8. 17. Marley SB, Gordon MY. Chronic myeloid leukaemia: stem cell derived but progenitor cell driven. Clin Sci (Lond) 2005;109(1):13-25. 18. Gordon MY, Marley SB, Lewis JL, et al. Treatment with interferon-alpha preferentially reduces the capacity for amplification of granulocyte-macrophage progenitors (CFU-GM) from patients with chronic myeloid leukemia but spares normal CFU-GM. J Clin Invest 1998;102(4):710-5. 19. Marley SB, Deininger MW, Davidson RJ, Goldman JM, Gordon MY. The tyrosine kinase inhibitor STI571, like interferon-alpha, preferentially reduces the capacity for
15
amplification of granulocyte-macrophage progenitors from patients with chronic myeloid leukemia. Exp Hematol 2000;28(5):551-7. 20. Dingli D, Traulsen A, Pacheco JM. Compartmental architecture and dynamics of hematopoiesis. PLoS ONE 2007;2:e345. 21. Buescher ES, Alling DW, Gallin JI. Use of an X-linked human neutrophil marker to estimate timing of lyonization and size of the dividing stem cell pool. J Clin Invest 1985;76(4):1581-4. 22. Dingli D, Pacheco JM. Allometric Scaling of the Active Hematopoietic Stem Cell Pool across Mammals. PLoS ONE 2006;1:e2. 23. Vaziri H, Dragowska W, Allsopp RC, Thomas TE, Harley CB, Lansdorp PM. Evidence for a mitotic clock in human hematopoietic stem cells: loss of telomeric DNA with age. Proc Natl Acad Sci U S A 1994;91(21):9857-60. 24. Mackey MC. Cell kinetic status of haematopoietic stem cells. Cell Prolif 2001;34(2):7183. 25. Shochat E, Stemmer SM, Segel L. Human haematopoiesis in steady state and following intense perturbations. Bull Math Biol 2002;64(5):861-86. 26. Primo D, Flores J, Quijano S, et al. Impact of BCR/ABL gene expression on the proliferative rate of different subpopulations of haematopoietic cells in chronic myeloid leukaemia. Br J Haematol 2006;135(1):43-51. 27. Marley SB, Davidson RJ, Goldman JM, Gordon MY. Effects of combinations of therapeutic agents on the proliferation of progenitor cells in chronic myeloid leukaemia. Br J Haematol 2002;116(1):162-5. 28. Ichimaru M, Ishimaru, T., Mikami, M., Yamada, Y., Ohkita, T. Incidence of leukemia in a fixed cohort of atomic bomb survivors and controls, Hiroshima and Nagasaki October 1950December 1978: Technical Report RERF TR 13-81. Radiation Effects Research Foundation, Hiroshima (1981). 1981. 29. Brummendorf TH, Holyoake TL, Rufer N, et al. Prognostic implications of differences in telomere length between normal and malignant cells from patients with chronic myeloid leukemia measured by flow cytometry. Blood 2000;95(6):1883-90. 30. Michor F, Hughes TP, Iwasa Y, et al. Dynamics of chronic myeloid leukaemia. Nature 2005;435(7046):1267-70. 31. Huntly BJ, Shigematsu H, Deguchi K, et al. MOZ-TIF2, but not BCR-ABL, confers properties of leukemic stem cells to committed murine hematopoietic progenitors. Cancer Cell 2004;6(6):587-96. 32. Roeder I, Horn M, Glauche I, Hochhaus A, Mueller MC, Loeffler M. Dynamic modeling of imatinib-treated chronic myeloid leukemia: functional insights and clinical implications. Nat Med 2006;12(10):1181-4. 33. Dingli D, Traulsen A, Michor F. (A)Symmetric stem cell replication and cancer. PLoS Comput Biol 2007;3(3):e53. 34. O'Hare T, Walters DK, Stoffregen EP, et al. In vitro activity of Bcr-Abl inhibitors AMN107 and BMS-354825 against clinically relevant imatinib-resistant Abl kinase domain mutants. Cancer Res 2005;65(11):4500-5. 35. Dingli D, Traulsen A, Pacheco JM. Stochastic dynamics of hematopoietic tumor stem cells. Cell Cycle 2007;6(4):461-6. 36. Shah NP, Tran C, Lee FY, Chen P, Norris D, Sawyers CL. Overriding imatinib resistance with a novel ABL kinase inhibitor. Science 2004;305(5682):399-401. 37. Heaney NB, Holyoake TL. Therapeutic targets in chronic myeloid leukaemia. Hematol Oncol 2007;25(2):66-75. 38. Heaney N, Drummond M, Kaeda J, et al. A phase 3 study of continuous imatinib versus pulsed imatinib with or without G-CSF in patients with chronic phase CML who have achieved a complete cytogenetic response to imatinib. Blood 2007;110(11):313A (Abstract 1033).
16
39. Rousselot P, Huguet F, Rea D, et al. Imatinib mesylate discontinuation in patients with chronic myelogenous leukemia in complete molecular remission for more than 2 years. Blood 2007;109(1):58-60. 40. Gordon MY, Blackett NM. Routes to repopulation--a unification of the stochastic model and separation of stem-cell subpopulations. Leukemia 1994;8(6):1068-72; discussion 72-3. 41. Abkowitz JL, Catlin SN, Guttorp P. Evidence that hematopoiesis may be a stochastic process in vivo. Nat Med 1996;2(2):190-7. 42. Zucchi I, Sanzone S, Astigiano S, et al. The properties of a mammary gland cancer stem cell. Proc Natl Acad Sci U S A 2007;104(25):10476-81. 43. Tauer J, Shultz L, Holyoake T, Bhatia R. Normal short-term but reduced long-term engraftment capacity of CML hematopoietic cells with skewed myeloid lineage differentiation is seen in an improved mouse model of human hematopoiesis. Blood 2007;110(110):991A (Abstract 3383).
17