From www.bloodjournal.org at UNIV OF CHICAGO on January 16, 2009. For personal use only.
Prepublished online Dec 24, 2008; doi:10.1182/blood-2008-05-154302
Population specific genetic variants important in susceptibility to cytarabine arabinoside cytotoxicity Christine M. Hartford, Shiwei Duan, Shannon M. Delaney, Shuangli Mi, Emily O. Kistner, Jatinder K. Lamba, R. Stephanie Huang and M. Eileen Dolan
Information about reproducing this article in parts or in its entirety may be found online at: http://bloodjournal.hematologylibrary.org/misc/rights.dtl#repub_requests Information about ordering reprints may be found online at: http://bloodjournal.hematologylibrary.org/misc/rights.dtl#reprints Information about subscriptions and ASH membership may be found online at: http://bloodjournal.hematologylibrary.org/subscriptions/index.dtl
Blood (print ISSN 0006-4971, online ISSN 1528-0020), is published semimonthly by the American Society of Hematology, 1900 M St, NW, Suite 200, Washington DC 20036. Copyright 2007 by The American Society of Hematology; all rights reserved.
Blood First Edition Paper, prepublished online December 24, 2008; DOI 10.1182/blood-2008-05-154302 From www.bloodjournal.org at UNIV OF CHICAGO on January 16, 2009. For personal use only.
Population Specific Genetic Variants Important in Susceptibility to Cytarabine Arabinoside Cytotoxicity
Christine M. Hartford1, Shiwei Duan2, Shannon M. Delaney2, Shuangli Mi2, Emily O. Kistner3, Jatinder K. Lamba4, R. Stephanie Huang2 and M. Eileen Dolan2*
Department of 1Pediatrics, 2Medicine and 3Health Studies, University of Chicago, Chicago, IL 60637; 4Department of Experimental and Clinical Pharmacology, University of Minnesota, Minneapolis, MN 55455
Running Title: Genes contributing to ara-C toxicity Key words: ara-C, gene expression, HapMap (CEPH, Yoruban), pharmacogenomics
*Address for correspondence and reprints: M. Eileen Dolan, 5841 S. Maryland Ave. Box MC2115, University of Chicago, Chicago, IL 60637. Phone: (773) 702-4441; Fax: (773) 702-0963; E-mail:
[email protected]
Copyright © 2008 American Society of Hematology
From www.bloodjournal.org at UNIV OF CHICAGO on January 16, 2009. For personal use only.
Abstract Cytarabine arabinoside (ara-C) is an antimetabolite used to treat hematologic malignancies. Resistance is a common reason for treatment failure with adverse side effects contributing to morbidity and mortality. Identification of genetic factors important in susceptibility to ara-C cytotoxicity may allow for individualization of treatment. We employed an unbiased whole genome approach using lymphoblastoid cell lines derived from individuals of European (CEU) or African (YRI) ancestry to identify these genetic factors. We interrogated more than 2 million single nucleotide polymorphisms (SNPs) for association with susceptibility to ara-C and narrowed our focus by concentrating on SNPs that affected gene expression. We identified a unique pharmacogenetic signature consisting of 4 SNPs explaining 51% of the variability in sensitivity to ara-C among the CEU and 5 SNPs explaining 58% of the variation among the YRI. Population-specific signatures were secondary to either: 1) Polymorphic SNPs in one population but monomorphic in the other; 2) Significant associations of SNPs with cytotoxicity or gene expression in one population but not the other. We validated the gene expressioncytotoxicity relationship for a subset of genes in a separate group of lymphoblastoid cell lines. These unique genetic signatures comprise novel genes that can now be studied further in functional studies.
2
From www.bloodjournal.org at UNIV OF CHICAGO on January 16, 2009. For personal use only.
Introduction Cytarabine arabinoside (ara-C) is an antimetabolite used primarily for the treatment of hematologic malignancies and is the mainstay of treatment for acute myeloid leukemia (AML). The inclusion of ara-C into the treatment regimens for AML has resulted in an improvement in remission rates and overall survival in both adults and children 1-3. In a recently published study from the Children’s Oncology Group of 901 individuals < 21 years of age who were treated for AML, the 5-year overall survival was 52% 4, although among certain groups of patients outlook is better. For example, among patients on the same study who underwent matched related donor bone marrow transplant, a 68% overall survival was achieved. Among adults, a study from the Cancer and Leukemia Group B of 474 patients < 60 years of age demonstrated a 34% 5- year overall survival rate 5. However, further improvements are needed. Resistance to chemotherapy, including araC, is a major reason for treatment failure among patients with AML 6-10. Treatment with ara-C is also associated with a number of adverse side effects including myelosuppression, infections, mucositis, neurotoxicity and acute pulmonary syndrome 1114
. Greater sensitivity to the cytotoxic effect of ara-C may translate into an increased risk
of adverse side effects in host normal tissue. Candidate gene approaches have been used to identify genetic variables that are important in resistance and susceptibility to ara-C. These studies have mainly focused on genes in the pharmacokinetic pathway of ara-C including deoxycytidine kinase (DCK) 8,15-19
, cytidine deaminase (CDA)
8,20,21
, 5’- nucleotidease (NT5C2) 8,19,22, and human
equilibrative nucleoside transporter 1 (hENT1) 8,21. Although genetic factors important in the pharmacodynamic effects of ara-C have not been studied as extensively, those that
3
From www.bloodjournal.org at UNIV OF CHICAGO on January 16, 2009. For personal use only.
have been studied include DNA polymerase 6, topoisomerase I and II 6, and bcl-2 23. Although some of the more recent studies have considered DNA sequence variation and alternative splicing of these candidate genes 15,16,18,24, however the major focus has been on variation in gene expression in leukemic blasts. Some studies have shown an association between expression and either sensitivity to ara-C or outcome; however the true contribution of genetic variation of these candidate genes to susceptibility to ara-C remains inconclusive. In addition, the genetic contribution to ara-C induced toxicity in germline DNA has not been comprehensively evaluated. Clinical trials demonstrate potential race-specific differences in outcomes and toxicities among patients with AML 25-27. These patients receive ara-C as a main component of their treatment regimen, raising the possibility that the pharmacogenetics of this agent may play a role in differences in outcomes. In addition, Lamba et al. observed higher mRNA expression for DCK in lymphoblastoid cell lines (LCLs) with African ancestry compared to those of European ancestry and identified a single nucleotide polymorphism (SNP) in DCK that associated with both DCK expression in the LCLs as well as lower blast ara-CTP concentrations in patients administered ara-C 15. To identify population specific genetic determinants that contribute to susceptibility to ara-C, we first examined SNPs in DCK and then applied a whole genome pharmacogenomic approach to cellular susceptibility to ara-C in two distinct populations. A similar approach has been used in evaluating pharmacodynamic genes important in cisplatin and etoposide through the use of LCLs with publicly available genotypic data 28,29
. These cell lines provide a well-controlled, reproducible system free from
confounding factors such as patient co-morbidities and drug-drug interactions.
4
From www.bloodjournal.org at UNIV OF CHICAGO on January 16, 2009. For personal use only.
Furthermore, cell lines derived from individuals of different populations allow for the identification of population-specific genetic determinants. Identifying genetic factors that are responsible for variation in both pharmacokinetic and pharmacodynamic genes will be useful in designing pharmacogenomic endpoints for clinical trials aimed at identifying patients who may be at increased risk for toxicity (due to increased sensitivity to ara-C) or treatment failure (due to decreased sensitivity to ara-C) and therefore require either dose modifications or alternative therapies.
Materials and Methods Cell lines. International HapMap EBV-transformed LCLs were purchased from Coriell Institute for Medical Research (Camden, NJ). Cell lines were derived from Utah residents with ancestry from northern and western Europe (HAPMAPT01, CEU) and from Yoruba individuals in Ibadan, Nigeria (HAPMAPT03, YRI). Details on the origin of the cell lines can be found at http://www.hapmap.org/citinghapmap.html. Cell lines comprised trios of mother, father and offspring. Cell lines were maintained in RPMI 1640 (Mediatech, Herndon, VA) supplemented with 10% fetal bovine serum (HyClone, Logan, UT) and 1% L-glutamine (Invitrogen, Carlsbad, CA). Cell lines were passaged three times per week at a concentration of 350,000 cells/mL and kept at a temperature of 37°C, with 5% CO2 and 95% humidity.
Drug and nucleotides. Cytosine ß-D-arabinofuranoside (ara-C), GDP, CTP, ATP, UTP, TTP, GTP were purchased from Sigma-Aldrich (St. Louis, MO). Ara-C was prepared in PBS (pH 7.4; Invitrogen) immediately before each experiment.
5
From www.bloodjournal.org at UNIV OF CHICAGO on January 16, 2009. For personal use only.
Cytotoxicity assay. Cell growth inhibition as measured by alamarBlue (Biosource, Camarillo, CA), a colorimetric-based assay 30,31, was used to determine the cytotoxicity of ara-C. Absorbencies following alamarBlue can be used to quantify cell proliferation and viability 30,31. By comparing proliferation in cells exposed to drug relative to that of unexposed cells, a measure of cytotoxicity is obtained. This assay has been shown to compare favorable to the MTT assay 30,32 as a measure of cytotoxicity. The cytotoxicity assay was performed as previously described 33. Ara-C was dissolved in PBS. The percent survival values at each concentration were determined after 72 hours of exposure to 1, 5, 10, 40 and 80 µM drug and plotted against ara-C concentrations to generate a survival curve. The area under the survival curve (AUC) was calculated for each cell line using the trapezoidal rule. All AUC values were log2 transformed before statistical modeling, creating a dependent variable from an approximately normal distribution.
Cell Proliferation, Population and Gender Differences. To examine the effect of the rate of cellular proliferation on susceptibility to ara-C, the proliferation rate was calculated for each untreated cell line at the time of the cytotoxicity experiment for that cell line. Correlation between log2 transformed proliferation rate and log2 transformed AUC was tested, using a general linear regression approach such that trios were analyzed as independent units and the covariance was modeled as previously described 28. This analysis was performed in the combined CEU and YRI cell lines with a population
6
From www.bloodjournal.org at UNIV OF CHICAGO on January 16, 2009. For personal use only.
indicator as a covariate. Additionally the effects of population and gender on cytotoxicity were explored using the linear model framework as described 33.
Association analysis of SNPs within DCK to ara-C cytotoxicity in CEU and YRI samples. As previously reported, 64 SNPs within DCK were identified in the CEU and YRI HapMap samples 15. Genotypes of these SNPs were tested for association with ara-C cytotoxicity. General linear models were constructed with AUC after transforming using log base 2 in each population separately. To begin, the additive effect of each SNP was tested as an independent predictor of AUC. Using SNPs significant in the univariate models at the α = 0.05, multivariable models were reduced using a backwards elimination approach. SNPs included in the final models were statistically significant at the α= 0.05 level. In order to quantify the amount of variation in percent survival or AUC explained by the SNPs, an estimate of r2 was computed using an approach described previously 28.
DCK Western Blot. Anti-rabbit DCK-C-terminal antibody was obtained from Abgent (San Diego, CA). Cells were lysed in RIPA lysis buffer (Santa Cruz Biotechnology, Santa Cruz, CA). Proteins were separated by 12% SDS-PAGE and transferred to polyvinylidene difluoride membrane. The blots were blocked overnight with 5% nonfat dry milk in phosphate-buffered saline, containing 0.05% Tween-20, and they were probed with rabbit anti-human DCK polyclonal C-terminal antibody (Abgent) for 2 h at room temperature, followed by incubation with horseradish peroxidase conjugated antirabbit IgG (Santa Cruz Biotechnology). Immunocomplexes were visualized by an
7
From www.bloodjournal.org at UNIV OF CHICAGO on January 16, 2009. For personal use only.
enhanced chemiluminescence (ECL) kit (GE Healthcare Bio-Sciences Corp, Piscataway, NJ) according to the manufacturer’s protocols.
Association of levels of ara-CTP with DCK SNPs. LCLs were diluted to 0.5x10⁶ cells/mL media 24h prior to treatment with 1mM ara-C for 6 h. At 6 h, 20.5 x 10⁶ cells were pelleted and snap frozen until nucleotide extraction. Levels of ara-CTP were measured by HPLC. See Supplement and Supplement Figure 1 for full details of the HPLC method. Each cell line was treated at least twice in duplicate. With each set of cell treatments, GM18858 was treated to serve as a control. All ara-CTP levels were calculated relative to this cell line on that treatment date. The relative levels of ara-CTP were then analyzed by t-test according to DCK SNP genotypes.
Whole Genome Analysis of Genotype and Cytotoxicity Association. SNP genotypes were downloaded from the International HapMap database (www.HapMap.org) (release 22). SNPs with evidence of Mendelian allele transmission errors and those with a minor allele frequency <5% were filtered out, giving a total of >2 million SNPs for the association analysis in each population. The quantitative transmission disequilibrium test (QTDT) was performed to identify genotype-cytotoxicity associations using QTDT software (www.sph.umich.edu/csg/abecasis/QTDT)34. This was performed separately within each population, with p ≤ 0.0001 considered statistically significant. To account for the possibility of multiple testing errors, the false discovery rate was also calculated.
8
From www.bloodjournal.org at UNIV OF CHICAGO on January 16, 2009. For personal use only.
Analysis of Genotype and Gene Expression Association. Assessment of gene expression in the LCLs was performed using the Affymetrix GeneChip Human Exon 1.0 ST array, as previously described 35. A second QTDT test that integrated the SNPs identified from the genotype-cytotoxicity QTDT analysis and mRNA level gene expression was then performed to identify genotype-gene expression associations as previously described 28, with the exception that genes with average intensity greater than 5.34 (the top 75th%) were included in this association analysis, resulting in 13,314 transcripts analyzed. The p value cutoff for the significant association is 3×10⁻⁶ which is corrected by number of transcript clusters tested. The analysis was performed independently for each population. All raw exon-array data have been deposited into Gene Expression Omnibus (GEO) (accession number GSE7761).
Analysis of Gene Expression and Cytotoxicity. To examine the relationship between gene expression and sensitivity to ara-C, general linear models were constructed as previously described 28 with the log2-transformed percent cell survival values following treatment with 1, 5, 10, 40 and 80µM as well as the AUC as the dependent variables, and the log2transformed gene expression level, together with an indicator for gender, as the independent variables. Genes identified in the genotype-expression QTDT association analysis were included in this analysis. This analysis was performed independently in each population. P < 0.05 was considered statistically significant.
9
From www.bloodjournal.org at UNIV OF CHICAGO on January 16, 2009. For personal use only.
Model to Predict Ara-C Phenotype with Multiple SNPs. To examine the overall genetic variant contribution to variation in sensitivity to ara-C, additional general linear models were constructed using the log2 transformed percent survival or AUC value as the dependent variable. The independent variables included all SNPs that were selected from the two QTDT models and the linear regression of expression on each of the transformed measurements of ara-C induced cytotoxicity in the CEU or YRI population independently. Additive genetic effects were assumed for each SNP. Models were reduced using a backwards elimination approach and an r2 was estimated between percent survival or AUC and the predicted percent survival or AUC as described above.
Independent Validation of Phenotype, Genotypes, and Gene Expression. Cellular sensitivity to ara-C was evaluated in an additional independent set of 49 unrelated CEU cell lines using the same method described earlier. The cell lines included in this analysis are listed in the Supplement. The percent survival at each concentration of ara-C was determined and the AUC was calculated for each cell line. Candidate gene expressions identified from the whole-genome analysis were validated in these 49 LCLs. Quantitative real-time PCR (qRT-PCR) was performed to measure the level of expression of GIT1, SLC25A37 and P2RX1. Exponentially growing cells were diluted at a density of 3.5 x 10⁵ cells/mL per flask. A total of 5 x 10⁶ cells were pelleted and washed in ice-cold PBS and centrifuged to remove PBS. All pellets were flash frozen and stored at -80 °C until RNA isolation. Total RNA was extracted using the RNeasy Mini kit (QIAGEN Inc., Valencia, CA) following the manufacturer's protocol. RNA quality assessment and quantification were conducted using the optical
10
From www.bloodjournal.org at UNIV OF CHICAGO on January 16, 2009. For personal use only.
spectrometry 260/280nm ratio. Subsequently, mRNA was reverse transcribed to cDNA using Applied Biosystems High Capacity Reverse Transcription kit (Applied Biosystems, Foster City, CA). The final concentration of cDNA was 50 ng/uL. qRT-PCR was performed for GIT1, SLC25A37 and P2RX1 and an endogenous control (huB2M, beta-2microglobulin; NM_004048.2) using TaqMan® Gene Expression Assays (Applied Biosystems, Foster City, CA) on the Applied Biosystems 7500 real-time PCR system. Total reaction was carried out in 25 μL volume which consisted of 12.5 μL 2X Taqman Gene Expression PCR master mix, 1.25 μL primers and probe mix (final of 900nM forward and reverse primers and 250 nM of probe) along with 10 μL of 1.25ng/uL cDNA. The GIT1 (Hs01063104_m1), SLC25A37 (Hs00249767_m1) and P2RX1 (Hs00175686_m1) Taqman primers and probes were labeled with the FAM reporter dye and the MGB quencher dye. huB2M primer/probe mixture was labeled with the VIC reporter dye and the MGB quencher dye. The thermocyler parameters were: 50°C for 2 min, 95°C for 10 min, and 40 cycles of 95°C for 15 s / 60°C for 1 min. Each cycle threshold (Ct) value obtained for GIT1, SLC25A37 and P2RX1 was normalized using huB2M independently. A relative standard curve method was used to obtain the relative GIT1, SLC25A37 and P2RX1 expression in our LCL samples (Guide to performing relative qualification of gene expression using real-time quantitative PCR. Docs.appliedbiosystems.com/pebiodocs/04371095.pdf), with the lowest expression set as the calibrator for all other LCLs. Each experiment was conducted a minimum of 2 times and samples were run in triplicate for each experiment. Linear regression was then performed between the log2 transformed AUC and the relative GIT1, SLC25A37 and P2RX1 expressions. p<0.05 was considered statistically significant.
11
From www.bloodjournal.org at UNIV OF CHICAGO on January 16, 2009. For personal use only.
Results Cytotoxicity. Eight-five CEU and 89 YRI cell lines were phenotyped for susceptibility to ara-C. Using the alamarBlue assay, the percent survival of each cell line at 5 different concentrations of ara-C was determined. This data was used to calculate the AUC for each cell line. There was a significant difference in percent survival at each concentration of drug (except 1µM) between CEU and YRI populations (Figure 1A). The mean (standard deviation) log2 AUC was 11.71 (± 0.32 %·μM) in the CEU cell lines compared to 11.47 (± 0.28 %·μM) in the YRI lines (p < 0.0001) (Figure 1B). There was no difference in percent survival or AUC between cell lines derived from females and those from males within either population. Cell Proliferation. The proliferation rate of the CEU and YRI HapMap cell lines was calculated at the time of each cytotoxicity experiment to analyze the effect of the rate of proliferation on susceptibility to ara-C. There was a strong association between the cellular proliferation and susceptibility to ara-C, as measured by AUC, within each population (P<0.0001, see Supplement Figure 2). This is not unexpected given the mechanism of action of ara-C. The population difference in susceptibility to ara-C between the CEU and YRI cell lines was also analyzed using the proliferation rate as a covariate. The difference in log2 AUC between the 2 populations remained significant (P<0.0001). Thus, the population difference in susceptibility is not explained by differences in rates of cellular proliferation of the populations. Analysis of DCK Expression and SNPs. Previous data using qRT-PCR demonstrated a significantly higher level of DCK mRNA in YRI compared to CEU samples 15. We surmised that this could, at least partly, explain population differences
12
From www.bloodjournal.org at UNIV OF CHICAGO on January 16, 2009. For personal use only.
observed in sensitivity to ara-C because higher DCK expression could translate into increased intracellular ara-CTP (the active form of the drug) and therefore increased cellular sensitivity. Expression data using the Affymetrix GeneChip Human Exon 1.0 ST array data also showed higher DCK mRNA levels in YRI compare to CEU (Figure 2A) and higher expression in both populations significantly correlated to cytotoxicity (Supplement Figure 3). In addition, we performed Western Blots to quantify DCK protein levels in LCLs with varying levels of DCK expression (Supplemental Figure 4). There was a strong correlation between the level of DCK mRNA and protein expression, as well as a significant correlation between the level of DCK protein expression and sensitivity to ara-C (Figure 2B). To understand the contribution of DCK SNPs to sensitivity to ara-C, we evaluated 64 SNPs previously identified within DCK 15 for their association with cytotoxicity in the CEU and YRI populations. These SNPs were identified by sequencing 1.5 kilobases of the DCK proximal promoter and all seven coding exons in the CEU and YRI HapMap samples. Nine of these SNPs are present in the HapMap project while the remaining 55 SNPs are novel. Five out of 64 SNPs (-33, 70, 2162, 31942, 36113) were associated with log2 AUC in the YRI samples but only 1 out of 64 (1124) was associated with log2 AUC in the CEU samples. After constructing multivariable models, 1 significant SNP explains 9% of the variation in AUC in the CEU samples and 3 of the 5 significant SNPs explain 20% of the variation in AUC in the YRI samples. To examine the potential functional consequence of SNPs in DCK we treated a subset of 42 YRI LCLs with different genotypes for three DCK SNPs (SNPs 70, 31942, 36116) with 1mM ara-C for 6 hours and then quantified the levels of ara-CTP by HPLC.
13
From www.bloodjournal.org at UNIV OF CHICAGO on January 16, 2009. For personal use only.
LCLs that are heterozygous for SNP 70 demonstrated an increased sensitivity to ara-C in our genotype-AUC analysis (Figure 2C). Not only did these same cell lines demonstrate higher expression of DCK as measured by the exon array, but they also demonstrated significantly higher levels of ara-CTP compared to LCLs that are homozygous (Figure 2C), therefore suggesting that this SNP in DCK affects the function of the protein. Lamba et al. also performed functional studies of 3 nonsynonymous DCK coding SNPs including an assessment of activity of recombinant DCK protein as well as measuring DCK activity in LCLs with these coding SNPs 15. The activity of all 3 recombinant proteins was less than that of the wild type protein. In addition, two of the recombinants demonstrated lower Km and Vmax compared to the wild type. LCLs heterozygous for the coding SNPs demonstrated lower DCK activity compared to wildtype cell lines. These data provide evidence that genetic variation within the DCK gene can affect function of the protein. To assess other genetic variants contributing to phenotypic variation in cytotoxicity, we used an unbiased, whole genome approach taking into consideration HapMap SNPs in the CEU and YRI populations. Whole Genome Association of Genotype and Cytotoxicity. We performed wholegenome analysis comprised of 3 sequential steps within each population as illustrated in Supplement Figure 5. The first step was a QTDT association analysis between over 2 million SNPs from the HapMap project and log2 AUC, as well as percent survival at each drug concentration (Supplement Figure 5A). Since cell survival for each drug concentration is interrelated, we specifically focused on AUC as representing a comprehensive phenotype for overall response to ara-C. The total number of SNPs identified as significantly associated with AUC was 505 in the CEU cell lines and 397 in
14
From www.bloodjournal.org at UNIV OF CHICAGO on January 16, 2009. For personal use only.
the YRI. The 505 significant SNPs in the CEU population were located in or near 74 unique genes while those in the YRI population were in or near 70 genes. A complete list of these SNPs and genes is provided in Supplement Table 1 (CEU) and 2 (YRI). Association of Genotypes with Gene Expression. To specifically identify those associated SNPs that act through effecting gene expression, we performed a second QTDT association analysis between the SNP genotypes identified in step 1 and the level of gene expression from the Affymetrix GeneChip Human Exon 1.0 ST array (Supplement Figure 5B). This was done independently for each population for each drug concentration as well as AUC. The number of transcript clusters (genes) used in this analysis was 13,314. For AUC, 26 of the 505 significant SNPs from the genotypecytotoxicity QTDT analysis in the CEU cell lines were significantly associated with the expression of a total of 12 target genes. Within the YRI population, 33 of the initial 397 significant SNPs were associated with the level of expression of 36 unique genes. These SNPs and target genes are indicated in Supplement Tables 1 and 2. Linear Regression between Gene Expression and Cytotoxicity. The “target genes” identified in the second QTDT association analysis were analyzed for the relationship of expression with ara-C cytotoxicity using linear regression analysis. There were 6 and 24 “target genes” significantly correlated in CEU and YRI, respectively. The final analysis resulted in 11 and 24 SNPs in CEU and YRI, respectively (Supplement Figure 5C, Table 1). Interestingly, there were no SNPs or target genes that overlapped between the two populations. Predicting cytotoxicity with multiple SNPs. By identifying SNPs that both associated with susceptibility to ara-C cytotoxicity and the expression of a gene, and
15
From www.bloodjournal.org at UNIV OF CHICAGO on January 16, 2009. For personal use only.
further focusing on the subset of these SNPs that associated with genes whose expression correlated with ara-C cytotoxicity, a genetic signature for susceptibility to the cytotoxic effects of ara-C was identified. To quantitatively evaluate the contribution of each SNP to this susceptibility, a linear model of cytotoxicity was constructed with multiple SNPs as predictors. In the CEU population 4 SNPs out of the final 11 tested were identified that explained 51% of the variation in ara-C AUC, while in the YRI cell lines 5 SNPs out of 24 tested explained 58% of this variation. The individual SNPs and target genes included in the final model for each population are indicated in Table 1. Population Specific Associations. There was no overlap among either the SNPs or target genes between the two populations for any step of the analysis. We identified two general patterns to explain this population specificity. The first was explained by genetic variation of a given SNP in one population and not the other. For example, in the CEU population SNP rs17808412 was associated with AUC and the expression of the gene GIT1. The CC genotype was associated with a lower AUC and higher expression of GIT1 compared to the CG and GG genotypes (Figure 3A and B). However, in the YRI population all cell lines have the GG genotype for rs17808412 and GIT1 expression levels are consistent with the levels in CEU cell lines harboring the GG genotype (Figure 3A and B). In CEU, this SNP was also associated with cellular sensitivity to 1, 5, and 10
μM ara-C; was associated with the expression of GIT1; and was included in the final multivariable SNP model for each of these phenotypes. This single SNP was shown to contribute to 36%, 34%, 29% and 21% to the variability in cytotoxicity for 1, 5, and 10µM ara-C and AUC, respectively, indicating that this SNP may potentially be useful for predicting susceptibility to ara-C in Caucasians.
16
From www.bloodjournal.org at UNIV OF CHICAGO on January 16, 2009. For personal use only.
We also identified YRI specific genetic variation with the association of SNP rs10973320 with AUC and the expression of RAD51AP1 (Figure 4A and B). Cell lines with the AA genotype had higher AUC and lower RAD51AP1 expression compared to the cell lines with the AT or TT genotypes. All CEU cell lines have the TT genotype (Figure 4A and B). rs10973320 not only associated with AUC in the YRI population but also with percent survival after exposure to 1, 5, 10, 40, and 80 μM ara-C. The lack of genetic variability in one population as an explanation of populationspecific significance of particular SNPs was the case for a small fraction of SNPs (5 of 35). In most instances all 3 genotypes were present; however genotype-phenotype relationships were only found in one population. This is illustrated by SNP rs2775139 which was associated with AUC in the CEU population but not the YRI (Figure 5A). In the CEU population this SNP was further associated with the expression of SLC25A37 (Figure 5B). CEU cell lines having the CC compared to CT and TT genotypes had increased SLC25A37 expression and greater sensitivity to ara-C. While this SNP does demonstrate genetic variability in the YRI cell lines there was no difference in either araC AUC or SLC25A37 expression for the various genotypes (Figure 5A and B). The SNP rs2775139 associated with AUC in the CEU cell lines along with 5, 10, 40 and 80μM, associated with the expression of SLC25A37 in these cell lines, and was included in the final multivariable SNP model of 5 and 80 μM and AUC. For each “target gene” identified from this three-step sequential approach, we examined the correlation between the level of expression and AUC. Among the CEU cell lines, increased expression of both GIT1 and SLC25A37 confer increased sensitivity to ara-C (Figure 3C and D, 5C and D, respectively). In the YRI cell lines, the increased
17
From www.bloodjournal.org at UNIV OF CHICAGO on January 16, 2009. For personal use only.
level of expression of RAD51AP1significantly associated with increased sensitivity to ara-C (P=0.003 ) (Figure 4C). Validation. To validate the gene expression relationships from the whole-genome association, we treated an additional set of 49 unrelated CEPH cell lines with ara-C and evaluated the level of expression by qRT-PCR of a subset of the candidate genes. The mean (± standard deviation) AUC in these cell lines was 11.5 (± 0.4 %·μM). Linear regression analysis of the level of GIT1 and SLC25A37 expression and AUC in the 49 cell lines reproduced the relationship between GIT1 and SLC25A37 expression and sensitivity to ara-C seen in the HapMap cell lines. A higher level of expression of both GIT1 and SLC25A37 expression was associated with decreased AUC and therefore increased sensitivity to ara-C (P = 0.04 and P = 0.05, respectively) (Figures 3D and 5D).
Discussion Clinical trials have indicated an ethnic difference in outcome among patients with AML 25-27. Understanding the contribution of pharmacogenetics to inter-individual and inter-ethnic differences in response to the drugs used to treat AML could help individualize chemotherapy and therefore potentially improve outcomes among individuals with this disease. To characterize the genetic contribution to this variation for ara-C, one of the primary agents used to treat AML, we confirmed and extended a previous analysis of genetic variation within DCK, a candidate gene, and used an unbiased approach that coupled results of an in vitro cytotoxicity assay with whole genome association analyses. We took into account cellular proliferation, evaluated over 2 million genetic variants, and found population-specific genetic determinants. In an
18
From www.bloodjournal.org at UNIV OF CHICAGO on January 16, 2009. For personal use only.
independent set of samples, we validated the correlation between the expression of two novel candidates identified from the whole genome analysis, GIT1and SLC25A37. Cell lines derived from the YRI population were significantly more sensitive to ara-C than the CEU. Further, the candidate approach evaluating DCK and the whole genome analyses identified a unique pharmacogenetic signature for susceptibility to araC in each population. The candidate gene approach identified 1 and 3 SNPs within DCK which contribute 9 and 20% to the variation in AUC in the CEU and YRI populations, respectively. The SNPs evaluated in DCK included 9 HapMap SNPs while the remainder were not in the HapMap, therefore providing a more in depth interrogation of this candidate gene. These SNPs explain some of the variability in ara-C cytotoxicity but not all. We therefore interrogated the entire genome for additional variants. The whole genome approach identified 11 and 24 SNPs acting through gene expression of 6 and 24 genes in CEU and YRI, respectively. There is no overlap in either these SNPs or target genes between the two populations. This can be explained either by a difference in allele frequency in the two populations (5 SNPs) or for most SNPs (n=30) an association in one population but not in the other population. This could be attributed to SNPs in linkage disequilibrium with a causal SNP that associates with ara-C cytotoxicity and is not variable in one of the populations. Another possibility is that these SNPs have differential effects in the two populations. AML patients, all of whom receive ara-C as a significant part of the therapeutic regimen, demonstrate differences in outcome among patients of different races. In a study by the Children’s Oncology Group of pediatric patients with AML treated on 2 consecutive multi-institutional trials, African American patients had significantly worse
19
From www.bloodjournal.org at UNIV OF CHICAGO on January 16, 2009. For personal use only.
survival compared to Caucasians 25. A similar study of patients treated at St. Jude Children’s Research Hospital on 5 consecutive trials did not demonstrate a significant difference in outcome between African American and Caucasian patients overall; however there was a trend to worse outcome in African American patients treated on the most recent trial in which most patients received ara-C based consolidation rather than stem cell transplant 26. Pharmacogenetic differences between patients are one potential explanation for these differences in outcome. Our study may begin to elucidate population specific genetic variants with the caveat that the cell lines we studied are derived from Yoruba individuals residing in Ibadan, Nigeria and therefore the findings may only partially represent the African American population because of admixture in this population 36. Therefore, this important difference may affect whether these variants can be validated in a clinical setting of African Americans. The SNPs and genes identified as the genetic signature for ara-C cytotoxicity in both the CEU and YRI populations are novel and our findings represent a unique set of genetic variables for further study. One interesting finding was with GIT1. GIT1 (G protein-coupled receptor kinase-interacting protein 1) acts as an intracellular scaffolding protein that interacts with numerous intracellular proteins and is involved in diverse processes including agonist-coupled receptor endocytosis and focal adhesion assembly 37. It also acts as a scaffold for certain intracellular signaling cascade proteins, including those in the MAP kinase pathway such as MEK1 and ERK1/2 37-39. Studies have shown that overexpression of GIT1 prolongs stimulation of ERK1/2 by epidermal growth factor and decreased GIT1 expression inhibits this stimulation 38,39. ERK1/2, in turn, has been shown to have proapoptotic effects in response to DNA damaging stimuli including
20
From www.bloodjournal.org at UNIV OF CHICAGO on January 16, 2009. For personal use only.
chemotherapeutic agents 40. It may be possible that increased GIT1 expression leads to increased ERK1/2 activity which then results in increased apoptosis in response to ara-C. A study of gene expression of AML blasts from patients demonstrates that GIT1 is expressed in myeloid tumor cells 41. Other candidate genes identified in our analysis include RAD51AP1 in the YRI population. RAD51AP1 (RAD51-associated protein 1), via interaction with RAD51, is involved in homologous recombination 42,43. Studies have demonstrated increased sensitivity to DNA damage by mitomycin C, camptothecin, cisplatin and ionizing radiation in cells depleted of RAD51AP1 42-44. Our data demonstrated an opposite association, with increased sensitivity to ara-C associated with increased expression of this gene. It may be that this is related to an alternative mechanism of action of RAD51AP1 in response to antimetabolites. SLC25A37 was another gene found in the HapMap samples and validated in a separate set of nonHapMap samples. This gene is a member of the SLC25 solute carrier family. Studies in zebrafish demonstrated that this gene acts to import iron into mitochondria and is involved in heme biosynthesis 45. Interestingly, intracellular iron concentration has been shown to be related to ara-C cytotoxicity. In a study of leukemia cell lines, exposure to desferioxamine and therefore depletion of intracellular iron resulted in increased sensitivity to the ara-C 46. Well-defined prognostic factors of AML outcome exist, one of which is the cytogenetic abnormalities in AML blasts at initial diagnosis 47-49. For example, individuals with t(8;21) and inv(16) karyotypes are recognized as having more favorable outcomes while individuals with del(7) and complex karytotypes are, among others,
21
From www.bloodjournal.org at UNIV OF CHICAGO on January 16, 2009. For personal use only.
noted to be associated with adverse prognosis . However, within each cytogenetic subgroup there is heterogeneity and other biological and treatment factors are also associated with prognosis. The addition of pharmacogenetic variants may help to further define subgroups within each cytogenetic category and therefore further help to prognosticate risk. It may also be the case that the pharmacogenetic variants identified through this genome wide association study and other genomic analyses will be of greater importance in certain cytogenetic subgroups. This and other refinements in the application of pharmacogenetic variants are worthy of further study. By employing an unbiased whole genome approach in LCLs we were able to identify unique genetic signatures for susceptibility to the cytotoxic effects of ara-C in CEU and YRI cell lines. The SNPs and target genes included in these signatures are novel. We plan to perform functional validation studies of a subset of these SNPs and genes in order to provide further support for the results of this analysis, and evaluate these novel candidates in a cohort of patients treated with ara-C to determine their role in patient response and toxicity. Our ultimate goal is to develop a genetic signature that can be applied clinically to identify patients at risk for either increased or decreased susceptibility to ara-C cytotoxicity. This study represents the first step in achieving this goal.
22
From www.bloodjournal.org at UNIV OF CHICAGO on January 16, 2009. For personal use only.
Acknowledgments This Pharmacogenetics of Anticancer Agents Research Group study was supported by National Institutes of Health/National Institute of General Medical Sciences grants GM61393 and data deposits supported by GM61374. C.M.H. was supported by T32 GM007019 from the NIH. The authors are grateful for excellent technical support provided by Steve Wisel in maintaining the cell lines and T. A. Clark, T. X. Chen, A. C. Schweitzer, J. E. Blume (Expression Research, Affymetrix Laboratory, Affymetrix Inc., Santa Clara, CA 94706) for their contribution in generating Exon Array data.
Authorship Contribution: C.M.H. performed cytotoxicity experiments, participated in data interpretation, and wrote the manuscript; S.D. performed genome wide association analyses and edited the manuscript; S.M.D. performed qRT-PCR, HPLC, and edited the manuscript; S.M. performed DCK Western Blots; E.O.K. performed biostatistical analyses, participated in data interpretation, and edited the manuscript; J.K.L performed DCK genotyping and edited the manuscript; R.S.H. participated in data interpretation and edited the manuscript; M.E.D. designed the study, participated in data interpretation, and wrote the manuscript.
Conflict-of-interest disclosure: The authors declare no competing financial interests.
Correspondence: M. Eileen Dolan, 5841 S. Maryland Ave. Box MC2115, University of Chicago, Chicago, IL 60637. Phone: (773) 702-4441; Fax: (773) 702-0963; E-mail:
[email protected]
23
From www.bloodjournal.org at UNIV OF CHICAGO on January 16, 2009. For personal use only.
References 1. Woods WG. Curing childhood acute myeloid leukemia (AML) at the half-way point: promises to keep and miles to go before we sleep. Pediatr Blood Cancer. 2006;46:565-569. 2. Arceci RJ. Progress and controversies in the treatment of pediatric acute myelogenous leukemia. Curr Opin Hematol. 2002;9:353-360. 3. Tallman MS, Gilliland DG, Rowe JM. Drug therapy for acute myeloid leukemia. Blood. 2005;106:1154-1163. 4. Lange BJ, Smith FO, Feusner J, et al. Outcomes in CCG-2961, a children's oncology group phase 3 trial for untreated pediatric acute myeloid leukemia: a report from the children's oncology group. Blood. 2008;111:1044-1053. 5. Moore JO, George SL, Dodge RK, et al. Sequential multiagent chemotherapy is not superior to high-dose cytarabine alone as postremission intensification therapy for acute myeloid leukemia in adults under 60 years of age: Cancer and Leukemia Group B Study 9222. Blood. 2005;105:3420-3427. 6. Galmarini CM, Thomas X, Calvo F, et al. In vivo mechanisms of resistance to cytarabine in acute myeloid leukaemia. Br J Haematol. 2002;117:860-868. 7. Fernandez-Calotti P, Jordheim LP, Giordano M, Dumontet C, Galmarini CM. Substrate cycles and drug resistance to 1-beta-D-arabinofuranosylcytosine (araC). Leuk Lymphoma. 2005;46:335-346. 8. Galmarini CM, Thomas X, Calvo F, et al. Potential mechanisms of resistance to cytarabine in AML patients. Leuk Res. 2002;26:621-629. 9. Cros E, Jordheim L, Dumontet C, Galmarini CM. Problems related to resistance to cytarabine in acute myeloid leukemia. Leuk Lymphoma. 2004;45:1123-1132. 10. Styczynski J. Drug resistance in childhood acute myeloid leukemia. Curr Pharm Biotechnol. 2007;8:59-75. 11. Cole N, Gibson BE. High-dose cytosine arabinoside in the treatment of acute myeloid leukaemia. Blood Rev. 1997;11:39-45. 12. Reykdal S, Sham R, Kouides P. Cytarabine-induced pericarditis: a case report and review of the literature of the cardio-pulmonary complications of cytarabine therapy. Leuk Res. 1995;19:141-144. 13. Baker WJ, Royer GL, Jr., Weiss RB. Cytarabine and neurologic toxicity. J Clin Oncol. 1991;9:679-693. 14. Briasoulis E, Pavlidis N. Noncardiogenic pulmonary edema: an unusual and serious complication of anticancer therapy. Oncologist. 2001;6:153-161. 15. Lamba JK, Crews K, Pounds S, et al. Pharmacogenetics of deoxycytidine kinase: identification and characterization of novel genetic variants. J Pharmacol Exp Ther. 2007;323:935-945. 16. Flasshove M, Strumberg D, Ayscue L, et al. Structural analysis of the deoxycytidine kinase gene in patients with acute myeloid leukemia and resistance to cytosine arabinoside. Leukemia. 1994;8:780-785. 17. Owens JK, Shewach DS, Ullman B, Mitchell BS. Resistance to 1-beta-Darabinofuranosylcytosine in human T-lymphoblasts mediated by mutations within the deoxycytidine kinase gene. Cancer Res. 1992;52:2389-2393.
24
From www.bloodjournal.org at UNIV OF CHICAGO on January 16, 2009. For personal use only.
18. Veuger MJ, Honders MW, Landegent JE, Willemze R, Barge RM. High incidence of alternatively spliced forms of deoxycytidine kinase in patients with resistant acute myeloid leukemia. Blood. 2000;96:1517-1524. 19. Galmarini CM, Thomas X, Graham K, et al. Deoxycytidine kinase and cN-II nucleotidase expression in blast cells predict survival in acute myeloid leukaemia patients treated with cytarabine. Br J Haematol. 2003;122:53-60. 20. Fitzgerald SM, Goyal RK, Osborne WR, Roy JD, Wilson JW, Ferrell RE. Identification of functional single nucleotide polymorphism haplotypes in the cytidine deaminase promoter. Hum Genet. 2006;119:276-283. 21. Hubeek I, Stam RW, Peters GJ, et al. The human equilibrative nucleoside transporter 1 mediates in vitro cytarabine sensitivity in childhood acute myeloid leukaemia. Br J Cancer. 2005;93:1388-1394. 22. Galmarini CM, Graham K, Thomas X, et al. Expression of high Km 5'nucleotidase in leukemic blasts is an independent prognostic factor in adults with acute myeloid leukemia. Blood. 2001;98:1922-1926. 23. Guedez L, Suresh A, Tung F, Zucali J. Quantitation of resistance to cytosine arabinoside by myeloid leukemic cells expressing bcl-2. Eur J Haematol. 1996;57:149156. 24. Gilbert JA, Salavaggione OE, Ji Y, et al. Gemcitabine pharmacogenomics: cytidine deaminase and deoxycytidylate deaminase gene resequencing and functional genomics. Clin Cancer Res. 2006;12:1794-1803. 25. Aplenc R, Alonzo TA, Gerbing RB, et al. Ethnicity and survival in childhood acute myeloid leukemia: a report from the Children's Oncology Group. Blood. 2006;108:74-80. 26. Rubnitz JE, Lensing S, Razzouk BI, Pounds S, Pui CH, Ribeiro RC. Effect of race on outcome of white and black children with acute myeloid leukemia: the St. Jude experience. Pediatr Blood Cancer. 2007;48:10-15. 27. Sekeres MA, Peterson B, Dodge RK, et al. Differences in prognostic factors and outcomes in African Americans and whites with acute myeloid leukemia. Blood. 2004;103:4036-4042. 28. Huang RS, Duan S, Shukla SJ, et al. Identification of genetic variants contributing to cisplatin-induced cytotoxicity by use of a genomewide approach. Am J Hum Genet. 2007;81:427-437. 29. Huang RS, Duan S, Bleibel WK, et al. A genome-wide approach to identify genetic variants that contribute to etoposide-induced cytotoxicity. Proc Natl Acad Sci U S A. 2007;104:9758-9763. 30. Beverly A. Teicher PAA ed Anticancer drug development duide: preclinical screening, clinical trials, and approval. Cancer drug discovery and development (ed 2nd). Totowa, N.J.: Humana Press; 2004. 31. Ahmed SA, Gogal RM, Jr., Walsh JE. A new rapid and simple non-radioactive assay to monitor and determine the proliferation of lymphocytes: an alternative to [3H]thymidine incorporation assay. J Immunol Methods. 1994;170:211-224. 32. Hamid R, Rotshteyn Y, Rabadi L, Parikh R, Bullock P. Comparison of alamar blue and MTT assays for high through-put screening. Toxicol In Vitro. 2004;18:703-710.
25
From www.bloodjournal.org at UNIV OF CHICAGO on January 16, 2009. For personal use only.
33. Huang RS, Kistner EO, Bleibel WK, Shukla SJ, Dolan ME. Effect of population and gender on chemotherapeutic agent-induced cytotoxicity. Mol Cancer Ther. 2007;6:31-36. 34. Abecasis GR, Cardon LR, Cookson WO. A general test of association for quantitative traits in nuclear families. Am J Hum Genet. 2000;66:279-292. 35. Zhang W, Duan S, Kistner EO, et al. Evaluation of genetic variation contributing to differences in gene expression between populations. Am J Hum Genet. 2008;82:631640. 36. Suarez-Kurtz G. Pharmacogenomics in admixed populations. Trends Pharmacol Sci. 2005;26:196-201. 37. Hoefen RJ, Berk BC. The multifunctional GIT family of proteins. J Cell Sci. 2006;119:1469-1475. 38. Yin G, Zheng Q, Yan C, Berk BC. GIT1 is a scaffold for ERK1/2 activation in focal adhesions. J Biol Chem. 2005;280:27705-27712. 39. Yin G, Haendeler J, Yan C, Berk BC. GIT1 functions as a scaffold for MEK1extracellular signal-regulated kinase 1 and 2 activation by angiotensin II and epidermal growth factor. Mol Cell Biol. 2004;24:875-885. 40. Lu Z, Xu S. ERK1/2 MAP kinases in cell survival and apoptosis. IUBMB Life. 2006;58:621-631. 41. Ross ME, Mahfouz R, Onciu M, et al. Gene expression profiling of pediatric acute myelogenous leukemia. Blood. 2004;104:3679-3687. 42. Modesti M, Budzowska M, Baldeyron C, Demmers JA, Ghirlando R, Kanaar R. RAD51AP1 is a structure-specific DNA binding protein that stimulates joint molecule formation during RAD51-mediated homologous recombination. Mol Cell. 2007;28:468481. 43. Wiese C, Dray E, Groesser T, et al. Promotion of homologous recombination and genomic stability by RAD51AP1 via RAD51 recombinase enhancement. Mol Cell. 2007;28:482-490. 44. Henson SE, Tsai SC, Malone CS, et al. Pir51, a Rad51-interacting protein with high expression in aggressive lymphoma, controls mitomycin C sensitivity and prevents chromosomal breaks. Mutat Res. 2006;601:113-124. 45. Shaw GC, Cope JJ, Li L, et al. Mitoferrin is essential for erythroid iron assimilation. Nature. 2006;440:96-100. 46. Leardi A, Caraglia M, Selleri C, et al. Desferioxamine increases iron depletion and apoptosis induced by ara-C of human myeloid leukaemic cells. Br J Haematol. 1998;102:746-752. 47. Grimwade D, Walker H, Oliver F, et al. The importance of diagnostic cytogenetics on outcome in AML: analysis of 1,612 patients entered into the MRC AML 10 trial. The Medical Research Council Adult and Children's Leukaemia Working Parties. Blood. 1998;92:2322-2333. 48. Byrd JC, Mrozek K, Dodge RK, et al. Pretreatment cytogenetic abnormalities are predictive of induction success, cumulative incidence of relapse, and overall survival in adult patients with de novo acute myeloid leukemia: results from Cancer and Leukemia Group B (CALGB 8461). Blood. 2002;100:4325-4336. 49. Mrozek K, Heerema NA, Bloomfield CD. Cytogenetics in acute leukemia. Blood Rev. 2004;18:115-136.
26
From www.bloodjournal.org at UNIV OF CHICAGO on January 16, 2009. For personal use only.
Table 1. SNPs and target genes comprising the genetic signature for susceptibility to ara-C from the whole genome analysis for AUC in both CEU and YRI populations. SNPs listed in bold are included in the final multivariate model.
CEU
YRI
SNP rs17763463 rs7600852 rs17808412 rs13358399 rs2775139 rs2775134 rs1332944 rs2585498 rs2585499 rs17795186 rs17763463 rs7600852 rs368182 rs938562 rs16836417 rs16836421 rs16836403 rs11799391 rs4742299 rs4742299 rs11677428 rs11677428 rs10973320 rs10906723 rs10906723 rs12225692 rs16919696 rs2430853 rs4634268 rs10906723 rs10461692 rs11957363 rs17667845 rs17604706 rs1392421 rs6591904 rs12712001 rs12712001 rs12712001
Chromsome 2 2 3 5 13 13 13 13 13 11 2 2 16 4 1 1 1 1 9 9 2 2 9 10 10 11 8 18 4 10 5 5 5 5 5 11 2 2 2
pQTL pvalue 0.00005 0.00005 0.00001 0.0001 0.000008 0.00002 0.00002 0.00002 0.00001 0.0001 0.00005 0.00005 0.0001 0.0001 0.0001 0.0001 0.0001 0.0001 0.00009 0.00009 0.00001 0.00001 0.00002 0.0001 0.0001 0.00009 0.00005 0.00001 0.0001 0.0001 0.00008 0.0001 0.0001 0.0001 0.0001 0.0001 0.0001 0.0001 0.0001
eQTL pvalue 0.0000001 0.0000001 0.000001 0.000004 0.000001 0.000002 0.000002 0.000002 0.000003 0.000002 0.000001 0.000001 0.000003 0.000003 0.000001 0.000001 0.000001 0.000001 0.0000002 0.0000002 0.0000008 0.0000008 0.00000004 0.000002 0.000002 0.000002 0.0000006 0.0000004 0.000001 0.000002 0.000001 0.0000007 0.0000007 0.0000007 0.0000007 0.0000004 0.000003 0.000003 0.000003
eQTL Target gene GIT1 GIT1 GIT1 C3orf6 SLC25A37 SLC25A37 SLC25A37 SLC25A37 SLC25A37 P2RX1 PTPRS PTPRS CCDC24 RPS6KA2 BMP3 BMP3 BMP3 BMP3 DNAJB1 MIST LOC731990 SDC3 RAD51AP1 SSH2 LOC399491 NAB2 CLDN16 ANPEP ANPEP FAM78A FAM129A FAM129A FAM129A FAM129A FAM129A BLVRB ALK LOC730467 LOC729342
Target gene chromosome 17 17 17 8 8 8 8 8 17 19 19 1 6 4 4 4 4 19 19 1 1 12 17 17 12 3 15 15 9 1 1 1 1 1 19 10 10 10
Target gene ID 28964 28964 28964 152137 51312 51312 51312 51312 51312 5023 5802 5802 149473 6196 651 651 651 651 3337 116449 731990 9672 10635 85464 399491 4665 10686 290 290 286336 116496 116496 116496 116496 116496 645 238 730467 729342
ExpressionAUC pvalue 0.00007 0.00007 0.00007 0.00008 0.00069 0.00069 0.00069 0.00069 0.00069 0.00399 0.01020 0.01020 0.04264 0.00002 0.00052 0.00052 0.00052 0.00052 0.00074 0.00074 0.00123 0.00123 0.00295 0.00549 0.00549 0.00743 0.00846 0.01701 0.01701 0.01739 0.01888 0.01888 0.01888 0.01888 0.01888 0.02231 0.02342 0.02342 0.02342
27
From www.bloodjournal.org at UNIV OF CHICAGO on January 16, 2009. For personal use only.
rs12712001 rs12712001 rs12712001 rs1839049 rs9942049 rs10181725 rs10193059
2 2 2 3 3 2 2
0.0001 0.0001 0.0001 0.00002 0.0001 0.00004 0.00003
0.000003 0.000003 0.000003 0.000002 0.000001 0.000002 0.000003
BLNK NPM1 LOC399804 TMEM123 SPATA18 SOD3 SOD3
10 10 10 11 4 4 4
29760 4869 399804 114908 132671 6649 6649
0.02342 0.02342 0.02342 0.02876 0.03342 0.04697 0.04697
28
From www.bloodjournal.org at UNIV OF CHICAGO on January 16, 2009. For personal use only.
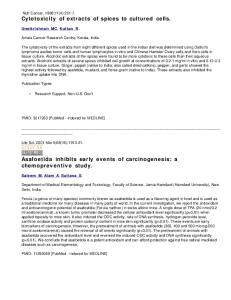
Figure Legends Figure 1. Cytotoxicity of ara-C in CEU and YRI populations. (A) The mean percent survival in the CEU compared to the YRI cell lines was 73.3 vs. 70.5 at 1uM (p = 0.24), 53.3 vs. 47.3 at 5μM (p = .0018), 46.8 vs. 39.9 at 10μM (p = 0.0001), 40.3 vs. 32.8 at 40μM (p < 0.0001) and 37.3 vs. 30.4 (p < 0.0001) at 80μM ara-C. (B) The distribution of log2 AUC in CEU and YRI cell lines (P<0.0001).
Figure 2. Analysis of DCK expression. (A) Distribution of DCK mRNA expression measured on the Affymetrix GeneChip Human Exon 1.0 ST array in the CEU and YRI cell lines (P=0.02). (B) Association between level of DCK protein expression and log2 AUC in a subset of YRI cell lines (r2 = 0.69, P = 0.04). (C) Association between DCK SNP genotype and log2 AUC (P = 0.02), DCK expression levels (P = 0.003), and intracellular ara-CTP (P = 0.003).
Figure 3. SNP rs17808412 and GIT1. In the CEU population rs17808412 demonstrated a significant association between SNP genotype and both (A) ara-C AUC (P=0.00001) and (B) the level of expression of GIT1 (P=0.000001). (A-B) In the YRI population this SNP is not variable, with all cell lines having the (GG) genotype. (C) Expression of GIT1 and AUC were significantly correlated in the CEU population (r2 = 0.200, P=0.00007). (D) This association was validated in an independent set of CEU cell lines.
Figure 4. rs10973320 and RAD51AP1. rs10973320 demonstrated genetic variability in the YRI population as well as an association between genotype and both (A) AUC
29
From www.bloodjournal.org at UNIV OF CHICAGO on January 16, 2009. For personal use only.
(P=0.00002) and (B) expression of RAD51AP1 (P=0.00000004). (A-B) This SNP is not variable in the CEU population. (C) Expression of RAD51AP1 and AUC were significantly correlated in the YRI population.
Figure 5. rs2775139 and SLC25A37. rs2775139 is variable in both CEU and YRI cell lines. In the CEU cell lines, genotype is associated with both (A) AUC (P=0.000008) and (B) expression of SLC25A37 (P=0.000001). Among the YRI cell lines all genotypes demonstrate similar (A) AUC and (B) SLC25A37 expression. (C) Expression of SLC25A37 and AUC were significantly correlated in the CEU population (r2 = 0.169, P=0.0007). (D) This association was validated in an independent set of CEU cell lines in which AUC significantly correlated with expression of SLC25A37 (r2 = 0.0817, P=0.05).
30
Figure 1
From www.bloodjournal.org at UNIV OF CHICAGO on January 16, 2009. For personal use only.
B A
Figure 2
From www.bloodjournal.org at UNIV OF CHICAGO on January 16, 2009. For personal use only.
B
C A
Figure 3
C
From www.bloodjournal.org at UNIV OF CHICAGO on January 16, 2009. For personal use only.
D B
YRI CEU A
Figure 4
C
From www.bloodjournal.org at UNIV OF CHICAGO on January 16, 2009. For personal use only.
B
YRI CEU A
From www.bloodjournal.org at UNIV OF CHICAGO on January 16, 2009. For personal use only.
D B
YRI CEU A
C Figure 5