Asia Pacific Equity Research 05 August 2013
Dairy Farm International Holdings Limited Competition in Malaysia leads to margin erosion
Neutral DAIR.SI, DFI SP Price: $11.22
▼ Price Target: $9.00 Previous: $10.00
Dairy Farm 1H13 earnings were weaker than expected with earnings -5% y/y and sales +7% y/y. At the analyst meeting today management noted that earnings decline was mainly driven by the weakness in Singapore and Malaysia food margins as competition was severe. We are revising our FY13 earnings estimates by 18% and this points to another 3% y/y earnings decline in 2H12 as we do not expect any major improvement in 2H. We maintain our Neutral rating with a PT of US$9 based on 1.5x PEG which is at slight premium to the regional average given management's track record and scarcity factor. Food business. Food business sales were on track but margins disappointed. Premium brands continue to do well in most markets. Mass market performance was patchy - poor in MYH and SG (due to competition and higher costs of doing business), but solid in HK. Company intends to continue to grow mass market presence in ID alongside “premium” Hero brands. Performance of convenience stores was satisfactory in HK and CH but under pressure in SG (seen some improvement in 2H13 YTD). As 2H13 focus is to maintain sales momentum, the company will seek to remain price competitive as consumers are more resistant to pricing. Given that cost pressures remain significant, the company will likely continue to face margin compression in the near term. MYH operations. MYH operations (1H13 sales flat yoy) have suffered from intense competition from both local and foreign peers. The company is implementing a turnaround plan: 1) improved product range to drive retail sales; 2) upgrading stores and malls format; 3) investing in store labor. The company is seeing a pick up in sales after just a few months, but expects the pressure on margins to continue in 2H13. Management however emphasized a sustained commitment in MYH to rebuild Giant’s market position. Health and Beauty business. LFL sales were positive across all countries, on the back of higher customer count. HK in particular was very strong. China operations were improving (loss narrowed though loss remains at the storelevel) but remain a small business for the group. Margin compression however kicked in as competition increased – to persist in 2H13. The company remains under-represented in Skincare, and was seeking to expand the range of products under offer to drive up average unit volume and decrease unit variable costs. Dairy Farm International Holdings Limited (Reuters: DAIR.SI, Bloomberg: DFI SP) $ in mn, year-end Dec FY11A FY12A FY13E FY14E FY15E Revenue ($ mn) 9,134 9,801 10,508 11,635 12,887 Net Profit ($ mn) 484 450 487 553 627 EPS ($) 0.36 0.33 0.36 0.41 0.46 Recurring EPS ($) 0.33 0.37 0.36 0.41 0.46 DPS ($) 0.21 0.23 0.23 0.25 0.28 Revenue growth (%) 14.6% 7.3% 7.2% 10.7% 10.8% Net Profit growth (%) 17.7% (7.0%) 8.2% 13.5% 13.4% Recurring profit growth 9.3% 12.5% (3.7%) 13.5% 13.4% EPS growth (%) 17.6% (7.1%) 8.1% 13.5% 13.4% ROE 54.3% 47.9% 38.0% 37.1% 35.7% ROA 13.2% 13.7% 12.1% 12.4% 12.6% P/E (x) 31.3 33.7 31.2 27.5 24.2 P/BV (x) 16.4 12.7 11.1 9.4 8.0 EV/EBITDA (x) 20.2 21.2 19.2 16.7 14.9 Dividend Yield 1.9% 2.1% 2.1% 2.2% 2.5%
Singapore Consumer Ebru Sener Kurumlu
AC
(852) 2800-8521
[email protected] Bloomberg JPMA KURUMLU
Shen Li, CFA (852) 2800 8523 [email protected]
Henry Tan (852) 2800-8559 [email protected] J.P. Morgan Securities (Asia Pacific) Limited Price Performance 14.0 13.0 $ 12.0 11.0 10.0 Aug-12
Nov-12
Feb-13
May-13
Aug-13
DAIR.SI share price ($) FTSTI (rebased)
Abs Rel
YTD 2.5% 1.2%
1m -6.6% -8.9%
Company Data Shares O/S (mn) Market Cap ($ mn) Market Cap ($ mn) Price ($) Date Of Price Free Float(%) 3M - Avg daily volume (mn) 3M - Avg daily value ($ mn) 3M - Avg daily value ($ mn) FTSTI Exchange Rate Fiscal Year End
3m -8.6% -4.8%
12m 7.0% 1.5%
1,350 15,147 15,147 11.22 05 Aug 13 22.1% 0.13 1.58 1.6 3241.79 1.00 Dec
Source: Company data, Bloomberg, J.P. Morgan estimates.
See page 6 for analyst certification and important disclosures, including non-US analyst disclosures. J.P. Morgan does and seeks to do business with companies covered in its research reports. As a result, investors should be aware that the firm may have a conflict of interest that could affect the objectivity of this report. Investors should consider this report as only a single factor in making their investment decision. www.jpmorganmarkets.com
Asia Pacific Equity Research 05 August 2013
Ebru Sener Kurumlu (852) 2800-8521 [email protected]
Company Description
P&L sensitivity metrics for FY13
Dairy Farm operates 5,677 retail outlets (supermarkets, hypermarkets, health and beauty stores, convenience stores, home furnishings stores and restaurants) in Hong Kong, Taiwan, China, Singapore, Malaysia, Indonesia and India. Its retail names include Wellcome, Cold Storage, Giant, Health & Glow, Woolworths, Hero, Guardian and 7-Eleven. The Group has a 50% interest in Maxim’s, Hong Kong’s leading catering chain. It employs over 90,000 people.
Food Sales
EBITDA impact (%)
EPS impact (%)
1.7%
2.1%
1.3%
1.7%
0.3%
0.3%
5.5%
6.9%
1.6%
1.9%
0.3%
0.4%
Impact of each 5 percentage points increase Health and Beauty Sales Impact of each 5 percentage points increase Home Furnishing Sales Impact of each 5 percentage points increase Food Operating margin assumption Impact of each 50bps increase Health and Beauty Operating margin assumption Impact of each 50bps increase Home Furnishing Operating margin assumption Impact of each 50bps increase Source: J.P. Morgan estimates.
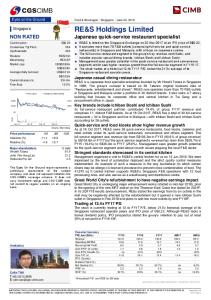
2012 Revenue Breakdown
Price target and valuation analysis
Our new Dec-14 target price is US$9 (previously US$10). Our target price is based on 1.5x PEG with 2-year (2014-16) EPS CAGR of c14%. The decrease in PT is mainly driven by the earnings revision (-20%). At the same time we have increased the PEG ratio to 1.5x from 1.2x (which is slightly above regional peers). Due to its scarcity factor (the only company which provides exposure to Asia retail space across the board) Dairy Farm typically trades at a premium to other regional retailers which focus on single countries.
East Asia 29% North Asia 51%
South Asia 20% Source: Company
EPS J.P. Morgan vs consensus US$ FY13E
J.P. Morgan 0.36
Consensus 0.40
FY14E
0.41
0.45
FY15E
0.46
0.51
Downside risks include a sudden slowdown in store expansion and higher than expected costs in HK. Upside risks include stronger SSS growth on benign food inflation and higher currency benefits.
Source: Bloomberg, JPMorgan estimates
Peer comparison valuations Company Supermarkets: Dairy Farm Beijing Jingkelong^ Lianhua^ Wumart Stores^ Sun Art^ Yonghui Supers-A^ Sector average
Ticker DFI SP 814 HK 980 HK 1025 HK 6808 HK 601933 CH
Rating N NC NC NC NC NC
PT (LC)
Price (LC)
Mkt Cap (USD mn)
9 NC NC NC NC NC
11.2 NC NC NC NC NC
15,170 145 572 2,451 13,553 2,992
2012 30.0 8.6 10.4 24.9 34.8 36.7 24.2
P/E 2013E
2014E
P/B 2013E 2014E
25.5 7.2 10.3 21.8 29.6 26.2 20.1
21.8 6.3 7.5 19.0 25.4 20.1 16.7
10.3 0.5 1.0 3.8 4.5 3.6 3.9
Source: Bloomberg, J.P. Morgan estimates Share prices are as of close of August 05, 2013; ^Stock not under J.P. Morgan coverage, Bloomberg consensus used.
2
8.3 0.5 0.9 3.4 4.0 3.1 3.4
Ebru Sener Kurumlu (852) 2800-8521 [email protected]
Asia Pacific Equity Research 05 August 2013
Table 1: Earnings revisions Year to Dec (US$mn) Sales Cost of sales Gross Profit Gross Margin (%) Total operating expenses As % of sales Operating Profit Operating margin Profit before tax Tax Tax Rate Profit after tax Loss attributable to Minority Interests Profit attributable to shareholders
2013E 11,015 -7,834
Old 2014E 12,142 -8,636
2015E 13347 -9,493
2013E 10,508 -7,474
New 2014E 11,635 -8,276
2015E 12,887 -9,165
2013E -4.6% -4.6%
% chg yoy 2014E -4.2% -4.2%
2015E -3.4% -3.4%
3,181 28.9%
3,506 28.9%
3854 28.9%
3,034 28.9%
3,360 28.9%
3,721 28.9%
-4.6%
-4.2%
-3.4%
-2,526 -22.9%
-2,731 -22.5%
-2,919 -21.9%
-2,502 -23.8%
-2,753 -23.7%
-3,028 -23.5%
-0.9%
0.8%
3.8%
655 5.9%
775 6.4%
935 7.0%
532 5.1%
607 5.2%
693 5.4%
-18.8%
-21.7%
-25.9%
715 -121 -17.0%
838 -142 -17.0%
1002 -170 -17.0%
592 -101 -17.0%
670 -114 -17.0%
759 -129 -17.0%
-17.2% -16.9%
-20.1% -19.8%
-24.2% -24.1%
595 1 594
698 1 697
834
491 -4 487
556 -3 553
630 -3 627
-17.5%
-20.3%
-24.4%
-18.0%
-20.7%
-24.8%
834
Source: J.P. Morgan estimates
3
Asia Pacific Equity Research 05 August 2013
Ebru Sener Kurumlu (852) 2800-8521 [email protected]
Dairy Farm International Holdings Limited: Summary of Financials Income Statement $ in millions, year end Dec Revenues % change Y/Y Gross Profit % change Y/Y Gross margin Other operating income EBITDA % change Y/Y EBITDA Margin EBIT % change Y/Y EBIT Margin Net Interest Share of JVs Other non operating income Earnings before tax % change Y/Y Tax as % of EBT Minorities Net income (reported) % change Y/Y Recurring Net Income % change Y/Y EPS (reported) % change Y/Y Recurring EPS % change Y/Y Balance sheet $ in millions, year end Dec Cash and cash equivalents Accounts receivable Inventories Others Current assets Goodwill Intangible assets Long term investments Net fixed assets Other assets Total Assets
FY11 9,134 14.6% 2,683 12.9% 29.4% 133 717 11.3% 7.8% 535 14.1% 5.9% (18) 66 0 584 18.2% (99) 17.0% (0) 484 17.7% 450 9.3% 0.36 17.6% 0.33 9.2%
FY12 9,801 7.3% 2,830 5.5% 28.9% 148 676 (5.7%) 6.9% 484 (9.5%) 4.9% (11) 64 0 537 (8.1%) (83) 15.5% (3) 450 (7.0%) 506 12.5% 0.33 (7.1%) 0.37 12.5%
FY13E 10,508 7.2% 3,034 7.2% 28.9% 0 730 8.1% 6.9% 532 9.9% 5.1% (7) 67 0 592 10.3% (101) 17.0% (4) 487 8.2% 487 (3.7%) 0.36 8.1% 0.36 (3.8%)
FY14E 11,635 10.7% 3,360 10.7% 28.9% 0 810 10.9% 7.0% 607 14.1% 5.2% (7) 70 0 670 13.2% (114) 17.0% (3) 553 13.5% 553 13.5% 0.41 13.5% 0.41 13.5%
FY15E 12,887 10.8% 3,721 10.8% 28.9% 0 872 7.7% 6.8% 693 14.2% 5.4% (7) 74 0 759 13.3% (129) 17.0% (3) 627 13.4% 627 13.4% 0.46 13.4% 0.46 13.4%
Cash flow statement $ in millions, year end Dec PBT Depr. & amortization Change in working capital Tax & Other Cash flow from operations
FY11 584 181 72 (16) 730
FY12 537 191 33 (61) 698
FY13E 592 198 81 4 770
FY14E 670 203 129 3 888
FY15E 759 179 143 3 952
Capex Sale of assets Acquisition of subsidiaries/intangibles Other Cash flow from investing
(214) 1 (29) (242)
(290) 6 (213) (496)
(118) 0 0 (118)
(90) 0 0 (90)
(90) 0 0 (90)
Equity raised/(repaid) Debt raised/(repaid) Dividends paid Other Cash flow from financing
2 (199) (257) 7 (447)
0 26 (290) 3 (262)
0 0 (311) (4) (315)
0 0 (311) (3) (314)
0 0 (332) (3) (335)
(3) 39 730 0.21
6 (54) 665 0.23
0 338 1,003 0.23
0 484 1,487 0.25
0 528 2,014 0.28
FY11 29.4% 7.8% 5.9% 4.9% 4.9% 14.6% 17.7% 9.3% 17.6%
FY12 28.9% 6.9% 4.9% 5.2% 5.2% 7.3% (7.0%) 12.5% (7.1%)
FY13E 28.9% 6.9% 5.1% 4.6% 4.6% 7.2% 8.2% (3.7%) 8.1%
FY14E 28.9% 7.0% 5.2% 4.8% 4.8% 10.7% 13.5% 13.5% 13.5%
FY15E 28.9% 6.8% 5.4% 4.9% 4.9% 10.8% 13.4% 13.4% 13.4%
FX gain/(loss) Net change in cash Ending cash DPS
Ratio Analysis FY11 FY12 FY13E FY14E FY15E $ in millions, year end Dec 730 667 1,005 1,489 2,017 Gross margin 218 196 210 232 257 EBITDA margin 949 958 1,028 1,138 1,260 Operating Margin 48 19 19 19 19 Net margin 1,945 1,840 2,261 2,878 3,553 Recurring net profit margin 352 440 440 440 440 Sales growth - Net profit growth - Recurring net profit growth 896 1,070 989 877 787 EPS growth 152 163 163 163 163 3,539 3,851 4,192 4,696 5,282 Interest coverage (x) Net debt to equity Liabilities Sales/assets Short-term loans 130 56 56 56 56 Assets/equity Trade & other payables 2,140 2,276 2,440 2,702 2,992 ROE Others 87 60 60 60 60 ROCE Total current liabilities 2,357 2,391 2,555 2,817 3,107 Long-term debt 133 91 91 91 91 Others 118 130 130 130 130 Total Liabilities 2,609 2,612 2,776 3,038 3,328 Minorities 8 46 46 46 46 Shareholders' equity 923 1,193 1,369 1,612 1,907 BVPS 0.68 0.88 1.01 1.19 1.41 Source: Company reports and J.P. Morgan estimates.
4
41.0 59.8 104.4 115.7 124.6 (50.1%) (42.0%) (60.7%) (81.0%) (95.8%) 2.7 2.7 2.6 2.6 2.6 410.5% 349.3% 313.9% 298.1% 283.5% 54.3% 47.9% 38.0% 37.1% 35.7% 36.9% 33.0% 30.9% 30.8% 30.2%
Asia Pacific Equity Research 05 August 2013
Ebru Sener Kurumlu (852) 2800-8521 [email protected]
JPM Q-Profile Dairy Farm International Holdings Ltd. (HONG KONG / Consumer Staples) As Of: 02-Aug-2013
[email protected]
Local Share Price
Current:
11.90
12 Mth Forward EPS
14.00
0.60
12.00
0.50
10.00
0.40
Current:
0.44
0.30
8.00
0.20
6.00
0.10
4.00
0.00
2.00
-0.10
Earnings Yield (& local bond Yield) 16%
12Mth fwd EY
4%
Implied Value Of Growth*
Current:
Jan/13
Aug/13
Jun/12
Apr/11
Nov/11
Sep/10
Jul/09
Feb/10
Dec/08
Oct/07
May/08
Mar/07
Jan/06
Aug/06
Jun/05
Apr/04
Nov/04
Sep/03
Jul/02
Feb/03
Dec/01
Oct/00
May/01
Mar/00
Jan/99
Aug/99
-0.20 Jun/98
Jan/13
Current:
Hong Kong BY
Aug/13
Jun/12
Apr/11
Nov/11
Sep/10
Jul/09
Feb/10
Dec/08
Oct/07
May/08
Mar/07
Jan/06
Aug/06
Jun/05
Apr/04
Nov/04
Sep/03
Jul/02
Feb/03
Dec/01
Oct/00
May/01
Mar/00
Jan/99
Aug/99
Jun/98
0.00
41.96%
1.20
Proxy
14%
1.00
12%
0.80
10%
0.60
8%
0.40
6%
0.20
2%
0.00
0%
-0.20 Aug/13
Jan/13
Jun/12
Apr/11
Nov/11
Aug/13
Jan/13
Jun/12
Nov/11
Jan/13
Jun/12
1.92
Aug/13
Apr/11 Apr/11
Nov/11
Sep/10
Jul/09
Feb/10
Dec/08
Oct/07
May/08
Mar/07
Jan/06
Aug/06
Jun/05
Apr/04
Nov/04
Sep/03
Jul/02
Current:
Feb/03
Dec/01
Oct/00
May/01
Sep/10
Feb/10
Jul/09
Dec/08
May/08
Oct/07
Mar/07
Aug/06
Jan/06
Jun/05
Nov/04
Apr/04
Sep/03
Feb/03
Jul/02
Dec/01
Oct/00
May/01
Mar/00
Sep/10
Jul/09
Feb/10
Dec/08
Oct/07
May/08
Mar/07
Jan/06
Aug/06
Jun/05
Apr/04
Nov/04
Sep/03
Jul/02
Feb/03
Dec/01
Oct/00
May/01
Mar/00
Jan/99
Jun/98
Aug/13
Jan/13
Jun/12
Nov/11
Apr/11
Sep/10
Feb/10
Jul/09
Dec/08
May/08
Oct/07
Mar/07
Aug/06
Jan/06
Jun/05
Nov/04
0.0 Apr/04
5.0
-40.00 Sep/03
10.0
-20.00 Jul/02
15.0
0.00
Feb/03
20.0
20.00
Dec/01
25.0
40.00
Oct/00
30.0
60.00
May/01
35.0
80.00
Mar/00
40.0
100.00
Jan/99
120.00
Aug/99
45.0
13.5x
PBV Forward
Dividend Yield (Trailing)
140.00
Jun/98
Aug/99
Jun/98
Aug/13
42.56
Current: PBV hist
Mar/00
Current:
Jan/13
Jun/12
Nov/11
Apr/11
Sep/10
Feb/10
Jul/09
Dec/08
May/08
Oct/07
Mar/07
Aug/06
Jan/06
Jun/05
Nov/04
Apr/04
Sep/03
-10.0x
Feb/03
-40.0x Jul/02
0.0x
Dec/01
10.0x
-20.0x
May/01
20.0x
0.0x
Oct/00
20.0x
Mar/00
30.0x
Aug/99
40.0x
40.0x
Jan/99
60.0x
Jun/98
50.0x
ROE (Trailing)
Aug/99
Price/Book Value
80.0x
Aug/99
27.2x
Jun/98
Aug/13
Jan/13
Jun/12
Nov/11
Apr/11
Current:
-0.40
Jan/99
PE (1Yr Forward)
Sep/10
Feb/10
Jul/09
Dec/08
May/08
Oct/07
Mar/07
Aug/06
Jan/06
Jun/05
Nov/04
Apr/04
Sep/03
Feb/03
Jul/02
Dec/01
May/01
Oct/00
Mar/00
Aug/99
Jan/99
Jun/98
-2%
Jan/99
4%
Summary Dairy Farm International Holdings Ltd. 16166.19 HONG KONG 1.443438 SEDOL 6180274 Consumer Staples Food & Staples Retailing Latest Min 12mth Forward PE 27.24x P/BV (Trailing) 0.91 13.48x Dividend Yield (Trailing) 0.00 1.92 ROE (Trailing) -30.92 42.56 Implied Value of Growth -0.21 42.0%
Max
Median
Average
2 S.D.+
2 S.D. -
39.88 41.73 122.17 1.00
13.78 2.53 57.37 0.41
12.06 5.99 53.04 0.42
30.28 21.66 135.40 0.74
-6.16 -9.68 -29.31 0.10
Source: Bloomberg, Reuters Global Fundamentals, IBES CONSENSUS, J.P. Morgan Calcs
As Of: Local Price: EPS: % to Min % to Max % to Med -93% -100% -173% -150%
196% 2079% 187% 138%
2% 32% 35% -1%
2-Aug-13 11.90 0.44 % to Avg -10% 213% 25% 0%
* Implied Value Of Growth = (1 - EY/Cost of equity) where cost of equity =Bond Yield + 5.0% (ERP)
5
Asia Pacific Equity Research 05 August 2013
Ebru Sener Kurumlu (852) 2800-8521 [email protected]
Analyst Certification: The research analyst(s) denoted by an “AC” on the cover of this report certifies (or, where multiple research analysts are primarily responsible for this report, the research analyst denoted by an “AC” on the cover or within the document individually certifies, with respect to each security or issuer that the research analyst covers in this research) that: (1) all of the views expressed in this report accurately reflect his or her personal views about any and all of the subject securities or issuers; and (2) no part of any of the research analyst's compensation was, is, or will be directly or indirectly related to the specific recommendations or views expressed by the research analyst(s) in this report.
Important Disclosures
Lead or Co-manager: J.P. Morgan acted as lead or co-manager in a public offering of equity and/or debt securities for Dairy Farm International Holdings Limited within the past 12 months.
Client: J.P. Morgan currently has, or had within the past 12 months, the following company(ies) as clients: Dairy Farm International Holdings Limited.
Client/Investment Banking: J.P. Morgan currently has, or had within the past 12 months, the following company(ies) as investment banking clients: Dairy Farm International Holdings Limited.
Investment Banking (past 12 months): J.P. Morgan received in the past 12 months compensation from investment banking Dairy Farm International Holdings Limited.
Investment Banking (next 3 months): J.P. Morgan expects to receive, or intends to seek, compensation for investment banking services in the next three months from Dairy Farm International Holdings Limited.
Broker: J.P. Morgan Securities plc acts as Corporate Broker to Dairy Farm International Holdings Limited.
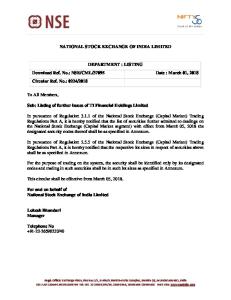
Company-Specific Disclosures: Important disclosures, including price charts, are available for compendium reports and all J.P. Morgan– covered companies by visiting https://mm.jpmorgan.com/disclosures/company, calling 1-800-477-0406, or e-mailing [email protected] with your request. J.P. Morgan’s Strategy, Technical, and Quantitative Research teams may screen companies not covered by J.P. Morgan. For important disclosures for these companies, please call 1-800-477-0406 or e-mail [email protected]. Dairy Farm International Holdings Limited (DAIR.SI, DFI SP) Price Chart
21
N $3.66 N $4.35 N $4.72 N $5.36 N $4.4N $6.15 N $6.6 N $7
Price($) 14
N $8 N $8.6
N $9 N $9.5
N $10
7
0 Oct 06
Jul 07
Apr 08
Jan 09
Oct 09
Jul 10
Apr 11
Jan 12
Oct 12
Jul 13
Date
Rating Share Price ($)
Price Target ($)
06-Mar-07
N
3.90
3.66
09-Aug-07
N
4.28
4.35
09-Mar-08
N
4.70
4.72
01-Aug-08
N
4.93
5.36
10-Mar-09
N
4.50
4.40
06-Aug-09
N
6.88
6.15
06-Mar-10
N
6.21
6.60
31-Jul-10
N
7.52
7.00
04-Mar-11
N
8.30
8.00
30-Jul-11
N
9.00
8.60
04-Mar-12
N
10.29
9.00
30-Jul-12
N
10.56
9.50
08-Mar-13
N
12.52
10.00
Source: Bloomberg and J.P. Morgan; price data adjusted for stock splits and dividends. Initiated coverage Mar 06, 2007.
The chart(s) show J.P. Morgan's continuing coverage of the stocks; the current analysts may or may not have covered it over the entire period. J.P. Morgan ratings or designations: OW = Overweight, N= Neutral, UW = Underweight, NR = Not Rated Explanation of Equity Research Ratings, Designations and Analyst(s) Coverage Universe: J.P. Morgan uses the following rating system: Overweight [Over the next six to twelve months, we expect this stock will outperform the average total return of the stocks in the analyst’s (or the analyst’s team’s) coverage universe.] Neutral [Over the next six to twelve months, we expect this stock will perform in line with the average total return of the stocks in the analyst’s (or the analyst’s team’s) coverage universe.] Underweight [Over the next six to twelve months, we expect this stock will underperform the average total return of 6
Ebru Sener Kurumlu (852) 2800-8521 [email protected]
Asia Pacific Equity Research 05 August 2013
the stocks in the analyst’s (or the analyst’s team’s) coverage universe.] Not Rated (NR): J.P. Morgan has removed the rating and, if applicable, the price target, for this stock because of either a lack of a sufficient fundamental basis or for legal, regulatory or policy reasons. The previous rating and, if applicable, the price target, no longer should be relied upon. An NR designation is not a recommendation or a rating. In our Asia (ex-Australia) and U.K. small- and mid-cap equity research, each stock’s expected total return is compared to the expected total return of a benchmark country market index, not to those analysts’ coverage universe. If it does not appear in the Important Disclosures section of this report, the certifying analyst’s coverage universe can be found on J.P. Morgan’s research website, www.jpmorganmarkets.com. Coverage Universe: Sener, Kurumlu Ebru: Ajisen China Holdings Ltd (0538.HK), Belle International Holdings Ltd. (1880.HK), Cafe de Coral Holdings Ltd (0341.HK), China Foods Ltd (0506.HK), China Mengniu Dairy Co. Ltd. (2319.HK), China Resources Enterprise (0291.HK), Chow Tai Fook Jewellery Company Ltd. (1929.HK), Dairy Farm International Holdings Limited (DAIR.SI), Esprit Holdings (0330.HK), Golden Eagle Retail Group Ltd (3308.HK), Hengan International Group Ltd (1044.HK), L'Occitane International SA (0973.HK), Li & Fung (0494.HK), Lifestyle International Holdings (1212.HK), New World Department Stores Ltd (0825.HK), Parkson Retail Group Ltd (3368.HK), Prada S.P.A (1913.HK), Sa Sa International Holdings Limited (0178.HK), Thai Beverage Public Company Ltd. (TBEV.SI), Tibet 5100 Water Resources Holdings Ltd (1115.HK), Tingyi (Cayman Islands) Holding Corp (0322.HK), Tsingtao Brewery - A (600600.SS), Tsingtao Brewery - H (0168.HK), Uni-President China Holdings Ltd (0220.HK), Want Want China Holdings Ltd (0151.HK) J.P. Morgan Equity Research Ratings Distribution, as of June 28, 2013 J.P. Morgan Global Equity Research Coverage IB clients* JPMS Equity Research Coverage IB clients*
Overweight (buy) 44% 56% 42% 76%
Neutral (hold) 44% 50% 50% 66%
Underweight (sell) 12% 40% 8% 55%
*Percentage of investment banking clients in each rating category. For purposes only of FINRA/NYSE ratings distribution rules, our Overweight rating falls into a buy rating category; our Neutral rating falls into a hold rating category; and our Underweight rating falls into a sell rating category. Please note that stocks with an NR designation are not included in the table above.
Equity Valuation and Risks: For valuation methodology and risks associated with covered companies or price targets for covered companies, please see the most recent company-specific research report at http://www.jpmorganmarkets.com, contact the primary analyst or your J.P. Morgan representative, or email [email protected]. Equity Analysts' Compensation: The equity research analysts responsible for the preparation of this report receive compensation based upon various factors, including the quality and accuracy of research, client feedback, competitive factors, and overall firm revenues. Registration of non-US Analysts: Unless otherwise noted, the non-US analysts listed on the front of this report are employees of non-US affiliates of JPMS, are not registered/qualified as research analysts under NASD/NYSE rules, may not be associated persons of JPMS, and may not be subject to FINRA Rule 2711 and NYSE Rule 472 restrictions on communications with covered companies, public appearances, and trading securities held by a research analyst account.
Other Disclosures J.P. Morgan ("JPM") is the global brand name for J.P. Morgan Securities LLC ("JPMS") and its affiliates worldwide. J.P. Morgan Cazenove is a marketing name for the U.K. investment banking businesses and EMEA cash equities and equity research businesses of JPMorgan Chase & Co. and its subsidiaries. All research reports made available to clients are simultaneously available on our client website, J.P. Morgan Markets. Not all research content is redistributed, e-mailed or made available to third-party aggregators. For all research reports available on a particular stock, please contact your sales representative. Options related research: If the information contained herein regards options related research, such information is available only to persons who have received the proper option risk disclosure documents. For a copy of the Option Clearing Corporation's Characteristics and Risks of Standardized Options, please contact your J.P. Morgan Representative or visit the OCC's website at http://www.optionsclearing.com/publications/risks/riskstoc.pdf Legal Entities Disclosures U.S.: JPMS is a member of NYSE, FINRA, SIPC and the NFA. JPMorgan Chase Bank, N.A. is a member of FDIC and is authorized and regulated in the UK by the Financial Services Authority. U.K.: J.P. Morgan Securities plc (JPMS plc) is a member of the London Stock Exchange and is authorized and regulated by the Financial Services Authority. Registered in England & Wales No. 2711006. Registered Office 25 Bank Street, London, E14 5JP. South Africa: J.P. Morgan Equities South Africa Proprietary Limited is a member of the Johannesburg Securities Exchange and is regulated by the Financial Services Board. Hong Kong: J.P. Morgan Securities (Asia Pacific) Limited (CE number AAJ321) is regulated by the Hong Kong Monetary Authority and the Securities and Futures Commission in Hong Kong. Korea: J.P. Morgan Securities (Far East) Ltd, Seoul Branch, is regulated by the Korea Financial Supervisory Service. Australia: J.P. Morgan Australia Limited (JPMAL) (ABN 52 002 888 011/AFS Licence No: 238188) is regulated by ASIC and J.P.
7
Ebru Sener Kurumlu (852) 2800-8521 [email protected]
Asia Pacific Equity Research 05 August 2013
Morgan Securities Australia Limited (JPMSAL) (ABN 61 003 245 234/AFS Licence No: 238066) is regulated by ASIC and is a Market, Clearing and Settlement Participant of ASX Limited and CHI-X. Taiwan: J.P.Morgan Securities (Taiwan) Limited is a participant of the Taiwan Stock Exchange (company-type) and regulated by the Taiwan Securities and Futures Bureau. India: J.P. Morgan India Private Limited, having its registered office at J.P. Morgan Tower, Off. C.S.T. Road, Kalina, Santacruz East, Mumbai - 400098, is a member of the National Stock Exchange of India Limited (SEBI Registration Number - INB 230675231/INF 230675231/INE 230675231) and Bombay Stock Exchange Limited (SEBI Registration Number - INB 010675237/INF 010675237) and is regulated by Securities and Exchange Board of India. Thailand: JPMorgan Securities (Thailand) Limited is a member of the Stock Exchange of Thailand and is regulated by the Ministry of Finance and the Securities and Exchange Commission. Indonesia: PT J.P. Morgan Securities Indonesia is a member of the Indonesia Stock Exchange and is regulated by the BAPEPAM LK. Philippines: J.P. Morgan Securities Philippines Inc. is a Trading Participant of the Philippine Stock Exchange and a member of the Securities Clearing Corporation of the Philippines and the Securities Investor Protection Fund. It is regulated by the Securities and Exchange Commission. Brazil: Banco J.P. Morgan S.A. is regulated by the Comissao de Valores Mobiliarios (CVM) and by the Central Bank of Brazil. Mexico: J.P. Morgan Casa de Bolsa, S.A. de C.V., J.P. Morgan Grupo Financiero is a member of the Mexican Stock Exchange and authorized to act as a broker dealer by the National Banking and Securities Exchange Commission. Singapore: This material is issued and distributed in Singapore by J.P. Morgan Securities Singapore Private Limited (JPMSS) [MIC (P) 049/04/2013 and Co. Reg. No.: 199405335R] which is a member of the Singapore Exchange Securities Trading Limited and is regulated by the Monetary Authority of Singapore (MAS) and/or JPMorgan Chase Bank, N.A., Singapore branch (JPMCB Singapore) which is regulated by the MAS. Japan: JPMorgan Securities Japan Co., Ltd. is regulated by the Financial Services Agency in Japan. Malaysia: This material is issued and distributed in Malaysia by JPMorgan Securities (Malaysia) Sdn Bhd (18146-X) which is a Participating Organization of Bursa Malaysia Berhad and a holder of Capital Markets Services License issued by the Securities Commission in Malaysia. Pakistan: J. P. Morgan Pakistan Broking (Pvt.) Ltd is a member of the Karachi Stock Exchange and regulated by the Securities and Exchange Commission of Pakistan. Saudi Arabia: J.P. Morgan Saudi Arabia Ltd. is authorized by the Capital Market Authority of the Kingdom of Saudi Arabia (CMA) to carry out dealing as an agent, arranging, advising and custody, with respect to securities business under licence number 35-07079 and its registered address is at 8th Floor, Al-Faisaliyah Tower, King Fahad Road, P.O. Box 51907, Riyadh 11553, Kingdom of Saudi Arabia. Dubai: JPMorgan Chase Bank, N.A., Dubai Branch is regulated by the Dubai Financial Services Authority (DFSA) and its registered address is Dubai International Financial Centre - Building 3, Level 7, PO Box 506551, Dubai, UAE. Country and Region Specific Disclosures U.K. and European Economic Area (EEA): Unless specified to the contrary, issued and approved for distribution in the U.K. and the EEA by JPMS plc. Investment research issued by JPMS plc has been prepared in accordance with JPMS plc's policies for managing conflicts of interest arising as a result of publication and distribution of investment research. Many European regulators require a firm to establish, implement and maintain such a policy. This report has been issued in the U.K. only to persons of a kind described in Article 19 (5), 38, 47 and 49 of the Financial Services and Markets Act 2000 (Financial Promotion) Order 2005 (all such persons being referred to as "relevant persons"). This document must not be acted on or relied on by persons who are not relevant persons. Any investment or investment activity to which this document relates is only available to relevant persons and will be engaged in only with relevant persons. In other EEA countries, the report has been issued to persons regarded as professional investors (or equivalent) in their home jurisdiction. Australia: This material is issued and distributed by JPMSAL in Australia to "wholesale clients" only. This material does not take into account the specific investment objectives, financial situation or particular needs of the recipient. The recipient of this material must not distribute it to any third party or outside Australia without the prior written consent of JPMSAL. For the purposes of this paragraph the term "wholesale client" has the meaning given in section 761G of the Corporations Act 2001. Germany: This material is distributed in Germany by J.P. Morgan Securities plc, Frankfurt Branch and J.P.Morgan Chase Bank, N.A., Frankfurt Branch which are regulated by the Bundesanstalt für Finanzdienstleistungsaufsicht. Hong Kong: The 1% ownership disclosure as of the previous month end satisfies the requirements under Paragraph 16.5(a) of the Hong Kong Code of Conduct for Persons Licensed by or Registered with the Securities and Futures Commission. (For research published within the first ten days of the month, the disclosure may be based on the month end data from two months prior.) J.P. Morgan Broking (Hong Kong) Limited is the liquidity provider/market maker for derivative warrants, callable bull bear contracts and stock options listed on the Stock Exchange of Hong Kong Limited. An updated list can be found on HKEx website: http://www.hkex.com.hk. Japan: There is a risk that a loss may occur due to a change in the price of the shares in the case of share trading, and that a loss may occur due to the exchange rate in the case of foreign share trading. In the case of share trading, JPMorgan Securities Japan Co., Ltd., will be receiving a brokerage fee and consumption tax (shouhizei) calculated by multiplying the executed price by the commission rate which was individually agreed between JPMorgan Securities Japan Co., Ltd., and the customer in advance. Financial Instruments Firms: JPMorgan Securities Japan Co., Ltd., Kanto Local Finance Bureau (kinsho) No. 82 Participating Association / Japan Securities Dealers Association, The Financial Futures Association of Japan, Type II Financial Instruments Firms Association and Japan Investment Advisers Association. Korea: This report may have been edited or contributed to from time to time by affiliates of J.P. Morgan Securities (Far East) Ltd, Seoul Branch. Singapore: JPMSS and/or its affiliates may have a holding in any of the securities discussed in this report; for securities where the holding is 1% or greater, the specific holding is disclosed in the Important Disclosures section above. India: For private circulation only, not for sale. Pakistan: For private circulation only, not for sale. New Zealand: This material is issued and distributed by JPMSAL in New Zealand only to persons whose principal business is the investment of money or who, in the course of and for the purposes of their business, habitually invest money. JPMSAL does not issue or distribute this material to members of "the public" as determined in accordance with section 3 of the Securities Act 1978. The recipient of this material must not distribute it to any third party or outside New Zealand without the prior written consent of JPMSAL. Canada: The information contained herein is not, and under no circumstances is to be construed as, a prospectus, an advertisement, a public offering, an offer to sell securities described herein, or solicitation of an offer to buy securities described herein, in Canada or any province or territory thereof. Any offer or sale of the securities described herein in Canada will be made only under an exemption from the requirements to file a prospectus with the relevant Canadian securities regulators and only by a dealer properly registered under applicable securities laws or, alternatively, pursuant to an exemption from the dealer registration requirement in the relevant province or territory of Canada in which such offer or sale is made. The information contained herein is under no circumstances to be construed as investment advice in any province or territory of Canada and is not tailored to the needs of the recipient. To the extent that the information contained herein references securities of an issuer incorporated, formed or created under the laws of Canada or a province or territory of Canada, any trades in such securities must be conducted through a dealer registered in Canada. No securities commission or similar regulatory authority in Canada has reviewed or in any way passed judgment upon these materials, the information contained herein or the merits of the securities described herein, and any representation to the contrary is an offence. Dubai: This report has been issued to persons regarded as professional clients as defined under the DFSA rules. Brazil: Ombudsman J.P. Morgan: 0800-7700847 / [email protected]. General: Additional information is available upon request. Information has been obtained from sources believed to be reliable but JPMorgan Chase & Co. or its affiliates and/or subsidiaries (collectively J.P. Morgan) do not warrant its completeness or accuracy except with respect to any disclosures relative to JPMS and/or its affiliates and the analyst's involvement with the issuer that is the subject of the research. All pricing is as of the close of market for the 8
Ebru Sener Kurumlu (852) 2800-8521 [email protected]
Asia Pacific Equity Research 05 August 2013
securities discussed, unless otherwise stated. Opinions and estimates constitute our judgment as of the date of this material and are subject to change without notice. Past performance is not indicative of future results. This material is not intended as an offer or solicitation for the purchase or sale of any financial instrument. The opinions and recommendations herein do not take into account individual client circumstances, objectives, or needs and are not intended as recommendations of particular securities, financial instruments or strategies to particular clients. The recipient of this report must make its own independent decisions regarding any securities or financial instruments mentioned herein. JPMS distributes in the U.S. research published by non-U.S. affiliates and accepts responsibility for its contents. Periodic updates may be provided on companies/industries based on company specific developments or announcements, market conditions or any other publicly available information. Clients should contact analysts and execute transactions through a J.P. Morgan subsidiary or affiliate in their home jurisdiction unless governing law permits otherwise. "Other Disclosures" last revised May 4, 2013.
Copyright 2013 JPMorgan Chase & Co. All rights reserved. This report or any portion hereof may not be reprinted, sold or redistributed without the written consent of J.P. Morgan. #$J&098$#*P
9