Asia Pacific Equity Research 08 May 2014
Underweight
Wilmar International Limited
WLIL.SI, WIL SP Price: S$3.34
Missing even our lower-than-consensus forecast by c.30%, still tough times ahead
▼ Price Target: S$2.90 Previous: S$3.00
Wilmar’s 1Q14 net profit c.30%/c.35% below JPM/consensus: Wilmar reported 1Q14 core net profit of US$215 million (-32% Y/Y), which missed JPM/consensus forecasts by 30%/35%. The weakness came from losses at oilseeds (in line with our earlier view), and compression in palm oil refining margin, which has historically been resilient. We maintain UW, and further reduce our FY14/FY15 earnings estimates by 14%/10% as we lower our margin assumptions further to reflect the performance in 1Q14. Losses at oilseeds: Oilseeds & grains sank into a loss of US$57 million with PBT margin of US$-11.6/MT in line with our expectations. We believe this is a negative surprise to the Street, which has been anticipating a Q/Q margin per MT decline from the US$20/MT achieved in 4Q13 but not a loss. Hence, we see meaningful consensus earnings downgrades triggered by this outcome. Volume growth of 6% was in line with our forecast. Palm refining margin broke below US$30/MT: Palm & laurics margin declined for the fifth consecutive quarter to US$28.9/MT. Wilmar appears pressured by higher CPO feedstock costs as well as the imminent refinery overcapacity in Indonesia, which is expected to increase by c.50%. Volume growth was also lackluster at just +1% Y/Y.
Singapore ASEAN Agri-Commodities Ying-Jian Chan, CFA
AC
(65) 6882-2378
[email protected] Bloomberg JPMA YCHAN
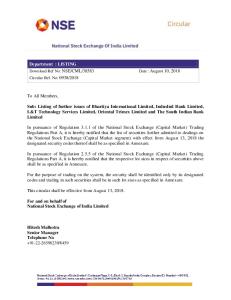
J.P. Morgan Securities Singapore Private Limited Price Performance
3.5 S$ 3.3 3.1 2.9 May-13
Aug-13
Nov-13
Feb-14
May-14
WLIL.SI share price (S$) FTSTI (rebased)
Abs Rel
YTD -2.3% -4.8%
1m -4.3% -5.7%
3m 3.4% -4.4%
12m -1.2% 3.6%
Other segments unable to mitigate the weakness: Consumer products earnings rose 26% on better volume and margin. Upstream plantations also registered 53% increase in earnings on higher CPO price. However, these were insufficient to offset the poor performance from the two major earnings contributors. Losses at sugar were also wider than expected due to unrealized hedging losses and lower sugar refining margins in Indonesia. Maintain UW, continued underperformance expected: We believe it is unlikely that oilseeds margin would have seen recovery in 2Q14, and a 2H recovery is uncertain given rising risk of El Nino that could disrupt soybean supply and drive soybean feedstock cost higher. Furthermore margin pressure for palm & laurics may persist as industry overcapacity adds further stress. We roll our SOTP PT to Jun-2015 with a new PT of S$2.90. Wilmar International Limited (Reuters: WLIL.SI, Bloomberg: WIL SP) $ in mn, year-end Dec FY12A FY13A FY14E FY15E Revenue ($ mn) 45,463 44,085 47,873 50,347 Net Profit ($ mn) 1,255 1,319 1,038 1,228 EPS ($) 0.20 0.21 0.16 0.19 DPS ($) 0.04 0.06 0.05 0.06 Revenue growth (%) 1.7% (3.0%) 8.6% 5.2% EPS growth (%) (21.6%) 5.1% (21.3%) 18.3% EPS Recurring Growth (23.1%) 11.7% (20.3%) 18.3% ROE 8.4% 8.9% 6.7% 7.4% P/E (x) 13.6 13.0 16.5 13.9 P/BV (x) 1.2 1.1 1.1 1.0 Dividend Yield 1.5% 2.4% 1.8% 2.2% Net Profit (Recurring) ($ mn) 1,167 1,303 1,038 1,228 EPS (Recurring) ($) 0.18 0.20 0.16 0.19
FY16E 53,702 1,309 0.20 0.06 6.7% 6.6% 6.6% 7.5% 13.1 1.0 2.3% 1,309 0.20
Company Data Shares O/S (mn) Market Cap (S$ mn) Market Cap ($ mn) Price (S$) Date Of Price Free Float(%) 3M - Avg daily vol (mn) 3M - Avg daily val (S$ mn) 3M - Avg daily val ($ mn) FTSTI Exchange Rate Price Target End Date Price Target (S$)
6,403 21,385 17,121 3.34 08 May 14 36.1% 8.31 28.39 22.7 3247.69 1.25 30-Jun-15 2.90
Source: Company data, Bloomberg, J.P. Morgan estimates.
See page 12 for analyst certification and important disclosures, including non-US analyst disclosures. J.P. Morgan does and seeks to do business with companies covered in its research reports. As a result, investors should be aware that the firm may have a conflict of interest that could affect the objectivity of this report. Investors should consider this report as only a single factor in making their investment decision. www.jpmorganmarkets.com
Asia Pacific Equity Research 08 May 2014
Ying-Jian Chan, CFA (65) 6882-2378 [email protected]
Key catalysts for the stock price: • Losses arising from negative oilseeds margin in China
Upside risks to our PT: • Correction in soybean price providing relief to crush margin
Downside risks to our PT: • Losses from palm oil and/or oilseeds arising from wrong directional trades
• Palm refining margin erosion from increased industry capacity in industry.
• Ability to increase cooking oil price to pass on cost increase to customers
• Margin compression from competition
Key financial metrics Revenues (US$ Mn) Revenue growth (%) EBITDA (US$ Mn) EBITDA margin (%) Tax rate (%) Net profit (US$ Mn) EPS (US$) EPS growth (%) DPS (US$) BVPS (US$) Operating cash flow (US$ mn) Free cash flow (US$ mn) Interest cover (X) Net margin (%) Sales/assets (X) Debt/equity (%) Net debt/equity (%) ROE (%) Key model assumptions Palm & laurics margin Oilseeds & grains margin Consumer products margin
FY14E 47,873 9% 2,356 4.9% 23.0% 1038 16.22 -20% 0.06 2.51 1,986 485.5 3.1 2.2% 1.01 162.8% 88.8% 6.7% FY14E 30.0 0.0 40.00
FY13A 44,085 -3% 2,268 5.1% 21.7% 1303 20.36 12% 0.08 2.34 1,614 237.3 4.2 3.0% 1.00 174.6% 96.4% 8.9% FY13A 34.9 11.2 40.46
FY15E 50,347 5% 2,693 5.3% 23.0% 1228 19.19 18% 0.07 2.65 1,558 58.1 3.5 2.4% 1.04 154.5% 86.1% 7.4% FY15E 28.0 10.0 40.00
FY16E 53,702 7% 2,898 5.4% 23.0% 1309 20.46 7% 0.08 2.79 1,547 47.2 3.8 2.4% 1.08 146.6% 83.6% 7.5% FY16E 28.0 10.0 40.00
Valuation and price target basis Our Dec-2014 PT of S$3.00 is based sum of the parts valuation below:
Chart to support valuation and price target
Palm & laurics Oilseeds & grains Consumer products Plantation and palm oil mills Sugar Associates Fair value of Wilmar International (US$) Fair value of Wilmar International (S$) Price target (S$)
Valuation 12.0x P/E 1x P/B 13.0x P/E 12.0x P/E 10.0x P/E 10.0x P/E
FY14E 14.3 0.9
Implied P/E Implied P/B
Per share (S$) 1.02 0.27 0.39 0.37 0.17 0.09 2.31 2.90 2.90 FY15E 12.1 0.9
Source: J.P. Morgan estimates.
Source: Bloomberg, Company and J.P. Morgan estimates.
Sensitivity analysis Sensitivity to US$10 chg in palm & laurics margin US$10 chg in oilseeds & grains margin US$10 chg in consumer product margin
PBT (%) FY14E FY15E 10.3% 9.8% 8.4% 7.8% 2.3% 2.2%
JPMe vs. consensus, change in estimates Net Income FY14E JPMe old 1,200 JPMe new 1,038 % chg -13.5% Consensus 1,443
EPS (%) FY14E FY15E 16.1% 15.4% 13.2% 12.2% 3.6% 3.5%
Source: Bloomberg, Company data and J.P. Morgan estimates.
FY15E 1,359 1,228 -9.6% 1,594
Source: Bloomberg, Company data and J.P. Morgan estimates.
Peer valuation comparison As at: 08 May-14 Archer-Daniels-Midland Bunge China Agri-Industries Conagra Foods Inc Noble Group Olam International Wilmar International Weighted average
Ticker
Ctry
ADM US BG US 606 HK CAG US NOBL SP OLAM SP WIL SP
USA USA HKG USA HKG SGP SGP
Source: J.P. Morgan estimates, Company data, Bloomberg.
2
Mkt cap (US$mn) 28,973 11,350 2,066 12,984 6,649 4,302 17,139 83,463
Price (LC) 44.27 77.10 3.05 30.83 1.25 2.23 3.34
Rating N OW OW N NR OW UW
Target (LC) 39.00 87.00 5.40 23.00 1.15 2.00 2.90
P/E CY14E CY15E 14.5 13.1 12.5 10.6 9.3 8.2 13.5 12.7 13.0 11.4 13.8 12.4 16.5 14.0 14.2 12.6
ROE CY14E CY15E 9.3 9.6 8.7 9.7 6.2 6.7 16.8 NA 9.6 10.1 11.3 7.9 6.7 7.4 11.7 9.0
Div Yld CY14E CY15E 2.0% 2.1% 1.5% 1.6% 2.7% 3.0% 3.3% 3.3% 1.9% 2.2% 1.9% 2.1% 1.8% 2.1% 2.1% 2.3%
P/B FY14E FY15E 1.4 1.3 1.0 0.9 0.6 0.5 2.2 2.0 1.2 1.1 1.6 1.4 1.1 1.0 1.4 1.3
Asia Pacific Equity Research 08 May 2014
Ying-Jian Chan, CFA (65) 6882-2378 [email protected]
Table 1: 1Q13 results overview US$ in millions Revenue Merchandising & processing - Palm and laurics - Oilseeds and grains Consumer products Plantation and PO mills Sugar - Milling - Refining Others Eliminations PBT Merchandising & processing - Palm and laurics - Oilseeds and grains Consumer products Plantation and PO mills Sugar - Milling - Refining Others Associates' profits Unallocated inc / (exp) Volume ('000 MT) Merchandising & processing - Palm and laurics - Oilseeds and grains Consumer products Sugar - milling Sugar - refining PBT per MT (US$/MT) Merchandising & processing - Palm and laurics - Oilseeds and grains Consumer products Sugar - milling Sugar - refining Net income (reported) Net income (recurring)
1Q12 10,471 8,121 5,431 2,690 1,891 434 457 50 407 810 (1,242) 389 182 235 (53) 50 99 (48) (58) 10 92 22 (8)
2Q12 11,020 9,094 6,008 3,086 1,380 416 841 112 728 671 (1,382) 149 120 160 (40) 18 79 (60) (79) 19 (35) 31 (4)
3Q12 12,349 9,382 5,780 3,602 2,072 459 1,272 507 765 633 (1,468) 569 241 181 60 48 117 101 76 26 22 48 (10)
4Q12 11,623 9,087 5,529 3,559 1,753 419 1,072 408 664 613 (1,321) 548 241 195 46 41 116 107 68 39 31 22 (10)
1Q13 10,201 7,633 4,543 3,090 2,037 349 769 55 714 609 (1,196) 417 266 219 47 57 72 (14) (56) 42 (14) 53 (4)
2Q13 10,426 8,092 5,093 2,999 1,508 315 1,064 177 887 661 (1,214) 282 240 225 15 30 53 (30) (52) 22 (33) 25 (2)
3Q13 11,837 8,692 4,908 3,784 2,068 338 1,385 640 745 654 (1,300) 566 266 212 54 58 58 151 128 24 27 8 (1)
4Q13 11,622 9,141 5,382 3,759 1,942 431 814 196 618 743 (1,449) 510 316 201 116 75 87 19 (1) 20 (1) 18 (3)
1Q14 10,269 8,196 4,838 3,358 2,103 381 682 21 661 535 (1,628) 206 105 162 (57) 71 110 (54) (79) 25 (37) 16 (6)
9,577 5,169 4,408 1,206 85 495
10,211 5,623 4,588 897 257 1,039
11,094 5,850 5,244 1,316 1,204 1,175
11,785 6,474 5,311 1,190 1,213 1,020
10,197 5,531 4,666 1,325 97 1,210
10,692 6,194 4,498 1,094 436 1,691
11,726 6,104 5,622 1,504 1,879 1,546
12,511 6,677 5,834 1,499 668 1,265
45.5 (11.9) 41.7 (682.3) 20.4 256 206
28.5 (8.7) 20.0 (308.0) 18.2 117 172
31.0 11.5 36.8 62.8 21.9 406 388
30.1 8.7 34.1 55.9 38.1 477 401
39.5 10.1 42.7 (574.3) 34.8 315 314
36.2 3.4 27.3 (119.6) 12.9 219 245
34.7 9.5 38.7 67.9 15.4 416 391
30.0 19.8 49.8 (1.7) 16.2 369 353
Y/Y 1% 7% 6% 9% 3% 9% -11% -61% -7% -12% 36% -51% -61% -26% -222% 26% 53% 297% 42% -40% 170% -70% 54%
Q/Q -12% -10% -10% -11% 8% -11% -16% -89% 7% -28% 12% -60% -67% -19% -150% -5% 27% -380% 23% -8% 76%
10,557 5,607 4,950 1,546 50 1,360
4% 1% 6% 17% -48% 12%
-16% -16% -15% 3% -93% 8%
28.9 (11.6) 45.9 (1,583) 18.5 162 215
-27% -215% 8% 176% -47% -49% -32%
-4% -159% -8% 14% -56% -39%
Source: J.P. Morgan, Company data.
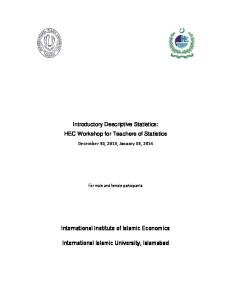
Figure 1: China back-to-back crush margin trend and Wilmar’s reported oilseeds & grains margin during various periods of pressure US$/MT
350
2Q13: US$3.4 Reasons: avian flu. 1Q14: US$-11.6
300 250 200 150 100
Apr-14
Jan-14
Oct-13
Jul-13
Apr-13
Jan-13
Oct-12
Jul-12
Apr-12
Jan-12
Oct-11
Jul-11
Apr-11
Jan-11
Jul-10
Apr-10
Jan-10
Oct-09
Jul-09
Apr-09
Jan-09
0
Oct-10
3Q10: US$-7.5 ; 4Q10: US$-36.5 1Q12: US$-11.9; 2Q12: US$-8.7 Reasons: steep spike in soybean px; onset of industry overcapacity.
50
Source: J.P. Morgan estimates, Company data.
3
Asia Pacific Equity Research 08 May 2014
Ying-Jian Chan, CFA (65) 6882-2378 [email protected]
Figure 2: Oilseeds & grains sales volume and PBT/MT margin trend 7,000
60
6,000
40
5,000
20
4,000
0
3,000
-20
2,000
Volume ('000 MT)
1Q14
4Q13
3Q13
2Q13
1Q13
4Q12
3Q12
2Q12
1Q12
4Q11
3Q11
2Q11
1Q11
4Q10
-60
3Q10
0
2Q10
-40
1Q10
1,000
PBT/MT (R)
Source: J.P. Morgan, Company data.
Figure 3: Palm & laurics sales volume & PBT/MT margin trend
Volume ('000 MT) (L)
1Q14
4Q13
3Q13
2Q13
1Q13
4Q12
3Q12
2Q12
1Q12
4Q11
3Q11
2Q11
1Q11
4Q10
3Q10
2Q10
50 45 40 35 30 25 20 15 10 5 0
1Q10
8,000 7,000 6,000 5,000 4,000 3,000 2,000 1,000 0 PBT / MT (US$) (R)
Source: J.P. Morgan, Company data.
Figure 4: Palm oil to Gas oil spread US$/MT
Source: J.P. Morgan, Company data.
4
Jan-14
Jul-13
Jan-13
Jul-12
Jan-12
Jul-11
Jan-11
Jul-10
Jan-10
Jul-09
Jan-09
Jul-08
Jan-08
Jul-07
Jan-07
Jul-06
Jan-06
500 400 300 200 100 0 (100) (200) (300) (400) (500)
Asia Pacific Equity Research 08 May 2014
Figure 5: Dalian soybean meal price Rmb/MT
5,000 4,500 4,000 3,500
Apr-14
Jan-14
Oct-13
Jul-13
Apr-13
Jan-13
Oct-12
Jul-12
Apr-12
Jan-12
Oct-11
Jul-11
Apr-11
Jan-11
Oct-10
Jul-10
Jan-10
2,500
Apr-10
3,000
Source: J.P. Morgan, Bloomberg.
Figure 6: Dalian soybean oil price
Jul-11
Oct-11
Jan-12
Apr-12
Jul-12
Oct-12
Jan-13
Apr-13
Jul-13
Oct-13
Jan-14
Apr-14
Jul-11
Oct-11
Jan-12
Apr-12
Jul-12
Oct-12
Jan-13
Apr-13
Jul-13
Oct-13
Jan-14
Apr-14
Apr-11
Jan-11
Oct-10
Jul-10
Jan-10
11,000 10,500 10,000 9,500 9,000 8,500 8,000 7,500 7,000 6,500 6,000
Apr-10
Rmb/MT
Source: J.P. Morgan, Bloomberg.
Figure 7: CBOT soybean price
Apr-11
Jan-11
Oct-10
Jul-10
1,800 1,700 1,600 1,500 1,400 1,300 1,200 1,100 1,000 900
Apr-10
US$/bushel
Jan-10
Ying-Jian Chan, CFA (65) 6882-2378 [email protected]
Source: J.P. Morgan, Bloomberg.
5
9 8 7 6 5 4 3 2 1 0
6
Aug-06 Oct-06 Dec-06 Feb-07 Apr-07 Jun-07 Aug-07 Oct-07 Dec-07 Feb-08 Apr-08 Jun-08 Aug-08 Oct-08 Dec-08 Feb-09 Apr-09 Jun-09 Aug-09 Oct-09 Dec-09 Feb-10 Apr-10 Jun-10 Aug-10 Oct-10 Dec-10 Feb-11 Apr-11 Jun-11 Aug-11 Oct-11 Dec-11 Feb-12 Apr-12 Jun-12 Aug-12 Oct-12 Dec-12 Feb-13 Apr-13 Jun-13 Aug-13 Oct-13 Dec-13 Feb-14 Apr-14
35 30 25 20 15 10 5 0 Aug-06 Oct-06 Dec-06 Feb-07 Apr-07 Jun-07 Aug-07 Oct-07 Dec-07 Feb-08 Apr-08 Jun-08 Aug-08 Oct-08 Dec-08 Feb-09 Apr-09 Jun-09 Aug-09 Oct-09 Dec-09 Feb-10 Apr-10 Jun-10 Aug-10 Oct-10 Dec-10 Feb-11 Apr-11 Jun-11 Aug-11 Oct-11 Dec-11 Feb-12 Apr-12 Jun-12 Aug-12 Oct-12 Dec-12 Feb-13 Apr-13 Jun-13 Aug-13 Oct-13 Dec-13 Feb-14 Apr-14
Ying-Jian Chan, CFA (65) 6882-2378 [email protected] Asia Pacific Equity Research 08 May 2014
Figure 8: 12-month forward P/E
(x)
+2SD=23.8x +1SD=19.6x Mean=15.4x
12M Fwd P/E
12M Fwd P/B
Source: J.P. Morgan estimates, Company data, Bloomberg.
-1SD=11.2x -2SD=7.0x
Mean
Mean
-1 Std Dev
-1 Std Dev
+1 Std Dev
Source: J.P. Morgan estimates, Company data, Bloomberg.
(x)
Figure 9: 12-month forward P/BV
+2SD=4.5x +1SD=3.3x Mean=2.1x -1SD=0.9x
+1 Std Dev
Ying-Jian Chan, CFA (65) 6882-2378 [email protected]
Asia Pacific Equity Research 08 May 2014
Figure 10: Wilmar key assumptions US$ in millions, unless otherwise stated FY11
Volume growth assumptions Palm and laurics FY14E: From 8% to 3% FY15E-16E: From 8% to 5% Sugar merchandising & processing FY14E-16E: From 20% to 15%
Margin assumptions (US$/MT) Palm & laurics FY14E: From 34 to 30 FY15E: From 33 to 28 FY16E: From 32 to 28 Oilseeds and grains FY14E: From 5 to 0 Consumer products FY14E-16E: From 30 to 40 Sugar milling FY14E-16E: From 6 to 5 Sugar refining FY14E-16E: From 20 to 18
Vol by seg ('000 MT) Merchandising & proc'ing - Palm and laurics - Oilseeds and grains Consumer products Plantation and palm oil mills - FFB production - CPO production - Palm kernel production Sugar - Milling - Merchandising & proc'ing Vol growth by seg Merchandising & proc'ing - Palm and laurics - Oilseeds and grains Consumer products Plantation and palm oil mills - FFB production - CPO production - Palm kernel production Sugar - Milling - Merchandising & proc'ing PBT by segment Merchandising & proc'ing - Palm and laurics - Oilseeds and grains Consumer products Plantation and palm oil mills Sugar Others Share of associates' profits Unallocated expenses PBT growth by segment Merchandising & proc'ing - Palm and laurics - Oilseeds and grains Consumer products Plantation and palm oil mills Sugar Others Share of associates' profits Unallocated expenses % PBT Merchandising & proc'ing - Palm and laurics - Oilseeds and grains Consumer products Plantation and palm oil mills Sugar Others Share of associates' profits Unallocated expenses PBT/MT by seg (US$/MT) Merchandising & proc'ing - Palm and laurics - Oilseeds and grains Consumer products Sugar - milling Sugar - refining
FY12
FY13E
FY14E
FY15E
FY16E
40,245 20,306 19,939 4,397
42,666 23,115 19,551 4,608
45,125 24,506 20,619 5,423
46,891 25,241 21,650 5,965
49,236 26,503 22,732 6,562
51,697 27,828 23,869 7,218
4,073 1,779 414
4,210 1,909 450
4,041 1,848 423
4,397 1,993 461
4,436 2,011 465
4,598 2,084 482
2,669 2,458
2,759 3,729
3,080 5,712
3,172 6,569
3,268 7,554
3,366 8,687
2.9% -2.5% 9.1% 19.5%
6.0% 13.8% -1.9% 4.8%
5.8% 6.0% 5.5% 17.7%
3.9% 3.0% 5.0% 10.0%
5.0% 5.0% 5.0% 10.0%
5.0% 5.0% 5.0% 10.0%
21.6% 11.3% 11.3%
3.4% 7.3% 8.8%
-4.0% -3.2% -5.9%
8.8% 7.8% 8.8%
0.9% 0.9% 0.9%
3.6% 3.6% 3.6%
3.4% 51.7% 1,655 785 771 14 157 411 100 110 123 (32) -20% -22% 32% -97% 84% -44% -29% 165% -34% -73% 100% 47% 47% 1% 10% 25% 6% 7% 7% -2%
11.6% 53.2% 1,775 1,087 856 232 219 270 127 (21) 104 (10) 7% 38% 11% 1548% 40% -34% 27% -119% -16% -68% 100% 61% 48% 13% 12% 15% 7% -1% 6% -1%
3.0% 15.0% 1,422 757 757 0 239 270 134 0 72 (50) -20% -30% -12% -100% 9% 0% 6% -100% -31% 391% 100% 53% 53% 0% 17% 19% 9% 0% 5% -4%
3.0% 15.0% 1,682 969 742 227 262 272 152 0 76 (50) 18% 28% -2% NA 10% 1% 14%
3.0% 15.0% 1,793 1,018 779 239 289 282 173 0 81 (50) 7% 5% 5% 5% 10% 4% 14%
5% 0% 100% 58% 44% 14% 16% 16% 9% 0% 4% -3%
7% 0% 100% 57% 43% 13% 16% 16% 10% 0% 4% -3%
18.40 33.36 0.72 34.12 2.24 25.11
24.10 34.92 11.24 40.46 6.01 18.92
16.15 30.00 0.00 40.00 5.00 18.00
19.69 28.00 10.00 40.00 5.00 18.00
19.69 28.00 10.00 40.00 5.00 18.00
2,079 1,009 586 423 85 734 141 42 185 (117) 26% 43% 0% 260% -43% 15% -78% 386% 62% 100% 49% 28% 20% 4% 35% 7% 2% 9% -6% 25.07 28.85 21.21 19.40
Source: J.P. Morgan estimates Company data.
7
Asia Pacific Equity Research 08 May 2014
Ying-Jian Chan, CFA (65) 6882-2378 [email protected]
Table 2: Plantations sector regional peer comparison As at: 08 May-14 Indonesia Astra Agro Lestari BW Plantation London Sumatra Indon Salim Ivomas Pratama Sampoerna Agro Weighted average Malaysia Felda Global Ventures Genting Plantations TSH Resources IJM Plantations IOI Corporation Kuala Lumpur Kepong Kulim Malaysia Sarawak Oil Palms Sime Darby Weighted average Singapore Bumitama Agri First Resources Golden Agri-Resources Indofood Agri Resources Mewah International Wilmar International Weighted average Sector weighted average
Ticker
Price (LC)
Rating
Mkt cap (US$mn)
P/E CY14E CY15E
EV/ha (US$) 2yr EPS CAGR FY14E 2014 - 2016E
P/B FY14E
ROE FY14E
Div Yld FY14E
Target (LC)
AALI IJ BWPT IJ LSIP IJ SIMP IJ SGRO IJ
29,025 1,395 2,420 1,005 2,275
UW UW OW N NC
3,953 539 1,428 1,375 372 7,295
18.4 19.3 13.0 14.0 12.9 16.6
20.4 17.5 13.6 14.0 11.0 17.6
22,730 17,079 16,779 10,467 NA 18,837
-9.5% 13.0% -0.8% 0.8% NA -4.2%
4.0 2.8 2.2 1.1 1.5 3.0
23.3 15.5 18.1 8.0 10.7 18.8
2.5% 1.6% 3.1% 2.0% 1.5% 2.4%
22,100 1,010 2,850 910 -
FGV MK GENP MK TSH MK IJMP MK IOI MK KLK MK KUL MK SOP MK SIME MK
4.55 11.10 3.27 3.60 5.00 24.34 3.53 6.60 9.48
N OW NC NC OW N NC NC N
5,126 2,606 906 896 9,805 8,005 1,394 894 17,754 43,297
21.6 21.5 18.8 18.8 21.1 21.9 18.8 16.5 16.7 19.5
23.0 18.9 16.5 14.6 20.4 21.4 15.3 12.7 15.5 18.8
16,056 30,413 NA NA 56,513 47,621 NA NA 35,622 39,941
-3.3% 19.2% 11.2% NA 2.4% 0.8% 8.2% NA 5.9% 3.8%
2.5 2.7 2.4 1.9 2.3 3.2 0.8 NA 2.0 2.4
11.6 13.1 13.7 7.4 10.6 15.1 5.9 12.8 11.6 12.1
3.5% 1.0% 1.3% 1.7% 3.0% 2.6% 1.0% 1.1% 3.4% 3.1%
4.90 12.20 5.20 21.80 9.20
BAL SP FR SP GGR SP IFAR SP MII SP WIL SP
1.14 2.50 0.60 1.08 0.48 3.34
NC OW N UW UW UW
1,607 3,176 6,125 1,222 574 17,139 28,236 78,828
15.0 12.2 13.6 13.0 28.8 16.5 15.5 17.8
12.4 10.9 11.8 12.2 25.6 14.0 13.3 16.7
NA 26,509 20,418 13,129 NA 77,637 56,248 43,738
19.9% 13.8% 7.0% 5.1% 2.9% 12.3% 10.8% 5.6%
2.8 2.7 0.7 1.0 1.0 1.1 1.2 2.0
19.5 22.9 5.1 7.6 3.5 6.7 8.1 11.3
1.0% 2.0% 2.2% 1.1% 1.4% 1.8% 1.9% 2.6%
2.80 0.65 0.85 0.43 2.90
Source: J.P. Morgan estimates, Company data, Bloomberg, Bloomberg consensus for stocks Not Covered (NC).
Table 3: Supply chain regional peer comparison As at: 08 May-14 Archer-Daniels-Midland Bunge China Agri-Industries Conagra Foods Inc Noble Group Olam International Wilmar International Weighted average
Ticker
Ctry
ADM US BG US 606 HK CAG US NOBL SP OLAM SP WIL SP
USA USA HKG USA HKG SGP SGP
Mkt cap (US$mn) 28,973 11,350 2,066 12,984 6,649 4,302 17,139 83,463
Price (LC) 44.27 77.10 3.05 30.83 1.25 2.23 3.34
Rating N OW OW N NR OW UW
Target (LC) 39.00 87.00 5.40 23.00 1.15 2.00 2.90
P/E CY14E CY15E 14.5 13.1 12.5 10.6 9.3 8.2 13.5 12.7 13.0 11.4 13.8 12.4 16.5 14.0 14.2 12.6
Source: J.P. Morgan estimates, Company data, Bloomberg, Bloomberg consensus for stocks Not Covered (NC).
8
ROE CY14E CY15E 9.3 9.6 8.7 9.7 6.2 6.7 16.8 NA 9.6 10.1 11.3 7.9 6.7 7.4 11.7 9.0
Div Yld CY14E CY15E 2.0% 2.1% 1.5% 1.6% 2.7% 3.0% 3.3% 3.3% 1.9% 2.2% 1.9% 2.1% 1.8% 2.1% 2.1% 2.3%
P/B FY14E FY15E 1.4 1.3 1.0 0.9 0.6 0.5 2.2 2.0 1.2 1.1 1.6 1.4 1.1 1.0 1.4 1.3
Ying-Jian Chan, CFA (65) 6882-2378 [email protected]
Asia Pacific Equity Research 08 May 2014
Investment Thesis, Valuation and Risks Wilmar International Limited (Underweight; Price Target: S$2.90) Investment Thesis The key drivers of our Underweight recommendation on Wilmar are: Oilseeds margins remain volatile in China: Oilseeds crushing margins in China are expected to remain volatile and could potentially be loss making in 1H2014. Palm refining margin may see gradual deterioration: Refining capacity in Indonesia is expected to increase c.50% to 45 million MT resulting in overcapacity and potential margin erosion. Valuation Our valuation and Dec-14 price target of S$2.90 for Wilmar is based on sum-of-theparts valuation: Palm & laurics Oilseeds & grains Consumer products Plantation and palm oil mills Sugar Associates Fair value of Wilmar International (US$) Fair value of Wilmar International (S$) Price target (S$)
Valuation 12.0x P/E 1x P/B 13.0x P/E 12.0x P/E 10.0x P/E 10.0x P/E
Per share (S$) 1.02 0.27 0.39 0.37 0.17 0.09 2.31 2.90 2.90
Source: J.P. Morgan estimates
Risks to Rating and Price Target Key upside risks to our price target include: (1) correction in soybean price providing relief to crush margin, and (2) ability to increase cooking oil price and pass on cost increase to consumers.
9
Asia Pacific Equity Research 08 May 2014
Ying-Jian Chan, CFA (65) 6882-2378 [email protected]
JPM Q-Profile Wilmar International Limited (SINGAPORE / Consumer Staples) As Of: 01-May-2014
[email protected]
Local Share Price
Current:
3.40
12 Mth Forward EPS
8.00
0.45
7.00
0.40
6.00
0.35
5.00
0.30
4.00
0.25
Current:
0.23
0.20
3.00
0.15
2.00
0.10
1.00
0.05
Earnings Yield (& local bond Yield) 12%
12Mth fwd EY
9%
Implied Value Of Growth*
Current:
Oct/13
May/14
Mar/13
Jan/12
Aug/12
Jun/11
Apr/10
Nov/10
Sep/09
Jul/08
Feb/09
Dec/07
Oct/06
May/07
Mar/06
Jan/05
Aug/05
Jun/04
Apr/03
Nov/03
Sep/02
Jul/01
Feb/02
Dec/00
Oct/99
May/00
0.00 Mar/99
Oct/13
Current:
Singapore BY
May/14
Mar/13
Jan/12
Aug/12
Jun/11
Apr/10
Nov/10
Sep/09
Jul/08
Feb/09
Dec/07
Oct/06
May/07
Mar/06
Jan/05
Aug/05
Jun/04
Apr/03
Nov/03
Sep/02
Jul/01
Feb/02
Dec/00
Oct/99
May/00
Mar/99
0.00
-28.95%
0.80
Proxy
0.60
10%
0.40
8%
0.20
6%
0.00 4% -0.20 2%
-0.40
Current:
8.99
50.00
1.2x
Dividend Yield (Trailing)
Current:
May/14
Oct/13
Mar/13
Aug/12
Jan/12
Jun/11
Nov/10
Apr/10
Sep/09
Feb/09
Jul/08
Dec/07
May/07
PBV Forward
Oct/06
Mar/06
Aug/05
May/14
Oct/13
Mar/13
Jan/12
Aug/12
Jun/11
Apr/10
Nov/10
Sep/09
Jul/08
Feb/09
Dec/07
Oct/06
May/07
Mar/06
Aug/05
Jun/04
Nov/03
Apr/03
Sep/02
Feb/02
Jul/01
Dec/00
May/00
Jan/05 Jan/05
Mar/99
May/14
Oct/13
Mar/13
Aug/12
Jan/12
Jun/11
Nov/10
Apr/10
Sep/09
Feb/09
Jul/08
Dec/07
May/07
Oct/06
Mar/06
Aug/05
Jan/05
Jun/04
Nov/03
Apr/03
Sep/02
Feb/02
Jul/01
Dec/00
May/00
Oct/99
-2.0x
Mar/99
0.0x
0.0x
Jun/04
2.0x
5.0x
Nov/03
4.0x
10.0x
Apr/03
6.0x
15.0x
Sep/02
8.0x
20.0x
Feb/02
10.0x
25.0x
Jul/01
30.0x
Current: PBV hist
Dec/00
12.0x
ROE (Trailing)
Oct/99
Price/Book Value
35.0x
May/00
11.6x
Mar/99
May/14
Oct/13
Mar/13
Aug/12
Jan/12
Current:
-0.60
Oct/99
PE (1Yr Forward)
Jun/11
Nov/10
Apr/10
Sep/09
Feb/09
Jul/08
Dec/07
May/07
Oct/06
Mar/06
Aug/05
Jan/05
Jun/04
Nov/03
Apr/03
Sep/02
Feb/02
Jul/01
Dec/00
May/00
Oct/99
Mar/99
0%
2.29
3.0
40.00
2.5
30.00 20.00
2.0
10.00 1.5
0.00 -10.00
1.0
-20.00 -30.00
0.5
-40.00 Oct/13
May/14
Mar/13
Jan/12
Aug/12
Jun/11
Apr/10
Nov/10
Sep/09
Jul/08
Feb/09
Dec/07
May/07
Oct/06
Mar/06
Aug/05
Jan/05
Jun/04
Nov/03
Apr/03
Sep/02
Feb/02
Jul/01
Dec/00
May/00
Oct/99
May/14
Oct/13
Mar/13
Aug/12
Jan/12
Jun/11
Nov/10
Apr/10
Sep/09
Feb/09
Jul/08
Dec/07
May/07
Oct/06
Mar/06
Aug/05
Jan/05
Jun/04
Nov/03
Apr/03
Sep/02
Feb/02
Jul/01
Dec/00
May/00
Oct/99
Mar/99
Mar/99
0.0
-50.00
Summary Wilmar International Limited SINGAPORE Consumer Staples 12mth Forward PE P/BV (Trailing) Dividend Yield (Trailing) ROE (Trailing) Implied Value of Growth
17329.24 18.80541 SEDOL B17KC69 Food Products Latest Min 9.25 11.57x 0.53 1.16x 0.00 2.29 -37.48 8.99 -0.45 -29.0%
Max 28.80 9.66 2.78 42.42 0.58
Source: Bloomberg, Reuters Global Fundamentals, IBES CONSENSUS, J.P. Morgan Calcs
10
Median 14.82 1.36 0.55 11.62 0.11
Average 15.74 2.10 0.79 9.25 0.10
2 S.D.+ 24.79 5.56 2.42 47.71 0.62
2 S.D. 6.69 -1.36 -0.85 -29.22 -0.43
% to Min -20% -54% -100% -517% -54%
As Of: Local Price: EPS: % to Max % to Med 149% 28% 737% 18% 21% -76% 372% 29% 299% 139%
* Implied Value Of Growth = (1 - EY/Cost of equity) where cost of equity =Bond Yield + 5.0% (ERP)
1-May-14 3.40 0.23 % to Avg 36% 82% -66% 3% 133%
Ying-Jian Chan, CFA (65) 6882-2378 [email protected]
Asia Pacific Equity Research 08 May 2014
Wilmar International Limited: Summary of Financials Income Statement $ in millions, year end Dec Revenues % change Y/Y EBITDA % change Y/Y EBITDA Margin EBIT % change Y/Y EBIT Margin Net Interest Earnings before tax % change Y/Y Tax as % of EBT Minority Interest Net income (reported) % change Y/Y Net Profit (Recurring) Shares outstanding EPS (reported) Balance sheet $ in millions, year end Dec Cash Accounts receivable Inventories Others Current assets LT investments Net fixed assets Total Assets
FY12 FY13 FY14E 45,463 44,085 47,873 1.7% (3.0%) 8.6% 2,188 2,316 2,356 (17.9%) 5.9% 1.7% 4.8% 5.3% 4.9% 1,645 1,659 1,612 (24.7%) 0.9% (2.8%) 3.6% 3.8% 3.4% (178) (18) (263) 1,655 1,775 1,422 (20.4%) 7.3% (19.9%) (334) (385) (327) 20.2% 21.7% 23.0% (65) (72) (57) 1,255 1,319 1,038 (21.6%) 5.1% (21.3%) 1,167 1,303 1,038 6,403 6,399 6,399 0.20 0.21 0.16
FY12 FY13 8,562 11,735 3,953 4,085 7,137 7,221 4,167 4,800 23,819 27,842 422 417 8,924 9,337 41,920 46,632
FY14E 11,910 3,751 7,779 4,800 28,240 417 10,455 48,148
Short-term loans 17,740 19,392 Payables 1,580 1,403 Others 2,093 2,397 Total current liabilities 21,413 23,191 Long-term debt 4,505 6,804 Other liabilities 807 750 Total Liabilities 26,725 30,745 Shareholder's equity 14,346 15,005 Total Liabilities & equity 41,920 46,632 BVPS ($) 2.24 2.34 Source: Company reports and J.P. Morgan estimates.
19,392 1,831 2,397 23,619 6,804 750 31,173 16,093 48,148 2.51
Cash flow statement FY15E FY16E $ in millions, year end Dec 50,347 53,702 Profit before tax 5.2% 6.7% Depr. & amortization 2,693 2,898 Change in working capital 14.3% 7.6% Other non-cash items 5.3% 5.4% Cash flow from operations 1,862 1,980 15.5% 6.3% Capex 3.7% 3.7% Disposal/(purchase) (256) (268) Cash flow from investing 1,682 1,793 18.3% 6.6% Equity raised/(repaid) (387) (412) Debt raised/(repaid) 23.0% 23.0% Other (67) (71) Dividends paid 1,228 1,309 Cash flow from financing 18.3% 6.6% Net change in cash 1,228 1,309 Beginning cash 6,399 6,399 Ending cash 0.19 0.20 Free cash flow DPS Ratio Analysis FY15E FY16E $ in millions, year end Dec 11,599 11,254 EBITDA margin 3,945 4,207 Operating margin 8,181 8,726 Net profit margin 4,800 4,800 SG&A/Sales 28,525 28,988 417 417 Sales growth 11,124 11,706 EBIT growth 49,102 50,147 Net profit growth EPS growth 19,392 19,392 1,926 2,054 Interest coverage (x) 2,397 2,397 Net debt to equity 23,714 23,842 6,804 6,804 Sales/assets 750 750 Assets/equity 31,267 31,396 ROE 16,953 17,869 ROCE 49,102 50,147 2.65 2.79
FY12 1,655 543 (581) 113 1,068
FY13 1,775 657 (288) (53) 1,614
FY14E 1,422 744 203 206 1,986
FY15E 1,682 831 (501) 189 1,558
FY16E 1,793 918 (680) 197 1,547
(1,735) (1,376) 37 61 (1,858) (1,432)
(1,500) (1,500) (1,500) 0 0 0 (1,500) (1,500) (1,500)
3 6 8,079 2,189 (6,780) (1,387) (263) (281) 1,039 527 249 709 7,898 8,562 8,562 11,735 (668) 237 0.04 0.06
0 0 0 (311) (311) 174 11,735 11,910 486 0.05
0 0 0 (368) (368) (310) 11,910 11,599 58 0.06
0 0 0 (393) (393) (345) 11,599 11,254 47 0.06
FY14E 4.9% 3.4% 2.2% 5.1%
FY15E 5.3% 3.7% 2.4% 5.3%
FY16E 5.4% 3.7% 2.4% 5.5%
(3.0%) 8.6% 0.9% (2.8%) 5.1% (21.3%) 5.1% (21.3%)
5.2% 15.5% 18.3% 18.3%
6.7% 6.3% 6.6% 6.6%
126.0 91.0%
10.5 81.8%
10.8 79.7%
FY12 4.8% 3.6% 2.6% 5.2% 1.7% (24.7%) (21.6%) (21.6%) 12.3 90.0%
FY13 5.3% 3.8% 3.0% 5.2%
9.0 84.2%
1.1 1.0 1.0 1.0 1.1 294.3% 301.7% 304.8% 294.3% 285.0% 8.4% 8.9% 6.7% 7.4% 7.5% 3.7% 3.3% 3.0% 3.4% 3.5%
11
Ying-Jian Chan, CFA (65) 6882-2378 [email protected]
Asia Pacific Equity Research 08 May 2014
Analyst Certification: The research analyst(s) denoted by an “AC” on the cover of this report certifies (or, where multiple research analysts are primarily responsible for this report, the research analyst denoted by an “AC” on the cover or within the document individually certifies, with respect to each security or issuer that the research analyst covers in this research) that: (1) all of the views expressed in this report accurately reflect his or her personal views about any and all of the subject securities or issuers; and (2) no part of any of the research analyst's compensation was, is, or will be directly or indirectly related to the specific recommendations or views expressed by the research analyst(s) in this report. For all Korea-based research analysts listed on the front cover, they also certify, as per KOFIA requirements, that their analysis was made in good faith and that the views reflect their own opinion, without undue influence or intervention.
Important Disclosures
Lead or Co-manager: J.P. Morgan acted as lead or co-manager in a public offering of equity and/or debt securities for Wilmar International Limited within the past 12 months.
Analyst Position: The following analysts (and/or their associates or household members) own a long position in the shares of Wilmar International Limited: Ying-Jian Chan.
Client: J.P. Morgan currently has, or had within the past 12 months, the following company(ies) as clients: Wilmar International Limited.
Client/Investment Banking: J.P. Morgan currently has, or had within the past 12 months, the following company(ies) as investment banking clients: Wilmar International Limited.
Client/Non-Investment Banking, Securities-Related: J.P. Morgan currently has, or had within the past 12 months, the following company(ies) as clients, and the services provided were non-investment-banking, securities-related: Wilmar International Limited.
Client/Non-Securities-Related: J.P. Morgan currently has, or had within the past 12 months, the following company(ies) as clients, and the services provided were non-securities-related: Wilmar International Limited.
Investment Banking (past 12 months): J.P. Morgan received in the past 12 months compensation from investment banking Wilmar International Limited.
Investment Banking (next 3 months): J.P. Morgan expects to receive, or intends to seek, compensation for investment banking services in the next three months from Wilmar International Limited.
Non-Investment Banking Compensation: J.P. Morgan has received compensation in the past 12 months for products or services other than investment banking from Wilmar International Limited. Company-Specific Disclosures: Important disclosures, including price charts, are available for compendium reports and all J.P. Morgan– covered companies by visiting https://jpmm.com/research/disclosures, calling 1-800-477-0406, or e-mailing [email protected] with your request. J.P. Morgan’s Strategy, Technical, and Quantitative Research teams may screen companies not covered by J.P. Morgan. For important disclosures for these companies, please call 1-800-477-0406 or e-mail [email protected].
12
Ying-Jian Chan, CFA (65) 6882-2378 [email protected]
Asia Pacific Equity Research 08 May 2014
Rating Share Price Price Target (S$) (S$)
22-Jun-09
OW
4.88
5.80
14-Aug-09 OW
6.58
6.80
25-Sep-09 N
6.99
6.80
12-Nov-09 N
6.60
6.60
11-Jan-10
N
7.11
6.80
9
25-Jan-10
OW
6.69
9.00
8
13-Aug-10 OW
6.13
8.20
7
06-Oct-10
OW
5.91
7.80
6
10-Nov-10 OW
6.88
7.20
03-Jan-11
5.63
4.60
04-Mar-11 N
5.19
5.40
18-Jul-11
OW
5.65
6.50
16-Feb-12 OW
5.99
6.80
2
22-Feb-12 OW
5.86
6.00
1
10-May-12 OW
4.27
5.20
0
28-May-12 N
3.76
4.30
30-Jul-12
N
3.28
2.80
01-Nov-12 N
3.09
3.30
08-Jan-13
OW
3.49
4.20
06-Aug-13 OW
3.15
4.05
08-Oct-13
OW
3.20
4.10
28-Apr-14
UW
3.51
3.00
Wilmar International Limited (WLIL.SI, WIL SP) Price Chart 12 N S$6.8 OW S$9 OW S$7.2
11 10
Price(S$)
Date
OW S$6.8 N S$6.8 OW S$7.8 N S$5.4
OW S$5.2 N S$3.3
OW S$6 N S$2.8
OW S$4.1
OW S$5.8 N S$6.6 OW S$8.2 UW S$4.6 OW S$6.5 OW S$6.8 N S$4.3OW S$4.2 OW S$4.05UW S$3
5 4 3
Sep 06
Mar 08
Sep 09
Mar 11
Source: Bloomberg and J.P. Morgan; price data adjusted for stock splits and dividends. Initiated coverage Jun 22, 2009.
Sep 12
Mar 14
UW
The chart(s) show J.P. Morgan's continuing coverage of the stocks; the current analysts may or may not have covered it over the entire period. J.P. Morgan ratings or designations: OW = Overweight, N= Neutral, UW = Underweight, NR = Not Rated Explanation of Equity Research Ratings, Designations and Analyst(s) Coverage Universe: J.P. Morgan uses the following rating system: Overweight [Over the next six to twelve months, we expect this stock will outperform the average total return of the stocks in the analyst’s (or the analyst’s team’s) coverage universe.] Neutral [Over the next six to twelve months, we expect this stock will perform in line with the average total return of the stocks in the analyst’s (or the analyst’s team’s) coverage universe.] Underweight [Over the next six to twelve months, we expect this stock will underperform the average total return of the stocks in the analyst’s (or the analyst’s team’s) coverage universe.] Not Rated (NR): J.P. Morgan has removed the rating and, if applicable, the price target, for this stock because of either a lack of a sufficient fundamental basis or for legal, regulatory or policy reasons. The previous rating and, if applicable, the price target, no longer should be relied upon. An NR designation is not a recommendation or a rating. In our Asia (ex-Australia) and U.K. small- and mid-cap equity research, each stock’s expected total return is compared to the expected total return of a benchmark country market index, not to those analysts’ coverage universe. If it does not appear in the Important Disclosures section of this report, the certifying analyst’s coverage universe can be found on J.P. Morgan’s research website, www.jpmorganmarkets.com. Coverage Universe: Chan, Ying-Jian: Astra Agro Lestari (AALI.JK), BW Plantation (BWPT.JK), British American Tobacco (M) Bhd (BATO.KL), China Agri-Industries (0606.HK), D&L Industries (DNL.PS), Emperador Inc. (EMP.PS), Felda Global Ventures (FGVH.KL), First Resources Limited (FRLD.SI), Genting Plantations (GENP.KL), Golden Agri-Resources Ltd (GAGR.SI), IOI Corp. (IOIB.KL), Indofood (INDF.JK), Indofood Agri Resources Ltd (IFAR.SI), Indofood CBP (ICBP.JK), Kuala Lumpur Kepong (KLKK.KL), London Sumatra Indonesia (LSIP.JK), Mewah International Inc (MEWI.SI), Noble Group Ltd (NOBG.SI), Olam International Limited (OLAM.SI), Salim Ivomas Pratama (SIMP.JK), Sime Darby Berhad (SIME.KL), Thai Beverage Public Company Ltd. (TBEV.SI), Universal Robina Corp (URC.PS), Wilmar International Limited (WLIL.SI)
13
Ying-Jian Chan, CFA (65) 6882-2378 [email protected]
Asia Pacific Equity Research 08 May 2014
J.P. Morgan Equity Research Ratings Distribution, as of March 31, 2014 J.P. Morgan Global Equity Research Coverage IB clients* JPMS Equity Research Coverage IB clients*
Overweight (buy) 44% 58% 45% 78%
Neutral (hold) 44% 49% 48% 67%
Underweight (sell) 11% 40% 7% 60%
*Percentage of investment banking clients in each rating category. For purposes only of FINRA/NYSE ratings distribution rules, our Overweight rating falls into a buy rating category; our Neutral rating falls into a hold rating category; and our Underweight rating falls into a sell rating category. Please note that stocks with an NR designation are not included in the table above.
Equity Valuation and Risks: For valuation methodology and risks associated with covered companies or price targets for covered companies, please see the most recent company-specific research report at http://www.jpmorganmarkets.com, contact the primary analyst or your J.P. Morgan representative, or email [email protected]. Equity Analysts' Compensation: The equity research analysts responsible for the preparation of this report receive compensation based upon various factors, including the quality and accuracy of research, client feedback, competitive factors, and overall firm revenues. Registration of non-US Analysts: Unless otherwise noted, the non-US analysts listed on the front of this report are employees of non-US affiliates of JPMS, are not registered/qualified as research analysts under NASD/NYSE rules, may not be associated persons of JPMS, and may not be subject to FINRA Rule 2711 and NYSE Rule 472 restrictions on communications with covered companies, public appearances, and trading securities held by a research analyst account.
Other Disclosures J.P. Morgan ("JPM") is the global brand name for J.P. Morgan Securities LLC ("JPMS") and its affiliates worldwide. J.P. Morgan Cazenove is a marketing name for the U.K. investment banking businesses and EMEA cash equities and equity research businesses of JPMorgan Chase & Co. and its subsidiaries. All research reports made available to clients are simultaneously available on our client website, J.P. Morgan Markets. Not all research content is redistributed, e-mailed or made available to third-party aggregators. For all research reports available on a particular stock, please contact your sales representative. Options related research: If the information contained herein regards options related research, such information is available only to persons who have received the proper option risk disclosure documents. For a copy of the Option Clearing Corporation's Characteristics and Risks of Standardized Options, please contact your J.P. Morgan Representative or visit the OCC's website at http://www.optionsclearing.com/publications/risks/riskstoc.pdf Legal Entities Disclosures U.S.: JPMS is a member of NYSE, FINRA, SIPC and the NFA. JPMorgan Chase Bank, N.A. is a member of FDIC. U.K.: JPMorgan Chase N.A., London Branch, is authorised by the Prudential Regulation Authority and is subject to regulation by the Financial Conduct Authority and to limited regulation by the Prudential Regulation Authority. Details about the extent of our regulation by the Prudential Regulation Authority are available from J.P. Morgan on request. J.P. Morgan Securities plc (JPMS plc) is a member of the London Stock Exchange and is authorised by the Prudential Regulation Authority and regulated by the Financial Conduct Authority and the Prudential Regulation Authority. Registered in England & Wales No. 2711006. Registered Office 25 Bank Street, London, E14 5JP. South Africa: J.P. Morgan Equities South Africa Proprietary Limited is a member of the Johannesburg Securities Exchange and is regulated by the Financial Services Board. Hong Kong: J.P. Morgan Securities (Asia Pacific) Limited (CE number AAJ321) is regulated by the Hong Kong Monetary Authority and the Securities and Futures Commission in Hong Kong and/or J.P. Morgan Broking (Hong Kong) Limited (CE number AAB027) is regulated by the Securities and Futures Commission in Hong Kong. Korea: J.P. Morgan Securities (Far East) Ltd, Seoul Branch, is regulated by the Korea Financial Supervisory Service. Australia: J.P. Morgan Australia Limited (JPMAL) (ABN 52 002 888 011/AFS Licence No: 238188) is regulated by ASIC and J.P. Morgan Securities Australia Limited (JPMSAL) (ABN 61 003 245 234/AFS Licence No: 238066) is regulated by ASIC and is a Market, Clearing and Settlement Participant of ASX Limited and CHI-X. Taiwan: J.P.Morgan Securities (Taiwan) Limited is a participant of the Taiwan Stock Exchange (company-type) and regulated by the Taiwan Securities and Futures Bureau. India: J.P. Morgan India Private Limited, having its registered office at J.P. Morgan Tower, Off. C.S.T. Road, Kalina, Santacruz East, Mumbai - 400098, is a member of the National Stock Exchange of India Limited (SEBI Registration Number - INB 230675231/INF 230675231/INE 230675231) and Bombay Stock Exchange Limited (SEBI Registration Number - INB 010675237/INF 010675237) and is regulated by Securities and Exchange Board of India. For non local research reports, this material is not distributed in India by J.P. Morgan India Private Limited. Thailand: This material is issued and distributed in Thailand by JPMorgan Securities (Thailand) Ltd., which is a member of the Stock Exchange of Thailand and is regulated by the Ministry of Finance and the Securities and Exchange Commission and its registered address is 3rd Floor, 20 North Sathorn Road, Silom, Bangrak, Bangkok 10500. Indonesia: PT J.P. Morgan Securities Indonesia is a member of the Indonesia Stock Exchange and is regulated by the OJK a.k.a. BAPEPAM LK. Philippines: J.P. Morgan Securities Philippines Inc. is a Trading Participant of the Philippine Stock Exchange and a member of the Securities Clearing Corporation of the Philippines and the Securities Investor Protection Fund. It is regulated by the Securities and Exchange Commission. Brazil: Banco J.P. Morgan S.A. is regulated by the Comissao de Valores Mobiliarios (CVM) and by the Central Bank of Brazil. Mexico: J.P. Morgan Casa de Bolsa, S.A. de C.V., J.P. Morgan Grupo Financiero is a member of the Mexican Stock Exchange and authorized to act as a broker dealer by the National Banking and Securities Exchange Commission. Singapore: This material is issued and distributed in Singapore by or through J.P. Morgan Securities Singapore Private Limited (JPMSS) [MCI (P) 199/03/2014 and Co. Reg. No.: 199405335R] which is a member of the Singapore Exchange Securities Trading Limited and is regulated by the Monetary Authority of Singapore (MAS) and/or JPMorgan Chase Bank, N.A., Singapore branch (JPMCB Singapore) which is regulated by the MAS. This material is provided in Singapore only to accredited investors, expert investors and institutional investors, as defined in Section 4A of the Securities and 14
Ying-Jian Chan, CFA (65) 6882-2378 [email protected]
Asia Pacific Equity Research 08 May 2014
Futures Act, Cap. 289. Recipients of this document are to contact JPMSS or JPMCB Singapore in respect of any matters arising from, or in connection with, the document. Japan: JPMorgan Securities Japan Co., Ltd. is regulated by the Financial Services Agency in Japan. Malaysia: This material is issued and distributed in Malaysia by JPMorgan Securities (Malaysia) Sdn Bhd (18146-X) which is a Participating Organization of Bursa Malaysia Berhad and a holder of Capital Markets Services License issued by the Securities Commission in Malaysia. Pakistan: J. P. Morgan Pakistan Broking (Pvt.) Ltd is a member of the Karachi Stock Exchange and regulated by the Securities and Exchange Commission of Pakistan. Saudi Arabia: J.P. Morgan Saudi Arabia Ltd. is authorized by the Capital Market Authority of the Kingdom of Saudi Arabia (CMA) to carry out dealing as an agent, arranging, advising and custody, with respect to securities business under licence number 35-07079 and its registered address is at 8th Floor, Al-Faisaliyah Tower, King Fahad Road, P.O. Box 51907, Riyadh 11553, Kingdom of Saudi Arabia. Dubai: JPMorgan Chase Bank, N.A., Dubai Branch is regulated by the Dubai Financial Services Authority (DFSA) and its registered address is Dubai International Financial Centre - Building 3, Level 7, PO Box 506551, Dubai, UAE. Country and Region Specific Disclosures U.K. and European Economic Area (EEA): Unless specified to the contrary, issued and approved for distribution in the U.K. and the EEA by JPMS plc. Investment research issued by JPMS plc has been prepared in accordance with JPMS plc's policies for managing conflicts of interest arising as a result of publication and distribution of investment research. Many European regulators require a firm to establish, implement and maintain such a policy. This report has been issued in the U.K. only to persons of a kind described in Article 19 (5), 38, 47 and 49 of the Financial Services and Markets Act 2000 (Financial Promotion) Order 2005 (all such persons being referred to as "relevant persons"). This document must not be acted on or relied on by persons who are not relevant persons. Any investment or investment activity to which this document relates is only available to relevant persons and will be engaged in only with relevant persons. In other EEA countries, the report has been issued to persons regarded as professional investors (or equivalent) in their home jurisdiction. Australia: This material is issued and distributed by JPMSAL in Australia to "wholesale clients" only. This material does not take into account the specific investment objectives, financial situation or particular needs of the recipient. The recipient of this material must not distribute it to any third party or outside Australia without the prior written consent of JPMSAL. For the purposes of this paragraph the term "wholesale client" has the meaning given in section 761G of the Corporations Act 2001. Germany: This material is distributed in Germany by J.P. Morgan Securities plc, Frankfurt Branch and J.P.Morgan Chase Bank, N.A., Frankfurt Branch which are regulated by the Bundesanstalt für Finanzdienstleistungsaufsicht. Hong Kong: The 1% ownership disclosure as of the previous month end satisfies the requirements under Paragraph 16.5(a) of the Hong Kong Code of Conduct for Persons Licensed by or Registered with the Securities and Futures Commission. (For research published within the first ten days of the month, the disclosure may be based on the month end data from two months prior.) J.P. Morgan Broking (Hong Kong) Limited is the liquidity provider/market maker for derivative warrants, callable bull bear contracts and stock options listed on the Stock Exchange of Hong Kong Limited. An updated list can be found on HKEx website: http://www.hkex.com.hk. Japan: There is a risk that a loss may occur due to a change in the price of the shares in the case of share trading, and that a loss may occur due to the exchange rate in the case of foreign share trading. In the case of share trading, JPMorgan Securities Japan Co., Ltd., will be receiving a brokerage fee and consumption tax (shouhizei) calculated by multiplying the executed price by the commission rate which was individually agreed between JPMorgan Securities Japan Co., Ltd., and the customer in advance. Financial Instruments Firms: JPMorgan Securities Japan Co., Ltd., Kanto Local Finance Bureau (kinsho) No. 82 Participating Association / Japan Securities Dealers Association, The Financial Futures Association of Japan, Type II Financial Instruments Firms Association and Japan Investment Advisers Association. Korea: This report may have been edited or contributed to from time to time by affiliates of J.P. Morgan Securities (Far East) Ltd, Seoul Branch. Singapore: JPMSS and/or its affiliates may have a holding in any of the securities discussed in this report; for securities where the holding is 1% or greater, the specific holding is disclosed in the Important Disclosures section above. India: For private circulation only, not for sale. Pakistan: For private circulation only, not for sale. New Zealand: This material is issued and distributed by JPMSAL in New Zealand only to persons whose principal business is the investment of money or who, in the course of and for the purposes of their business, habitually invest money. JPMSAL does not issue or distribute this material to members of "the public" as determined in accordance with section 3 of the Securities Act 1978. The recipient of this material must not distribute it to any third party or outside New Zealand without the prior written consent of JPMSAL. Canada: The information contained herein is not, and under no circumstances is to be construed as, a prospectus, an advertisement, a public offering, an offer to sell securities described herein, or solicitation of an offer to buy securities described herein, in Canada or any province or territory thereof. Any offer or sale of the securities described herein in Canada will be made only under an exemption from the requirements to file a prospectus with the relevant Canadian securities regulators and only by a dealer properly registered under applicable securities laws or, alternatively, pursuant to an exemption from the dealer registration requirement in the relevant province or territory of Canada in which such offer or sale is made. The information contained herein is under no circumstances to be construed as investment advice in any province or territory of Canada and is not tailored to the needs of the recipient. To the extent that the information contained herein references securities of an issuer incorporated, formed or created under the laws of Canada or a province or territory of Canada, any trades in such securities must be conducted through a dealer registered in Canada. No securities commission or similar regulatory authority in Canada has reviewed or in any way passed judgment upon these materials, the information contained herein or the merits of the securities described herein, and any representation to the contrary is an offence. Dubai: This report has been issued to persons regarded as professional clients as defined under the DFSA rules. Brazil: Ombudsman J.P. Morgan: 0800-7700847 / [email protected]. General: Additional information is available upon request. Information has been obtained from sources believed to be reliable but JPMorgan Chase & Co. or its affiliates and/or subsidiaries (collectively J.P. Morgan) do not warrant its completeness or accuracy except with respect to any disclosures relative to JPMS and/or its affiliates and the analyst's involvement with the issuer that is the subject of the research. All pricing is as of the close of market for the securities discussed, unless otherwise stated. Opinions and estimates constitute our judgment as of the date of this material and are subject to change without notice. Past performance is not indicative of future results. This material is not intended as an offer or solicitation for the purchase or sale of any financial instrument. The opinions and recommendations herein do not take into account individual client circumstances, objectives, or needs and are not intended as recommendations of particular securities, financial instruments or strategies to particular clients. The recipient of this report must make its own independent decisions regarding any securities or financial instruments mentioned herein. JPMS distributes in the U.S. research published by non-U.S. affiliates and accepts responsibility for its contents. Periodic updates may be provided on companies/industries based on company specific developments or announcements, market conditions or any other publicly available information. Clients should contact analysts and execute transactions through a J.P. Morgan subsidiary or affiliate in their home jurisdiction unless governing law permits otherwise. "Other Disclosures" last revised April 5, 2014.
Copyright 2014 JPMorgan Chase & Co. All rights reserved. This report or any portion hereof may not be reprinted, sold or redistributed without the written consent of J.P. Morgan. #$J&098$#*P
15
Ying-Jian Chan, CFA (65) 6882-2378 [email protected]
16
Asia Pacific Equity Research 08 May 2014