Risk Stratification for Primary Implantation of a Cardioverter-Defibrillator in Patients With Ischemic Left Ventricular Dysfunction Ilan Goldenberg, Anant K. Vyas, W. Jackson Hall, Arthur J. Moss, Hongyue Wang, Hua He, Wojciech Zareba, Scott McNitt, Mark L. Andrews, for the MADIT-II Investigators J. Am. Coll. Cardiol. 2008;51;288-296 doi:10.1016/j.jacc.2007.08.058
This information is current as of January 15, 2008
The online version of this article, along with updated information and services, is located on the World Wide Web at: http://content.onlinejacc.org/cgi/content/full/51/3/288
Downloaded from content.onlinejacc.org by Jose Rubio Campal on January 15, 2008
Journal of the American College of Cardiology © 2008 by the American College of Cardiology Foundation Published by Elsevier Inc.
Vol. 51, No. 3, 2008 ISSN 0735-1097/08/$34.00 doi:10.1016/j.jacc.2007.08.058
Risk Stratification for Primary Implantation of a Cardioverter-Defibrillator in Patients With Ischemic Left Ventricular Dysfunction Ilan Goldenberg, MD,* Anant K. Vyas, MD, MPH,† W. Jackson Hall, PHD,‡ Arthur J. Moss, MD,* Hongyue Wang, PHD,‡ Hua He, MA,‡ Wojciech Zareba, MD, PHD,* Scott McNitt, MS,* Mark L. Andrews, BBA,* for the MADIT-II Investigators Rochester and Buffalo, New York Objectives
The study was designed to develop a simple risk stratification score for primary therapy with an implantable cardioverter-defibrillator (ICD).
Background
Current guidelines recommend primary ICD therapy in patients with a low ejection fraction (EF). However, the benefit of the ICD in the low EF population may not be uniform.
Methods
Best-subset proportional-hazards regression analysis was used to develop a simple clinical risk score for the end point of all-cause mortality in patients allocated to the conventional therapy arm of MADIT (Multicenter Automatic Defibrillator Implantation Trial)-II after excluding a pre-specified subgroup of very high-risk (VHR) patients (defined by blood urea nitrogen [BUN] ⱖ50 mg/dl and/or serum creatinine ⱖ2.5 mg/dl). The benefit of the ICD was then assessed within risk score categories and separately in VHR patients.
Results
The selected risk score model comprised 5 clinical factors (New York Heart Association functional class ⬎II, age ⬎70 years, BUN ⬎26 mg/dl, QRS duration ⬎0.12 s, and atrial fibrillation). Crude mortality rates in the conventional group were 8% and 28% in patients with 0 and ⱖ1 risk factors, respectively, and 43% in VHR patients. Defibrillator therapy was associated with a 49% reduction in the risk of death (p ⬍ 0.001) among patients with ⱖ1 risk factors (n ⫽ 786), whereas no ICD benefit was identified in patients with 0 risk factors (n ⫽ 345; hazard ratio 0.96; p ⫽ 0.91) and in VHR patients (n ⫽ 60; hazard ratio 1.00; p ⬎ 0.99).
Conclusions
Our data suggest a U-shaped pattern for ICD efficacy in the low-EF population, with pronounced benefit in intermediate-risk patients and attenuated efficacy in lower- and higher-risk subsets. (J Am Coll Cardiol 2008; 51:288–96) © 2008 by the American College of Cardiology Foundation
Data from major randomized trials have shown that the implantable cardioverter-defibrillator (ICD) provides a meaningful and significant reduction in mortality in patients See page 297
with ischemic and nonischemic cardiomyopathy and an ejection fraction (EF) ⱕ30% to 35% as part of primary prevention strategy (1– 6). Consequently, current guidelines From the *Cardiology Unit of the Department of Medicine and the ‡Department of Biostatistics and Computational Biology, University of Rochester Medical Center, Rochester, New York; and the †Cardiovascular Division of the Department of Medicine, University of Buffalo, Buffalo, New York. The MADIT-II study was supported by a research grant from Guidant Corp., St. Paul, Minnesota, to the University of Rochester School of Medicine and Dentistry. Drs. Goldenberg, Vyas, and Hall contributed equally to original concept and to authorship of this investigation. Manuscript received May 31, 2007; revised manuscript received July 27, 2007, accepted August 20, 2007.
recommend primary ICD implantation in this relatively large population (7). However, the low-EF group has considerable risk heterogeneity, and multiple factors may interact with EF to influence the risk of arrhythmic mortality among patients with similar degrees of left ventricular dysfunction. To date, risk stratification studies have shown that individual risk markers, including QRS duration, advanced New York Heart Association (NYHA) functional class, inducibility with electrophysiological testing, or signal-averaged electrocardiography, have limited ability to identify patients who should receive an ICD for the primary prevention of sudden cardiac death (3,8 –10). It is possible that assessment of multiple risk factors can more clearly delineate risk groups in whom ICD efficacy may be different. Specifically, a lower-risk group may exist in the low-EF population in which relatively low mortality rates may preclude a meaningful ICD benefit within a reasonable time horizon. Conversely, among patients with major comorbidi-
Downloaded from content.onlinejacc.org by Jose Rubio Campal on January 15, 2008
Goldenberg et al. MADIT-II Risk Score
JACC Vol. 51, No. 3, 2008 January 22, 2008:288–96
ties and advanced cardiac disease, the short-term risk of nonarrhythmic mortality may predominate despite ICD therapy. We developed a simple clinical risk score based upon analysis of outcomes of patients allocated to the conventional therapy arm of MADIT (Multicenter Automatic Defibrillator Implantation Trial)-II after excluding a prespecified subgroup of very high-risk (VHR) patients with comorbidities and advanced cardiac disease. The survival benefit with an ICD was then evaluated in low- and higher-risk patients identified by the risk score and separately in patients with VHR. Methods Study population. The design and results of MADIT-II have been reported elsewhere (3). In brief, 1,232 patients with documented previous myocardial infarction (MI) and EF ⱕ30% were randomized to receive a prophylactic ICD or conventional medical therapy in a 3:2 ratio and were followed over a mean period of 20 months. Screened patients were excluded if they were in NYHA functional class IV at enrollment; had undergone coronary revascularization within the preceding 3 months; had MI within the past month; had advanced cerebrovascular disease; had blood urea nitrogen (BUN) ⬎70 mg/dl or creatinine ⬎3.0 mg/dl (these thresholds were recommended; however, a few exceptions occurred), or had any condition other than cardiac disease that was associated with a high likelihood of death during the trial. Risk groups and outcome measures. Outcome analyses were carried separately in a pre-specified VHR group (subsequently defined), and the risk score was developed and assessed in the remaining study population. VHR GROUP. We hypothesized that the clinical course of patients with left ventricular dysfunction who have additional major comorbidities is different from the remaining study population because of a greater short-term mortality risk in the former subgroup. Severe renal disease has been shown to be a marker of advanced cardiovascular disease and to be associated with high levels of mortality in patients with ischemic left ventricular dysfunction and heart failure (11– 13). Furthermore, data from MADIT-II have demonstrated severe renal dysfunction to be the most powerful predictor of all-cause mortality during the course of the trial (14). Consequently, the outcome of a relatively small subgroup of study patients (n ⫽ 60) (Tables 1 and 2) who had baseline laboratory data indicating advanced renal disease (pre-specfied as BUN ⱖ50 mg/dl and/or serum creatinine ⱖ2.5 mg/dl) was evaluated separately from the remaining study population.
The primary end point of the study was death from any cause. Analysis was performed according to the intention-to-treat principle. In a secondary analysis, we also evaluated the mode of death in risk score
OUTCOME MEASURES.
289
groups with the use of a modified Abbreviations Hinkle-Thaler system, as previand Acronyms ously described (15), and the freBUN ⴝ blood urea nitrogen quency of appropriate ICD therEF ⴝ ejection fraction apies by risk groups with the use ICD ⴝ implantable of interrogation data of imcardioverter-defibrillator planted patients, as described LBBB ⴝ left bundle branch previously (9). block Statistical analysis. V H R P A MI ⴝ myocardial infarction TIENTS. Characteristics in the 2 NYHA ⴝ New York Heart treatment groups within the Association VHR group were compared with VHR ⴝ very high risk the Wilcoxon rank sum, chisquare, or Fisher exact test, as appropriate. Kaplan-Meier estimates for survival in VHR patients by treatment group were determined and statistically evaluated with the log-rank test. The Cox proportional hazards regression model was used to evaluate the contribution of treatment assignment to the development of all-cause mortality. DEVELOPMENT AND EVALUATION OF RISK SCORE IN THE
Analyses were based on the 467 patients allocated to conventional medical therapy and 705 patients allocated to ICD therapy in MADIT-II not falling in the VHR group. We prespecified 17 potential clinical, electrocardiographic, and laboratory risk factors (Table 3, including first footnote) for the risk model. Thresholds for categorization of numerical variables into lower-risk and higher-risk subsets were prespecified with the use of clinical and laboratory accepted
MAIN STUDY POPULATION (NON-VHR PATIENTS).
Baseline Study Group)* Population, Versus Characteristics, Allby Other VeryStudy and High-Risk Mortality, (Non-VHR) Patients of Patients the(VHR Total Table 1
Baseline Characteristics, and Mortality, of the Total Study Population, by Very High-Risk Patients (VHR Group)* Versus All Other Study (Non-VHR) Patients VHR Patients (n ⴝ 60)
Non-VHR Patients (n ⴝ 1,172)
Characteristic BUN, mg/dl
58 (54, 66)
29 (26, 15)†
Creatinine, mg/dl
2.3 (2.6, 1.9)
1.1 (1.3, 0.96)†
Age, yrs
72 (77.5, 66)
65 (72, 57)†
Ejection fraction
20 (25, 17)
25 (28, 20)†
NYHA (% in I, II, III–IV)‡
23%, 23%, 53%
37%, 36%, 24%†
QRS duration, ms
130 (160, 100)
110 (140, 100)†
Atrial fibrillation, n (%)§
7 (12)
98 (8)
Female, n (%)
9 (15)
183 (16)
Diuretic therapy, n (%)
55 (92)
866 (74)†
Digitalis therapy, n (%)
36 (60)
685 (58)
29 (48)
183 (16)†
Mortality Crude rate, n (%) Adjusted rate, %¶
3.0%
0.7%†
*Defined as having BUN ⱖ50 mg/dl or serum creatinine ⱖ2.5 mg/dl; entries are presented as median (quartiles) or percentages. †All p values, for appropriate tests comparing VHR with non-VHR patients, are ⬍0.005 except for atrial fibrillation, female gender, and digitalis therapy, for which each p exceeds 0.35. ‡Values reflect the highest New York Heart Association (NYHA) functional class recorded in the 3-month period before enrollment. Eligibility was limited to patients who were in NYHA functional class I, II, or III at the time of enrollment. §Identified as baseline rhythm at enrollment. ¶Number of deaths per number of patient months at risk, in contrast to the crude rates in the previous line. BUN ⫽ blood urea nitrogen; VHR ⫽ very high risk.
Downloaded from content.onlinejacc.org by Jose Rubio Campal on January 15, 2008
Goldenberg et al. MADIT-II Risk Score
290
JACC Vol. 51, No. 3, 2008 January 22, 2008:288–96
Baseline of Very High-Risk Characteristics, Patients* and byMortality Treatment Arm Table 2
Baseline Characteristics, and Mortality of Very High-Risk Patients* by Treatment Arm Conventional Group (n ⴝ 23)
ICD Group (n ⴝ 37)
Characteristic BUN, mg/dl
59 (54, 66)
57 (54, 66)
Creatinine, mg/dl
2.2 (2.0, 2.6)
2.4 (1.8, 2.7)
Age, yrs
70 (65, 77)
73 (66, 78)
Ejection fraction
25 (20, 27)
20 (15, 25)
NYHA (% in I, II, III–IV)‡
22%, 22%, 57%
24%, 24%, 51%
QRS duration, ms
120 (100, 150)
140 (110, 170)
Atrial fibrillation, n (%)§
6 (26%)
1 (3%)†
Female, n (%)
4 (17)
5 (14)
Diuretic therapy, n (%)
22 (96)
33 (89)
Digitalis therapy, n (%)
13 (57)
23 (62)
10 (43)
19 (51)
Mortality Crude rate, n (%) Adjusted rate, %§
3.0%
2.9%
*Defined as having BUN ⱖ50 mg/dl or serum creatinine ⱖ2.5 mg/dl; data are presented as median (quartiles) or percentages. †For atrial fibrillation, p ⫽ 0.01 by Fisher exact test; for ejection fraction, p ⫽ 0.13 by Wilcoxon rank test; all other p values for appropriate tests exceed 0.20. ‡Values reflect the highest NYHA functional class recorded in the three-month period before enrollment. Eligibility was limited to patients who were in NYHA functional class I, II, or III at the time of enrollment. §Identified as baseline rhythm at enrollment. ¶Number of deaths per number of patient-months-at-risk, in contrast to the crude rates in the line above. ICD ⫽ implantable cardioverter-defibrillator; other abbreviations as in Table 1.
criteria. Univariate relationships between candidate risk factors and all-cause mortality in the conventional therapy group were assessed with Cox proportional hazards regression analysis. Risk factors with a hazard ratio ⬎1.3 and a p value ⬍0.20 were further evaluated by conducting out a best-subset proportional-hazards regression analysis in the conventional therapy group, using a penalty of 3.84 on the likelihood ratio chi-square value for each factor included (this methodology corresponds to stepwise regression with a
p value of 5%). Model selection was repeated after dropping unselected factors, one at a time, to minimize effects of missing data. After selection of risk factors, a simple risk score was constructed as a count of risk factors identified in each patient. Crude death rates across risk groups were compared by chi-square tests. Survival curves, by the Kaplan-Meier method, were constructed in various risk categories for conventional and for ICD patients, with p values by the log-rank test. Proportional-hazards regression analyses were conducted in the full non-VHR group, with the following covariates: risk score group (2 or 4 covariates), treatment arm (2 covariates), and their interactions (ICD effect in each risk score group). Checks were made for validity of the proportional-hazards assumption. SENSITIVITY AND CROSS-VALIDATION STUDIES. Sensitivity analyses were carried out by considering other choices of risk factors for the risk score. Cross-validation analyses were also conducted A more detailed description of these analyses is presented in the Online Appendix. Analyses were performed with the use of SAS software (version 9.1, SAS Institute, Cary, North Carolina) and Splus 7.0 (Insightful Corporation, Seattle, Washington).
Results VHR group. Sixty study patients (5%) met the criteria for this risk category and were evaluated separately from the main study population. In addition to markers of advanced renal dysfunction, patients with VHR were demonstrated to have a significantly greater proportion of high-risk clinical characteristics compared with non-VHR patients (Table 1), including an older age, a more advanced NYHA functional
Potential Baseline Categories and Associated VariablesRisk for Defining in the Conventional High- and Lower-Risk Therapy Group* Table 3
Potential Baseline Variables for Defining High- and Lower-Risk Categories and Associated Risk in the Conventional Therapy Group* High-Risk Category
Lower-Risk Category
Mortality Rate‡ Variable Atrial fibrillation储 BUN, mg/dl
Definition
n†
Crude, %
Yes
36
39
122
29
⬎26
Adjusted, %
High:Low§
Mortality‡ Definition
n†
Crude, %
2.06
No
426
19
Adjusted, % 0.89
2.39
HR
p Value 0.001
1.63
ⱕ26
338
18
0.79
2.12
⬍0.001
NYHA functional class
⬎II
117
31
1.55
ⱕII
342
17
0.77
2.02
0.001
Age, yrs
⬎70
143
27
1.46
ⱕ70
324
18
0.78
1.92
0.002 0.010
LBBB
Yes
75
31
1.62
No
361
19
0.87
1.87
QRS duration, ms
⬎120
152
27
1.43
ⱕ120
308
18
0.78
1.86
0.003
Creatinine, mg/dl
⬎1.3
129
27
1.46
ⱕ1.3
333
18
0.81
1.85
0.004
Ejection fraction, %
⬍20
96
30
1.35
ⱖ20
371
18
0.85
1.58
0.040
Heart rate, beats/min
ⱖ80
120
28
1.30
⬍80
346
18
0.84%
1.55
0.040
Prior 1-yr hospitalization#
⬎1
120
27
1.26
ⱕ1
306
17
0.82
1.55
0.051
Body mass index, kg/m2
⬍25
135
27
1.26
ⱖ25
331
18
0.83
1.51
0.050
176
25
1.20%
No
290
18
0.82
1.48
0.057
Diabetes mellitus
Yes
*Analysis was conducted in 467 patients after excluding 23 VHR patients (see Table 1) variables are listed in the order of decreasing hazard ratios; other variables considered were female gender, systolic blood pressure ⬍100 mm Hg, history of smoking, history of ventricular tachyarrhythmias, treated hypertension, but none of them had a hazard ratio ⬎1.30 nor a p value ⬍0.20. †n denotes the number of conventional group patients in respective risk category. For each variable, only patients with complete baseline data were included: for prior year hospitalizations and for LBBB, 41 (9%) and 31 (7%) patients, respectively, are omitted due to missing information; other variables had ⬍9 (2%) missing data. ‡Crude rates were calculated as number of deaths per number of patients; adjusted rates were calculated as number of deaths per patient months at risk (represents the estimated chance of dying within a month). §Results are from a single-variable proportional-hazards regression analysis for high-risk relative to lower-risk categories (ratio of the adjusted rates approximates the HRs). 储Defined in Table 1. #Denotes the number of hospitalizations for all causes during the year before enrollment. HR ⫽ hazard ratio; LBBB ⫽ left bundle branch block; other abbreviations as in Table 1.
Downloaded from content.onlinejacc.org by Jose Rubio Campal on January 15, 2008
Goldenberg et al. MADIT-II Risk Score
JACC Vol. 51, No. 3, 2008 January 22, 2008:288–96
class, a lower ejection fraction, a longer QRS duration on the baseline electrocardiogram, and a greater frequency of baseline medical therapy with diuretics. Forty-eight percent of the patients in the VHR group died during the course of the trial, whereas crude mortality rate in non-VHF patients was 16%. Clinical characteristics among VHR patients were similar in the ICD and conventional therapy groups, and adjusted mortality rates were virtually identical in the 2 treatment groups (Table 2). Accordingly, the survival curves for the ICD and conventional therapy groups were similar (Fig. 1), with an overall 2-year mortality of approximately 50% and with an ICD/conventional hazard ratio of 1.00 (95% confidence interval 0.5 to 2.2, p ⬎ 0.99) in this risk category. Risk score and outcome in the main study population (non-VHR patients). MODEL SELECTION. Analyses for the selection of the risk score model were based on the 467 patients allocated to the conventional therapy group in MADIT-II not falling in the VHR group. Of the 17 variables that were pre-specified as potential risk-stratifiers, 5 (female gender, a history of treated hypertension, previous documented ventricular tachyarrhythmias, systolic blood pressure ⬍100 mm Hg, and smoking at any time) had hazard ratios ⬍1.30 and p values exceeding 0.20 for allcause mortality and were therefore dropped from further consideration as candidates for risk stratification. The remaining 12 variables were considered extensively for the development of the risk score (Table 3). When considered alone, the first 7 (atrial fibrillation [defined as the baseline rhythm at enrollment], BUN ⬎26 mg/dl, NYHA functional class ⬎II [defined as the highest functional class recorded in the 3-month period before enrollment], age ⬎70 years, the presence of left bundle branch block [LBBB], a QRS duration ⬎0.12 s, and serum creatinine ⬎1.3 mg/dl) had hazard ratios for mortality in conventionally treated patients of 1.85 or greater and with p values
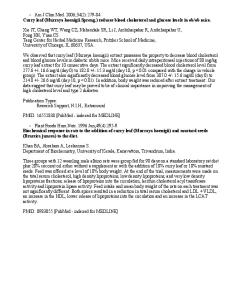
Figure 1
Probability of Survival in VHR Patients
Kaplan-Meier estimates of the probability of survival, by treatment group, in very high-risk (VHR) patients. CONV ⫽ conventional therapy group; ICD ⫽ implantable cardioverter-defibrillator.
291
⬍0.005 (except for LBBB, having smaller numbers because of missing data). The remaining 5 (EF ⬍20%, heart rate ⱖ80 beats/min, number of hospitalizations in the year before enrollment ⬎1, body mass index ⬍25 kg/m2, and a history of treated diabetes mellitus) had hazard ratios ranging from 1.58 down to 1.48, with p values ranging from 0.04 to 0.06. The best-subset proportional-hazards regression, using these 12 binary covariates, led to a model with the 5 risk factors: age, NYHA functional class, BUN, atrial fibrillation, and QRS duration (Table 4). Although high levels of creatinine and the presence of LBBB were found to be powerful univariate predictors of outcome, these 2 risk factors did not provide incremental prognostic information when elevated BUN and a wide QRS duration (⬎0.12 s), respectively, were allowed in the multivariate model. A simple risk score was constructed as a count of risk factors identified in each patient, among the selected 5 (age, NYHA functional class, BUN, atrial fibrillation, and QRS duration). Risk score counts were truncated at ⱖ3 because of small numbers of patients with counts of 4 or 5 risk factors. The counts of deaths and crude mortality in each of the various strata, by treatment arm, are presented in Table 5. Crude mortality was similar in the ICD and conventional therapy groups among patients in whom none of the 5 risk factors were present. The lower-risk group with 0 risk factors comprised almost one-third of the study population. By contrast, among patients with ⱖ1 risk score factors, crude mortality rates were lower in ICD patients than among patients in the conventional therapy group. Consistently, the 2-year Kaplan-Meier probabilities of death were relatively low, and virtually identical, in the ICD and conventional therapy groups among patients with 0 risk factors (9% and 8%, respectively) (Fig. 2A), whereas among patients with ⱖ1 risk factors, 2-year mortality rates were significantly lower in the ICD group (15%) as compared with the conventional therapy group (27%, p ⬍ 0.001) (Fig. 2B). Notably, the difference in mortality rates between the ICD and conventional therapy groups was most prominent among patients with 1 or 2 risk factors (Table 5, Figs. 3A and B, respectively) who comprised more than one-half of the patient population, whereas among patients with ⱖ3 risk factors, mortality was only slightly lower in the ICD group than in the conventional therapy group (Table 5, Fig. 3C). Cox proportional-hazards modeling of mortality, using the simple risk score stratifiers, treatment arm, and their interactions as covariates, demonstrated that in the conventional therapy group each of the risk score strata had a highly significant hazard ratio for mortality compared with the group with no risk factors (Table 6). Patients with ⱖ1 risk factors exhibited more than a 4-fold increase in the risk of death compared with patients with no risk factors. Furthermore, significant differences were found among the 3 strata with 1, 2, or ⱖ3 risk factors (p ⫽ 0.04). OUTCOME BY RISK SCORE.
Downloaded from content.onlinejacc.org by Jose Rubio Campal on January 15, 2008
Goldenberg et al. MADIT-II Risk Score
292
JACC Vol. 51, No. 3, 2008 January 22, 2008:288–96
Multivariate Therapy Risk of All-Cause Factors*† Group Proportional forMortality Selected Hazards in the Conventional Regression Model: Multivariate Proportional Hazards Regression Model: Risk of All-Cause Mortality in the Conventional Therapy Group for Selected Risk Factors*†
Table 4
HR
95% Confidence Interval
NYHA functional class ⬎II
1.87
1.23–2.86
0.004
Atrial fibrillation‡
1.87
1.05–3.22
0.034
QRS ⬎120 ms
1.65
1.08–2.51
0.020
Age ⬎70 yrs
1.57
1.02–2.41
0.042
BUN ⬎26 mg/dl (and ⬍50 mg/dl)
1.56
1.00–2.42
0.048
Risk Factor
p Value
*Analysis was conducted in 445 patients allocated to the conventional group: 23 VHR patients are omitted, as well as 22 patients with missing information on one or more of the 5 risk factors. †Model was derived from a best subsets regression analysis (penalizing by 3.84 for each factor included) that was carried out for the 12 risk factors in Table 3. ‡Defined in Table 1. Abbreviations as in Tables 1 and 3.
When the ICD/conventional risk of death was analyzed by risk score strata, no evidence of an ICD effect was shown among patients with 0 risk factors (hazard ratio 0.96; p ⫽ 0.91), whereas among patients with ⱖ1 risk factor, ICD therapy was associated with a significant 49% reduction in the risk of death (Table 6). Consistent with the KaplanMeier estimates in Figure 3, the benefit of ICD therapy was more prominent among patients with 1 (60% risk reduction; p ⫽ 0.002) and 2 (58% risk reduction; p ⬍ 0.001) risk factors than among patients with ⱖ3 risk factors (20% risk reduction; p ⫽ 0.44). The difference between the ICD effect among patients who had either 1 or 2 risk factors and the effect of the device among patients with 0 risk factors was marginally significant (p value for the difference ⫽ 0.05), whereas no difference in ICD efficacy was shown between patients with ⱖ3 risk factors and those with 0 risk factors (p ⫽ 0.72). U-shaped pattern for ICD effect in the total study population. The effect of the ICD among patients with increasing mortality rates in the conventional therapy group (from 0 to ⱖ3 risk factors and VHR patients) showed a Risk Score and Population: All-Cause Outcome Mortality in the by Main Treatment Study Group Table 5
Risk Score and Outcome in the Main Study Population: All-Cause Mortality by Treatment Group Conventional Group
ICD Group
Patients (%)
Deaths (%)†
Patients (%)
Deaths (%)†
445 (100)
94 (21)
686 (100)
88 (13)
0
149 (33)
12 (8)
196 (29)
14 (7)
ⱖ1
296 (67)
82 (28)
490 (71)
74 (15)
1
128 (29)
28 (22)
209 (30)
19 (9)
2
100 (22)
32 (32)
186 (27)
27 (15)
68 (15)
22 (32)
95 (14)
28 (29)
23
10 (43)
37
19 (51)
Risk Group All patients (non-VHR)* By risk score*‡
ⱖ3 VHR group§
*Analysis was conducted after omitting the VHR group; in addition, 22 conventional (1 death) and 19 ICD (0 deaths) patients were omitted due to missing information on risk factors. †Denotes the number of deaths and the corresponding crude mortality rate (deaths per number of patients in each category). ‡High-risk factors included in the risk score are New York Heart Association functional class ⬎II, atrial fibrillation, QRS duration ⬎120 ms, age ⬎70 years, and blood urea nitrogen ⬎26 mg/dl. §Very high-risk patients are repeated from Table 1 for comparison. Abbreviations as in Tables 1 and 2.
Figure 2
Probability of Survival in Patients With Risk Scores 0 and >1
Kaplan-Meier estimates of the probability of survival, by treatment group, in (A) patients with risk score ⫽ 0; and (B) patients with risk score ⱖ1. Analysis was conducted after omitting VHR group; in addition, 22 conventional and 19 ICD patients were omitted due to missing information on risk factors. Abbreviations as in Figure 1.
U-shaped pattern for ICD benefit (Fig. 4 and ICD/ conventional hazard ratios in Table 6). Thus, no significant ICD effect was observed among patients in whom 2-year mortality rates with conventional therapy were very low or very high, whereas the benefit of device therapy was pronounced among patients with intermediate mortality rates. Mode of death and frequency of appropriate ICD therapy by risk-strata. Because the reduction in the risk of all-cause mortality with an ICD is expected to occur through termination of life-threatening arrhythmic episodes that may lead to sudden cardiac death, defibrillator therapy may be less effective in subsets of patients with a relatively low risk of sudden cardiac death and ventricular tachyarrhythmias or in whom nonarrhythmic mortality predominates. We therefore assessed the proportion of sudden cardiac versus nonsudden (e.g., all other modes of death) mortality and the rate of appropriate ICD therapy, in the risk score groups and the VHR group. Patients allocated to conventional medical therapy were shown to experience increasing sudden cardiac mortality rates among those with increasing risk score groups of 0 to
Downloaded from content.onlinejacc.org by Jose Rubio Campal on January 15, 2008
Goldenberg et al. MADIT-II Risk Score
JACC Vol. 51, No. 3, 2008 January 22, 2008:288–96
293
whereas only 13% of the patients in this risk category experienced sudden cardiac death (Fig. 5B). There were 703 patients in the ICD group who received defibrillators and had information on the risk factors considered. Of the 189 patients with 0 risk factors, 18% experienced appropriate ICD therapy during an average follow-up time of 21 months as compared with 26% of the 480 patients with ⱖ1 risk factor who experienced such therapy during an average follow-up time of 20 months (p ⫽ 0.04). Of the 34 VHR patients with an ICD, 18% experienced defibrillator therapy during an average follow-up time of 16 months. Model stability and sensitivity analyses. Several methods were used to validate the stability of model selection and its relationship to ICD efficacy. The results of some of these analyses are described in the Online Appendix. In brief, sensitivity analyses showed that when high BUN was replaced by high creatinine, or NYHA functional class by low EF, similar patterns were found. Other substitutions resulted in weaker conclusions. Cross-validation analyses in smaller groups of conventionally treated patients yielded unstable results for ICD efficacy, possibly due to sample size limitations. Discussion
Figure 3
Probability of Survival in Patients With Risk Scores 1, 2, and >3
Kaplan-Meier estimates of the probability of survival, by treatment group, in (A) patients with risk score ⫽ 1; (B) patients with risk score ⫽ 2; and (C) patients with risk score ⱖ3. Analysis was conducted after omitting VHR group; in addition, 22 conventional and 19 ICD patients were omitted because missing information on risk factors. Abbreviations as in Figure 1.
2, whereas among patients with ⱖ3 risk factors and in VHR patients the increase in sudden cardiac mortality was attenuated (Fig. 5A). In contrast, in the ICD group, crude sudden cardiac mortality rates were relatively low, and similar, among patients with risk scores of 0 to 2, and increased among greater-risk patients. Notably, the predominant mode of death in the VHR group was nonsudden. Nearly 40% ICD-allocated patients in the VHR group experienced nonsudden death during the course of the trial,
We used the prognostic information from a multivariable analysis in MADIT-II patients who were treated with conventional medical therapy to develop a convenient and simple clinical risk score that was employed to stratify higher- and lower-risk subgroups of low-EF patients for primary ICD implantation. Our findings suggest that the benefit of primary ICD therapy may be limited in 2 distinct subsets of MADIT-II patients: 1) a very low-risk subset consisting of nearly one-third of study patients who did not have any risk score factors at enrollment. Patients in this risk category were shown to experience relatively low 2-year mortality rates without an ICD, thereby limiting a meaningful ICD effect within this time-period. 2) A small subset of VHR patients with comorbidities and clinical markers suggestive of advanced cardiovascular disease. Patients in this latter risk category had 2-year mortality rates of 50%, with or without an ICD, and the predominant mode of death in this population was nonarrhythmic in nature, thus precluding a meaningful ICD effect on the risk of all-cause mortality. By contrast, the benefit of ICD therapy was pronounced (60% reduction in the risk of death compared with conventional medical therapy) in more than one-half of study patients who had 1 or 2 risk score factors. In this subset of patients, the associated 2-year probabilities of death without an ICD were 22% and 27%, respectively, whereas the respective mortality rates in the ICD arm were 10% and 15%. The U-shaped pattern of ICD benefit suggests a pronounced benefit in intermediate-risk patients with left ventricular dysfunction and attenuated efficacy in lower- and
Downloaded from content.onlinejacc.org by Jose Rubio Campal on January 15, 2008
Goldenberg et al. MADIT-II Risk Score
294
JACC Vol. 51, No. 3, 2008 January 22, 2008:288–96
Risk Score and Outcome in the Main Study Population: Multivariate Analysis for the End Point of All-Cause Mortality* Table 6
Risk Score and Outcome in the Main Study Population: Multivariate Analysis for the End Point of All-Cause Mortality* Main Effect in Conventional Group
Risk Group
n (%)‡
All patients (non-VHR)
1,131 (100)
HR§
95% Confidence Interval
ICD: Conventional p Value
NA
HR储
95% Confidence Interval
p Value
0.60
0.45–0.80
⬍0.001
By risk score† 0
345 (31)
1.00
Reference
ⱖ1
786 (69)
4.27
2.3–7.8
1
337 (30)
3.06
2
286 (25)
5.04
ⱖ3
163 (14)
6.05
VHR group#
60
0.96
0.44–2.07
0.91
⬍0.001
0.51
0.37–0.70
⬍0.001
1.6–6.0
0.001
0.40
0.22–0.72
0.002
2.6–9.8
⬍0.001
0.42
0.25–0.70
⬍0.001
3.0–12.2
⬍0.001
0.80
0.46–1.40
1.00
0.50–2.2
NA
0.44 ⬎0.99
*Proportional hazards was conducted in 1,131 patients, after omitting the VHR group and 22 in the conventional therapy group (1 death) and 19 ICD (0 deaths) patients with missing information on risk factors. Models included treatment arm and either nothing more, or two risk groups (0 and ⱖ1), treatment arm, and interaction with treatment arm, or four risk groups, treatment arm, and interactions with treatment arm. †High-risk factors included in the risk score are: New York Heart Association functional class ⬎II, atrial fibrillation, QRS duration ⬎120 ms, age ⬎70 years, and blood urea nitrogen ⬎26 mg/dl. ‡Number of patients (percentage of total) with indicated number of high-risk factors (risk score). §HR denotes hazard ratio for all-cause mortality relative to patients with none of the 5 risk factors. Tests for the difference in HRs among the groups are as follows: among risk scores 0 to ⱖ3: p ⬍ 0.001; among risk scores 1 to ⱖ3: p ⬍ 0.04; among levels 0 and ⱖ1 (see above). 储HR denotes the hazard ratio for ICD relative to conventional in each risk group. Tests of the HR for ICD effect between pairs of risk groups yielded: risk score 1 vs. 0: p ⫽ 0.08; risk score 2 vs. 0: p ⫽ 0.08; risk score 1 or 2 vs. 0: p ⫽ 0.05; risk score ⱖ3 vs. 0: p ⫽ 0.72; risk score ⱖ1 vs. 0: p ⫽ 0.14; among levels 0, 1, 2, and ⱖ3: p ⫽ 0.12. #Analysis in very high-risk patients was conducted separately and is shown here for comparison. Abbreviations as in Tables 1, 2, and 3.
higher-risk subsets. This relationship is consistent with previous observations from primary ICD trials. Of the 7 randomized studies in which primary prevention with a defibrillator was evaluated in low-EF patients, 5 showed a meaningful 23% to 54% reduction in the risk of death with ICD therapy (1,3– 6), whereas in CABG (Coronary Artery Bypass Graft)-Patch (10) and the DINAMIT (Defibrillator in Acute Myocardial Infarction Trial) (16) no ICD benefit was shown (hazard ratios 1.07 and 1.08, respectively). Notably, the latter 2 trials enrolled patients with a low risk of arrhythmic death or a very high clinical risk, respectively. Analysis of the CABG-Patch trial data revealed that the low risk of arrhythmic mortality after coronary revascularization resulted in a nonsignificant reduction in total mortality with
Figure 4
U-Shaped Curve for ICD Efficacy
(A) Two-year Kaplan-Meier mortality rates in the ICD and conventional therapy groups; and (B) the corresponding 2-year mortality rate reduction with an ICD, by risk score and in VHR patients. *p ⬍ 0.05 for the comparison between the conventional therapy and ICD groups. Abbreviations as in Figure 1.
an ICD during the course of the trial (17), whereas in DINAMIT enrollment of high-risk patients with left ventricular dysfunction in the immediate postinfarction period resulted in a high rate of nonarrhythmic mortality that may have attenuated the ICD effect on total mortality (16). Furthermore, subanalyses of the secondary prevention CIDS (Canadian Implantable Defibrillator Study) trial (18) and the first MADIT study (19) have consistently shown the lack of a significant survival benefit with an ICD in a relatively large subset of low-risk patients. Thus, it appears that careful selection of appropriate risk patients is critical for obtaining a meaningful ICD effect in low-EF patients. Presently, there are no validated criteria for selecting or excluding patients with reduced EF for prophylactic ICD therapy. Signal-averaged electrocardiography and inducibility with electrophysiological testing were not shown to be clinically useful in risk stratification for primary ICD implantation (9,10). Thus, EF remains the major eligibility criterion for primary ICD implantation (7). Recently, microvolt T-wave alternans was shown to be an independent predictor of nonfatal sustained ventricular arrhythmias or death in patients with left ventricular dysfunction and was suggested to be useful to identify patients in whom primary ICD therapy may be beneficial (20). It should be noted, however, that the relation between this possible risk-stratifier and outcome was not compared between ICD- and non–ICDtreated patients. Importantly, assessment of the risk of ventricular arrhythmias or sudden cardiac death in patients without a defibrillator does not always correlate with ICD efficacy. Thus, it is possible that the association between the presence of an abnormal microvolt T-wave alternans test and spontaneous ventricular arrhythmias may not identify ICD benefit in relatively low-risk patients, without additional clinical risk factors, or in very high-risk patients, who also have a high risk of nonarrhythmic mortality. Our findings suggest that a simple clinical risk score that includes age, heart failure functional class, BUN levels, QRS
Downloaded from content.onlinejacc.org by Jose Rubio Campal on January 15, 2008
Goldenberg et al. MADIT-II Risk Score
JACC Vol. 51, No. 3, 2008 January 22, 2008:288–96
Figure 5
Mode of Death by Risk Group
Percent of sudden cardiac deaths (SCD) and nonsudden deaths (e.g., all other modes of all-cause mortality) presented as the number of deaths per number of patients in each risk category, in (A) the conventional therapy group and (B) the ICD group. The mode of death was not determined in 28 (15%) cases that were distributed similarly among risk groups and omitted. Abbreviations as in Figure 1.
duration, and the presence of atrial fibrillation can delineate lower- and higher-risk subsets in the low EF population that correlate with ICD efficacy. Using this methodology, we showed that despite the fact that ICD therapy was associated with an overall significant 31% reduction in the risk of death in the MADIT-II population, approximately one-third of enrolled patients who had none of the riskscore factors had no identifiable benefit from the implanted device. These findings may also have important healtheconomic implications considering the high incremental cost-effectiveness ratio for an ICD that was found in MADIT-II (21). Study limitations. Patients in MADIT-II were followed-up for a relatively short period of time during the trial (mean period, 20 months, and up to 4 years). Therefore, further studies are needed to validate the consistency of the current risk stratification scheme during longer time-periods after
295
ICD implantation. The MADIT-II protocol excluded most patients with BUN ⬎70 mg/dl or creatinine ⬎3.0 mg/dl. Accordingly, the VHR group in the current study consisted of only 60 patients, and the findings regarding lack of an ICD effect in this population should be regarded as preliminary and exploratory. Nevertheless, the exceedingly high rate of nonarrhythmic death in VHR patients who were treated with an ICD suggests that the effect of device therapy on total mortality in this risk group may be limited. Thus, the efficacy of ICD therapy in patients with BUN ⱖ50 mg/dl and/or serum creatinine ⱖ2.5 mg/l should be evaluated separately in future trials. At present, our findings suggest caution when considering primary ICD implantation in patients with advanced renal dysfunction. Low-risk patients with 0 risk factors comprised approximately one-third of study patients. However, the statistical power of this analysis to detect a significant ICD effect in the lower-risk subset was limited because of a low event rate. It appears that very large trials would be needed to establish efficacy in such groups. Our data suggest that an ICD may not provide a meaningful effect in low-risk patients during the first 2 years after implantation because of a relatively low risk of arrhythmic mortality during this time period. It should also be noted that the analyses of the simple risk score are potentially biased because the conventional arm data were used to construct the score, as well as to evaluate it using ICD-arm and conventional-arm data. Possibly because of sample size limitations, cross-validation analyses in smaller data sets did not facilitate the development of a comparable risk score or statistically significant evaluations of ICD effects. Our evaluation of 2 less-efficient risk scores, both giving similar results, provides some support for our general conclusions. Still, our results need to be considered largely descriptive of what occurred in the MADIT-II study, rather than predictive of what might occur in other or future settings. Thus, there is great need to conduct similar analyses in other sets of clinical trial data. These analyses would provide important confirmatory data for the proposed risk-stratification score.
Conclusions and Possible Clinical Implications Our findings suggest that a simple risk score, comprising 5 clinical risk factors, can be used to identify a relatively large lower-risk subset in the post-MI, low-EF population, in whom the short-term survival benefit of an ICD may be limited. Importantly, it should be noted that risk factors in patients with acquired cardiac disorders are dynamic and time-dependent. Therefore, careful follow-up and continuous risk-assessment should constitute an important component in the management of low-risk patients considered for primary ICD implantation. Our preliminary findings regarding the high rate of nonarrhythmic mortality in ICDtreated patients with comorbidities and advanced cardiac disease suggest that newer and more effective means are
Downloaded from content.onlinejacc.org by Jose Rubio Campal on January 15, 2008
296
Goldenberg et al. MADIT-II Risk Score
needed to prevent heart failure progression and death after ICD implantation in this high-risk population.
JACC Vol. 51, No. 3, 2008 January 22, 2008:288–96
11.
Reprint requests and correspondence: Dr. Ilan Goldenberg, Heart Research Follow-up Program, Box 653, University of Rochester Medical Center, Rochester, New York 14642. E-mail:
[email protected].
12.
REFERENCES
14.
1. Moss AJ, Hall WJ, Cannom DS, et al., for the Multicenter Automatic Defibrillator Implantation Trial Investigators. Improved survival with an implanted defibrillator in patients with coronary disease at high risk for ventricular arrhythmia. N Engl J Med 1996;335:1933– 40. 2. Buxton AE, Lee KL, Fisher JD, Josephson ME, Prystowsky EN, Hafley G. The Multicenter Unsustained Tachycardia Trial Investigators. A randomized study of the prevention of sudden death in patients with coronary artery disease. N Engl J Med 1999;341:1882–90. 3. Moss AJ, Zareba W, Hall WJ, et al., Multicenter Automatic Defibrillator Implantation Trial II Investigators. Prophylactic implantation of a defibrillator in patients with myocardial infarction and reduced ejection fraction. N Engl J Med 2002;346:877– 83. 4. Kadish A, Dyer A, Daubert JP, et al. Prophylactic defibrillator implantation in patients with nonischemic dilated cardiomyopathy. N Engl J Med 2004;350:2151– 8. 5. Bristow MR, Saxon LA, Boehmer J, et al. Cardiac-resynchronization therapy with or without an implantable defibrillator in advanced chronic heart failure. N Engl J Med 2004;350:2140 –50. 6. Bardy GH, Lee KL, Mark DB, et al., Sudden Cardiac Death in Heart Failure Trial (SCD-HeFT) Investigators. Amiodarone or an implantable cardioverter-defibrillator for congestive heart failure. N Engl J Med 2005;352:225–37. 7. Hunt SA, Abraham WT, Chin MH, et al. ACC/AHA 2005 guideline update for the diagnosis and management of chronic heart failure in the adult. J Am Coll Cardiol 2005;46:e1– 82. 8. Zareba W, Piotrowicz K, McNitt S, Moss AJ, MADIT II Investigators. Implantable cardioverter-defibrillator efficacy in patients with heart failure and left ventricular dysfunction (from the MADIT II population). Am J Cardiol 2005;95:1487–91. 9. Daubert JP, Zareba W, Hall WJ, et al., MADIT II Study Investigators. Predictive value of ventricular arrhythmia inducibility for subsequent ventricular tachycardia or ventricular fibrillation in Multicenter Automatic Defibrillator Implantation Trial (MADIT) II patients. J Am Coll Cardiol 2006;47:98 –107. 10. Bigger JT Jr. Prophylactic use of implanted cardiac defibrillators in patients at high risk for ventricular arrhythmias after coronary-artery
13.
15.
16.
17.
18.
19. 20.
21.
bypass graft surgery. Coronary Artery Bypass Graft (CABG) Patch Trial Investigators. N Engl J Med 1997;337:1569 –75. Chertow GM, Normand SLT, Silva LR, McNeil BJ. Survival after acute myocardial infarction in patients with end-stage renal disease results from the Cooperative Cardiovascular Project. Am J Kidney Dis 2000;35:1044 –51. Herzog CA, Ma JZ, Collins AJ. Poor long-term survival after acute myocardial infarction among patients on long-term dialysis. N Engl J Med 1998;339:799 – 805. Anavekar NS, McMurray JJ, Velazquez EJ, et al. Relation between renal dysfunction and cardiovascular outcomes after myocardial infarction. N Engl J Med 2004;351:1285–95. Goldenberg I, Moss AJ, McNitt S, et al., Multicenter Automatic Defibrillator Implantation Trial-II Investigators. Relations among renal function, risk of sudden cardiac death, and benefit of the implanted cardiac defibrillator in patients with ischemic left ventricular dysfunction. Am J Cardiol 2006;98:485–90. Greenberg H, Case RB, Moss AJ, Brown MW, Carroll ER, Andrews ML. Analysis of mortality events in the Multicenter Automatic Defibrillator Implantation Trial (MADIT-II). J Am Coll Cardiol 2004;43:1459 – 65. Hohnloser SH, Kuck KH, Dorian P, et al, on behalf of the DINAMIT Investigators. Prophylactic use of an implantable cardioverter-defibrillator after acute myocardial infarction. N Engl J Med 2004;351:2481– 8. Bigger JT Jr., Whang W, Rottman JN, et al. Mechanisms of death in the CABG Patch trial: a randomized trial of implantable cardiac defibrillator prophylaxis in patients at high risk of death after coronary artery bypass graft surgery. Circulation 1999;99:1416 –21. Sheldon R, Connolly S, Krahn A, Roberts R, Gent M, Gardner M. Identification of patients most likely to benefit from implantable cardioverter-defibrillator therapy: the Canadian Implantable Defibrillator Study. Circulation 2000;101:1660 – 4. Moss AJ, Fadl Y, Zareba W, Cannom DS, Hall WJ. Survival benefit with an implanted defibrillator in relation to mortality risk in chronic coronary heart disease. Am J Cardiol 2001;88:516 –20. Bloomfield DM, Bigger JT, Steinman RC, et al. Microvolt T-wave alternans and the risk of death or sustained ventricular arrhythmias in patients with left ventricular dysfunction. J Am Coll Cardiol 2006;47: 456 – 63. Zwanziger J, Hall WJ, Dick AW, et al. The cost effectiveness of implantable cardioverter-defibrillators: results from the Multicenter Automatic Defibrillator Implantation Trial (MADIT)-II. J Am Coll Cardiol 2006;47:2310 – 8. APPENDIX
For additional discussion regarding sensitivity and cross-validation studies, please see the online version of this article.
Downloaded from content.onlinejacc.org by Jose Rubio Campal on January 15, 2008
Risk Stratification for Primary Implantation of a Cardioverter-Defibrillator in Patients With Ischemic Left Ventricular Dysfunction Ilan Goldenberg, Anant K. Vyas, W. Jackson Hall, Arthur J. Moss, Hongyue Wang, Hua He, Wojciech Zareba, Scott McNitt, Mark L. Andrews, for the MADIT-II Investigators J. Am. Coll. Cardiol. 2008;51;288-296 doi:10.1016/j.jacc.2007.08.058 This information is current as of January 15, 2008 Updated Information & Services
including high-resolution figures, can be found at: http://content.onlinejacc.org/cgi/content/full/51/3/288
Related Articles
A related article has been published: http://content.onlinejacc.org/cgi/content/full/51/3/297
Supplementary Material
Supplementary material can be found at: http://content.onlinejacc.org/cgi/content/full/51/3/288/DC1
References
This article cites 21 articles, 15 of which you can access for free at: http://content.onlinejacc.org/cgi/content/full/51/3/288#BIBL
Citations
This article has been cited by 1 HighWire-hosted articles: http://content.onlinejacc.org/cgi/content/full/51/3/288#otherart icles
Rights & Permissions
Information about reproducing this article in parts (figures, tables) or in its entirety can be found online at: http://content.onlinejacc.org/misc/permissions.dtl
Reprints
Information about ordering reprints can be found online: http://content.onlinejacc.org/misc/reprints.dtl
Downloaded from content.onlinejacc.org by Jose Rubio Campal on January 15, 2008