RAW TOOL IDENTIFICATION THROUGH DETECTED DEMOSAICING REGULARITY Hong Cao and Alex C. Kot School of Electrical and Electronic Engineering, Nanyang Technological University, Singapore ABSTRACT RAW tools are PC software tools that develop the RAWs, i.e. the camera sensor data, into full-color photos. In this paper, we propose to study the internal processing characteristics of these RAW tools using 3 heterogeneous sets of demosaicing features. Through feature-level fusion, normalization and an Eigen-space regularization technique, we derive a compact set of discriminant features. Experimentally, we find that the compact feature set can be used to accurately distinguish 40 RAW-tool classes. A dissimilarity study also shows that the cropped image blocks from different RAW-tool or positional classes have a great deal of dissimilarity in our extracted demosaicing features. Index Terms— CFA, demosaicing, DSLR, image regularity, RAW tool, source identification
processing, they provide a controllable digital darkroom environment which allows users experimenting various parameter settings in order to achieve their most desirable effects. Moreover, since the RAW tools are designed for PCs, advanced demosaicing and post-processes, which potentially require more processing power and larger memory, can be implemented as the typical camera hardware constraints and the “shot-to-shot” delay are no longer critical design considerations for these RAW tools. RAW or “digital negatives” Sensor array Color filter array (CFA) (a)
Light Rays
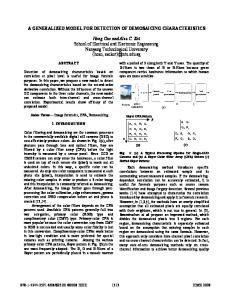
1. INTRODUCTION Technological advances in digital photography have made digital single-lens reflex (DSLR) cameras more affordable and popular choices for worldwide photo enthusiasts. Compared with the compact point-and-shoot cameras, DSLR cameras usually allow more user controls and achieve better image quality. Very often, a DSLR camera user can save the immediate camera sensor readings, the so called “digital negatives”, into the proprietary RAW format. As shown in Fig. 1(a), since most DSLR cameras are also based on single sensor chip, color filtering is needed to capture specific colors at each tiny photo site (pixel) in order to cost-effectively produce color. Arrangement of these tiny color filters depends on the color filter array (CFA) pattern and Bayer CFA (or its shifted versions) in Fig. 1 (b)–(e) are the most dominantly used in commercial digital still cameras (DSC) [1]. As a result of color filtering, the RAWs contain only one color at each pixel and demosaicing techniques and some post-processes such as white balancing, colorimetric interpretation, Gamma correction, noise reduction, antialiasing and sharpening are needed to develop the RAWs into 3-color digital photos [2]. Instead of relying the DSLR camera’s internal development, one can save the “digital negatives” into RAWs first and develop them into photos at a later time using commercial RAW tools, such as Photoshop CS and Corel PaintShop Pro, on a personal computer (PC). Though these RAW tools perform a similar role to internal camera
978-1-4244-5654-3/09/$26.00 ©2009 IEEE
2885
(b)
(c)
(d)
(e)
Fig. 1 (a) Illustration of Single-Chip Photo Capturing; (b) Bayer CFA and (c), (d), (e) its shifted versions, where the subscript 1,2,…,4 denote the relative position in the 22 periodical CFA lattice As a major challenge in passive image forensic research, image source identification [5] has been extensively studied in recent years for digital cameras, cellular-phone cameras, scanners and visual devices of different sensor types through detection of all kinds of source-dependant features including sensor noise [3], dust patterns, lens aberrations, demosaicing characteristics [4, 6, 7], image quality metrics or certain statistical regularities. To the best of our knowledge, none of an existing work has attempted to distinguish the commercial RAW tools from their output photos. In this paper, we study the processing characteristics of 10 popular commercial RAW tools through detection of their demosaicing regularity from the output photos. Our previous works [6, 7] have proposed a generalized detection framework of demosaicing regularities and the method can be used to extract highly discriminative demosaicing features from an output image. In this paper, with the same detection model, we compute a
ICIP 2009
compact set of discriminative features from 3 large and heterogeneous sets of demosaicing features for source RAW-tool identification. The compact feature set is also used to study the dissimilarity of different pairs of RAWtool classes. The rest of this paper is organized as follows. Section 2 describes the 3 heterogonous set of demosaicing features we use. Section 3 applies an Eigen-space regularization technique for feature dimension reduction, demonstrates the source RAW-tool identification performances and computes the log Bhattacharyya dissimilarity of different pairs of RAW-tool classes. Section 4 concludes this paper.
Error cumulants: The prediction errors e also contains useful information, which indicates the goodness of our estimated demosaicing formulas match with true underlying formulas. We compute 4 cumulants features for jth group as
2. FEATURE EXTRACTION
where {} is the expectation operator. A total of 64 error cumulants are computed for the 16 groups.
Since Bayer CFA has been the most dominantly used in commercial DSCs, it is reasonable to assume that the RAWs are stored according to one of the format among Fig. 1 (b)(e). Assume the underlying CFA is Fig. 1(b), our previous work in [6] propose a general estimation method of the demosaicing formulas from a given output image based on the second-order derivative correlation. Our detection model first separates the demosaiced samples from the sensor samples based on a known Bayer CFA. By following [7], we further classify the demosaiced samples into 16 categories with known demosaicing axes via a reverse classification technique. With an assumption that the same or very similar demosaicing formulas are used for each category, we write the equation below for the jth category {zkj}, 1kK, where K denotes the number samples in the jth category,
1 ekj
e e 3 e e 2 e e 3 e 12 e e 6 e
2 ekj
2
2
kj
3
3
kj
kj
kj
4
4
kj
2
kj
(3)
3
2
kj
2
3
kj
kj
4
kj
Normalized group sizes: Our reverse grouping technique [7] is able to partition the demosaiced samples into smaller categories, which best reveal the actual grouping of the demosaicing algorithm. After reverse classification, the distribution of demosaiced samples into 16 sub-categories is a good indication of the adopted grouping. We compute 8 such features as percentages of demosaiced samples distributed to 8 selected groups.
is the matrix of
Since 3 other Bayer CFAs in Fig. 1 (c)-(e) are almost equally likely adopted as Fig. 1 (b), we also separate the demosaiced samples and sensor samples according to these 3 CFAs and repeat the above feature extraction process 3 more times. As a result, we compute a total of 1248 predict weight features, 256 error cumulants and 32 normalized group sizes. Though the overall feature dimension increase 4-fold, our features automatically contain the CFA information as well as the comprehensive imbalance pattern formed by the demosaicing regularities detected from the 4 channels.
corresponding support partial second-order derivatives computed from the sensor data, w j \ m1 are the prediction
3. DISSIMILARITY OF RAW-TOOLS AND SOURCE IDENTIFICATON
e j Q jw j z j
where z j \ K 1 is the vector of th
derivatives of the j
group, Q j \
(1) partial second-order K l
weights of the jth group and l is the number of weights chosen and e j \ K 1 is the vector of the corresponding prediction errors. With the above formulation, the optimal weights can be solved as a regularized least square solution below,
min e j
2
w
2
w
Q j T Q j L Q j z j (2) 1
j
where is a small empirical regularization constant and L \ l l denotes an identity matrix. Based on this solution, the 3 sets features we used are described below: Prediction weights: As representation of the underlying demosaicing formula of the jth group, the prediction weights wj are used as features. For the jth group, we get l weight features. Based on a similar formulation, we solve the prediction weights similarly for all other groups and a total of 312 weight features are computed in such a manner.
2886
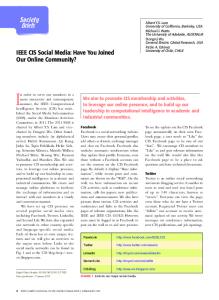
In this section, we compute a compact core set of discriminative features from the 3 sets of demosaicing features to study the dissimilarity of 10 commercial RAW tools in Table 1 from the cropped blocks of the output photos. To establish the dataset, we first select 100 RAWs captured using an Olympus E500 DSLR camera to cover a large variety of common sceneries and then, as illustrated in Fig. 2, these RAWs are separately developed into full-color photos using 10 commercial RAW tools and stored as uncompressed TIFF format. For each tool, we crop 4 positional classes of image blocks (512512) from the output photos as defined below, Class 1: p is odd, q is odd; Class 2: p is even, q is even; Class 3: p is odd, q is even; Class 4: p is even, q is odd. where (p, q) denote the top-left corner of the cropping box.
Table 1. Ten Commercial RAW Tools ID 1 2 3 4 5 6 7 8 9 10
Commercial RAW Tool ACDSee v10 Breeze Browser Pro v1.7 Capture One v3.7.8 Olympus Master v2 Photoshop CS2 Picture Window Pro v4.0 Rawshooter Essential 2006 Silkypix Developer Studio v3.0 StepOK v1.1 Corel Paintshop Pro v12
Signal
Fig. 2 Developing a RAW into Photos Using Various RAW Tools
Noise
Null
(a)
m
(b)
r
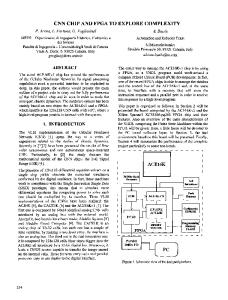
Fig. 3 Eigen Spectra of Training Feature Set, the True Variances of Test Feature Set and the Modified Eigen Spectra
Fig. 4 Error Rate in Source RAW Tool Identification vs Number of Features (a) the Overall View (b) the Locally Enlarged View
For the same RAW tool, the demosaicing features extracted for the 4 classes are essentially different as each class maps to one particular Bayer CFA in Fig. 1 (b)-(e). For each RAW tool and each positional class, we crop 12 nonoverlapped blocks of 512512 at fixed locations from an output photo. In this way, for a total of 104=40 classes, we form a dataset of 10412100=48000 blocks. We further split this dataset of into a training set of 32000, i.e. 8000 per class and a test set of the remaining blocks. The demosaicing features are then extracted from these images to form the corresponding training and test feature sets.
1. 2.
�n w
n w , km k , mk r 1 r , r k N
(4)
where n( w ) is the nth largest Eigen value of Sw and ,
3.1. Core Discriminative Feature Extraction The 3 sets of demosaicing features are fused at feature level so that each overall feature vector contains N=1536 measurements. Based on the training set, we compute the global mean and the standard deviation of each measurement so that we can linearly normalize each measurement to have zero global mean and unity variance. Let {xij} denote the normalized training feature vectors, where i{1,…,40} is the class label and j{1,…,8000} is index of an feature vector. We then apply an Eigen-space regularization (ERE) method [8] to generate a compact set of discriminative features. This ERE method is briefly summarized below:
Compute the within-class covariance matrix Sw and perform Eigen decomposition, where the Eigen spectra is plotted in Fig. 3; Separate the Eigen spectrum into 3 regions, “signal”, “noise” and “null”, and fit a regularized spectra as
3.
are empirical constants. The details of finding m, r, and can be found in [8]. From Fig. 3, we can see the regularized Eigen spectra is closer to the test variance curve in the “noise” region and the unreliable spectra in the “null” region are replaced by a constant spectra. Perform the whitening feature transformation
� NwT xij y ij
4.
(5)
where � N( w) 1( w) �1( w) , ! , (Nw) �N( w) and (nw) are the Eigen vectors of Sw; Based on the {yij}, compute the total covariance matrix St and construct � 1 t ,! , Dt for dimensionality t
D
reduction, where 1 t , ! , Dt are D Eigen vectors of St
2887
Training Feature Sets
Table 2 Dissimilarity of Positional Class Pairs Table 3 The Dissimilarity (the Minimal of Different Combinations of Position Classes) of of Various RAW Tools Various RAW-Tool Pairs Positional Class Mapping RAW RAW Test Feature Sets Tool Tools 11 12 13 14 1 2 3 4 5 6 7 8 9 10 3.4 4.2 4.0 1 3.1 3.6 5.1 3.3 3.9 3.9 3.7 3.6 4.2 1 -1.0 -1.0 3.9 4.6 4.3 2 2 4.0 4.9 6.1 4.5 4.5 5.5 4.4 4.1 3.4 -1.6 -1.6 2.6 2.9 2.7 3 3 2.8 3.0 3.9 1.8 3.5 2.4 3.0 3.5 3.9 -1.2 -1.2 1.8 4.6 4.5 4 4 4.8 4.9 5.2 5.3 5.3 5.4 5.1 4.9 5.3 -1.9 -1.9 1.6 2.5 2.4 5 5 2.4 3.2 1.9 3.4 3.3 2.7 2.4 3.2 3.6 -1.5 -1.5 4.7 4.8 5.1 6 6 4.1 3.5 4.6 6.0 4.0 5.4 4.2 1.5 4.5 -0.7 -0.7 2.1 3.5 3.5 7 7 3.5 4.0 2.9 4.4 2.3 4.4 4.1 4.2 4.8 -0.8 -0.8 2.9 3.3 3.3 8 8 3.0 2.9 3.2 4.5 2.7 3.6 4.1 3.4 3.7 -1.1 -1.1 4.3 4.6 4.5 9 9 4.5 4.0 5.3 6.8 4.8 2.6 5.9 4.8 5.2 -1.3 -1.3 4.4 5.2 5.3 10 10 4.3 2.9 5.1 6.4 4.9 4.7 5.6 4.8 4.2 -0.9 -0.9
corresponding to the largest Eigen values. The compact feature vector
� Dt T y ij � Nw � Dt z ij =
T
xij
(6)
The above ERE process reliably identifies a discriminative subspace from the entire space. Extensive experiments in [8] have demonstrated this method to have a better classification performance to unseen data than numerous conventional subspace methods.
3.2. Source Identification In this experiment, we use the compact feature set to classify the 40 RAW-tool classes using a first nearest neighbor classifier (1-NNK). A cosine distance measure between a probe feature zp vector and a gallery vector zg Dcos z p , z g z pT z g
z
p
zp
(7)
is applied, where denotes Frobenius norm. Fig. 4 shows the error rate as a monotonically decreasing function of D, i.e. the number of features used. From it, we can see the test error rate reduces sharply at the beginning and stabilizes to a constant level of 1.35% for D36. This good result suggests the 40 RAW-tool classes can be confidently distinguished with as few as 36 features.
3.3. Dissimilarity Study Based on the compact feature vectors (D =36), we compute the log Bhattacharyya dissimilarity between training population of the ith class (mean vector: zi tr , covariance matrix: Si tr ) and test population of the jth class (mean vector: z j te , covariance matrix: Sjte ) as det Sij 1 1 DBhat i, j ln dij T Sij 1dij ln 8 2 det Si tr det Sjte
(8)
where d ij zi tr z j te and S ij S i tr S jte 2 . The results tabulated in Table 2 and 3 suggest that the training and test populations from 2 different RAW tools or 2 different positional classes of a same RAW tool
2888
consistently exhibit very large dissimilarity as compared to the cases that both the training and test feature sets are from the same RAW tool and the same positional class. This suggests large separation margins for different RAW-tool and positional classes, which lead to our excellent previous classification performance. Our compact set of features can be conveniently and effectively used as a unique intrinsic fingerprint of the various commercial RAW tools.
4. CONCLUSION In this paper, we compute a compact set of discriminative features through using feature-level fusion, normalization and a recent Eigen-space regularization technique on 3 heterogonous sets of demosaicing features. With a simple 1NNK classifier, the derived features achieve a very low average error rate of 1.35% in identification of 40 RAWtool classes with as few as 36 features. A dissimilarity study of the RAW classes based on the compact feature set shows that comparatively the different RAW-tool pairs and the different positional class pairs of a same RAW tool consistently exhibit a great deal of dissimilarity in our extracted demosaicing features.
5. REFERENCES [1] X. Li, B. Gunturk and L. Zhang, “Image Demosaicing: a Systematic Survey,” in Proc. of SPIE. vol. 6822, 2008 [2] Understand the Digital RAW Capturing, Available: http://www.adobe.com [3] J. Lucas, J. Fridrich and M. Goljan, “Digital Camera Identification from Sensor Pattern Noise”, IEEE Trans. on Info. Forensics and Security, vol. 1-2, pp. 205-214, 2006 [4] A. Swaminathan, M. Wu and K. J. R. Liu, “Nonintrusive Component Forensics of Visual Sensors Using Output Images,” IEEE Trans. on Info. Forensics and Security, vol. 2-1, pp. 91-106, 2007 [5] H. T. Sencar and N. Memon, “Overview of State-of-Art in Digital Image Forensics,” in Proc. of WSPC, 2007 [6] H. Cao and Alex C. Kot, “A Generalized Model for Detection of Demosaicing Characteristics,” Proc. of ICME, pp. 1513-1516, 2008 [7] H. Cao and Alex C. Kot, “Accurate Detection of Demosaicing Regularity from Output Images,” Proc. of ISCAS, pp. 497-500, 2009 [8] X. Jiang, B. Mandal and Alex C. Kot, “Eigenfeature Regularization and Extraction in Face Recognition,” IEEE Trans. on Pattern Analysis and Machine Intelligence, vol. 30-3, pp. 383-394, 2008