Supporting Information © Copyright Wiley-VCH Verlag GmbH & Co. KGaA, 69451 Weinheim, 2006
© Copyright Wiley-VCH Verlag GmbH & Co. KGaA, 69451 Weinheim, 2006
Supporting Information for
Chemical Microarrays to Identify Ligands that Bind Pathogenic Cells Olivia J. Barrett, Jessica L. Childs, and Matthew D. Disney*
Slide preparation and microarray construction Amine-functionalized slides. Glass microscope slides were cleaned by submersion in 70:30 v/v concentrated H2SO4 and 30% H2O2 for 12 h at room temperature followed by several rinses with distilled water. After air drying, slides were functionalized with amines via reaction with a solution of 3% (3-aminopropyl)triethoxysilane in 95% EtOH (stirred for 10 minutes prior to incubation) for 1 h at room temperature with gentle shaking. The amine functionalized slides were rinsed with 95% EtOH, and cured at 95 °C for 1 h. Slides were rinsed several times with 95% EtOH then H2O and were dried under a stream of air. Succinimide-functionalized slides. Amine-functionalized slides were submerged in a 25 mM solution of Di(N-succinimidyl) carbonate in 20 mL of DMF containing 500 µL of Hünig’s base. Slides were allowed to react overnight at room temperature and were then washed with DMF and finally ethanol. Ethanolamine-functionalized slides.
Succinimide-functionalized slides were
submerged in a 5 mM solution of ethanolamine in 25% aqueous DMF and allowed to react overnight at room temperature. Slides were then washed with the DMF solution, exhaustively with wate r, and finally with ethanol.
BSA-functionalized slides. To a single succinimide-functionalized slide was added a 500 µL solution of 20 mg/mL BSA in 5% Na 2CO3. The solution was distributed on the surface using a sheet of parafilm and allowed to react overnight. Slides were then washed exhaustively with water and finally ethanol. Coating Amine-Functionalized Slides with Agarose. A 1% agarose solution was prepared in H2O by heating. After cooling for 3 min on a bench top, 0.4278 g (0.002 mol; final concentration of 20 mM) of NaIO4 was added to the solution to oxidize the agarose to display aldehydes. A 2 mL aliquot of the agarose solution was immediately pipetted onto the surface of the slide. After the agarose solidified, slides were immersed in H2O for ˜ 3 hr with frequent water changes. Slides were removed from the water and allowed to air dry. Upon drying a clear thin film of agarose was immobilized onto the slide surface.[1] Delivery of Compounds onto the Microarray. A 5 mM solution of each compound (60 total) was prepared in a buffer containing 5% Na 2CO3 with 10% glycerol. A 200 nL aliquot of the solution was spatially spotted onto the surface of the slide and slides were incubated overnight at room temperature. After incubation, slides were immersed in a solution containing 50 mg NaCNBH3, 30 mL 1X PBS, and 10 mL EtOH for 5 min. Slides were removed from the quenching solution, briefly rinsed with water and then washed with 0.2% SDS with gently shaking (3x, 2 min for each washing) then with H2O (2X, 1 min) and air dried. Cell cultures and staining Pseudomonas aeruginosa (strain PA01), and Escherichia coli (strain ORN178 [2]
) were grown in LB media while Candida albicans (strain R0102, University of Ro-
chester Medical Center Rochester, NY) was g rown in YPD (Yeast Peptone Dextrose) media. All cultures were grown overnight at 37 °C with shaking. After incubation, the optical density at 600 nm (OD 600) was measured for each culture and an aliquot removed to yield 1 mL of 10 OD/mL. Cultures were then centrifuged (4000 rpm, 10 min), washed with PBS, and resuspended in 1 mL 1X PBS (10 mM Na 2HPO4, 1.8 mM KH2PO4, 140 mM NaCl, 2.5 mM KCl, pH 7.4). Cells were then stained using the cellpermeable fluorescent dye SYTO 60 (Molecular Probes) by adding 0.5 µL of a 5mM solution of SYTO 60 to cell-containing solutions. The samples were tumbled for 20 min at room temperature in the dark. Cells were harvested by centrifugation and
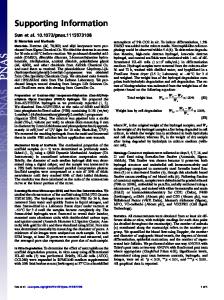
washed with 2 x 1mL 1X PBS to remove unincorporated dye and then resuspended in the appropriate volume of 1X PBS to yield 10 OD/mL of cells. Hybridization Before hybridization, microarrays were pre-wet with 1mL of 1X PBS for 5 min at room temperature. PBS was removed from the array by shaking and then a 300 µL aliquot of the cell suspension (10 OD/mL) was added to the microarray. Cells were evenly distributed on the array surface by covering it with a small piece of parafilm, and the arrays were hybridized for 1 hr at room temperature in the dark. After incubation, unbound cells were washed off by delivering 10 x 1 mL aliquots of 1x PBS over the slide. Slides were allowed to air dry and scanned with a GenePix 4000B microarray scanner with an excitation wavelength of 635 nm. Data was quantified by using Quantity One version 4.6 (Biorad) software. Polymer synthesis Water soluble polymer was functionalized with tryptamine by treating tryptamine (3.2 mg, 19.7 µmol) with poly(ethylene-maleic anhydride) (10.0 mg, 3.2 µmol based on the manufactures’ reported molecular weight of 100,000 g/mol) (Polysciences Inc., Warrington, PA) or ethanolamine (1.2 mL, 19.7 µmol) with poly(ethylenemaleic anhydride) (10.0 mg, 3.2 µmol) in 1 mL DMSO. Each reaction was tumbled at room temperature for 16 h. To quench the unreacted maleic anhydride groups, an equal volume of H2 O was added to the reaction and the sample tumbled for an additional 4 h. Functionalized polymers were dialyzed to remove uncoupled trypatmine or ethanolamine. Prior to dialysis, both samples were diluted to 10 mL with H2O and dialyzed using 3500 MWCO dialysis tubing (Pierce, Snake Skin Pleated Dialysis Tubing). After an overnight dialysis, samples were lyophilized. Polymers were then subjected to UV-Vis spectroscopy to determine if tryptamine was coupled to the polymer. Approximately 10 µg of tryptamine-functionalized polymer in 1 x PBS was scanned from 220-800 nm. A maximum absorbance was observed at ~280 nm, which is consistent with the presence of the indole ring present in tryptamine (Figure S1).
A
0.3
Absorbance
0.25 0.2 0.15 0.1 0.05 0 220
320
420
520
620
720
Wavelength (nm)
B
0.3
Absorbance
0.25 0.2 0.15 0.1 0.05 0 220
320
420
520
620
720
Wavelength (nm)
Figure S1: UV/Vis spectroscopy of A) poly(ethylene-maleic anhydride) functionalized with tryptamine and B) poly(ethylene-maleic anhydride) functionalized with ethanolamine. The maximum at ~280 nm in panel A is consistent with the indole moiety present in tryptamine.
Approximately 2.0 mg of the tryptamine polymer was dissolved in 1.0 mL 1x PBS. The ethanolamine-functionalized polymer was not as water soluble as its tryptamine counterpart. Therefore, 2.0 mg of the ethanolamine polymer was dissolved in 1.0 mL 1x PBS and 36% DMSO and sonicated. After dissolving, the buffer was exchanged by dialysis through a Microcon YM centrifugal filter device (10 000 MWCO) by replacing the buffer several times with 1 mL 1x PBS. Clustering of E. coli by a tryptamine-functionalized polymer E. coli cells were grown and stained as previously described with the exception that SYTO 9 green fluorescent nucleic acid staining dye (Molecular Probes, Eugene, OR) was used instead of SYTO 60. Cells were then diluted from 10 OD/mL to 1 OD/mL using 1X PBS. A 20 µL aliquot of the fluorescently stained E. coli cell suspension was incubated with 80 µg of the tryptamine or ethanolamine polymer (60 µL total volume) and was tumbled in the dark overnight at room temperature. An
aliquot of each sample was placed onto a microscope slide and imaged using phase contrast and fluorescence microscopy (Figure S2). Images show that E. coli cluster in the presence of the tryptamine polymer whereas they do not cluster with the ethanolamine polymer. Evidently, tryptamine is capable of recognizing cell surfaces when multivalently displayed on an array and in solution when displayed on a polymer.
A
B
Figure S2: Microscopy images of E. coli clustered by a tryptamine-functionalized polymer. A) Phase constrast microscopy image of a representative E. coli cluster. B) Fluorescence image of the cluster shown in panel A. References [1]
V. Afanassiev, V. Hanemann, S. Wolfl, Nucleic Acids Res. 2000, 28, E66.
[2]
S.L. Harris, P.A. Spears, E.A. Havell, T.S. Hamrick, J.R. Horton, P.E. Orndorff, J. Bacteriol. 2001, 183, 4099–4102.