Copyright © 2006 American Scientific Publishers All rights reserved Printed in the United States of America
Journal of Nanoscience and Nanotechnology Vol. 6, 644–650, 2006
Effect of Sodium dodecylsulfate and Dodecyltrimethyl Ammonium Bromide on the Morphologies of Gold Nanoparticles in the Presence of Poly(amidoamine) Dendrimers RESEARCH ARTICLE
Mandeep Singh Bakshi,1� ∗ Aman Kaura,2 Gurinder Kaur,3 Kanjiro Torigoe,4 and Kunio Esumi4 1
Department of Ob/Gyn and Biochemistry, University of Western Ontario, 339 Windermere Rd, London, ON, Canada N6A 5A5 2 Department of Chemistry, Guru Nanak Dev University, Amritsar 143005, Punjab, India 3 Department of Physics, Guru Nanak Dev University, Amritsar 143005, Punjab, India 4 Department of Applied Chemistry andUniversity Institute of Colloid and Interface Science, Tokyo University of Science, of Waterloo Kagurazaka, IP Shinjuku-ku, Tokyo 162-8601, Japan : 129.97.58.73
Fri, 03 Mar 2006 18:15:34
The synthesis of gold nanoparticles has been carried out in aqueous phase in the presence of both ionic surfactants (i.e., sodium dodecylsulfate (SDS) and dodecyltrimethylammonium bromide (DTAB)) and poly(amidoamine) dendrimers (PAMAM). It has been observed that the fluoroderivative of 2G PAMAM (2D) acts as reducing agent in reducing Au(III) to Au(0) leading to the formation of fine gold nanoparticles. This process has been further evaluated in the presence of fixed amounts of both SDS and DTAB in their respective pre and post micellar concentration regions. The presence of SDS leads to the appearance of clear ordered morphologies such as triangular, hexagonal, spherical, and rod shaped, while the presence of DTAB does not show this effect. The formation of nanoparticles in triangular morphologies is more significant in the premicellar concentration range of SDS whereas hexagonal morphologies in the post micellar concentration range. On the contrary, increase in the DTAB concentration from pre to post micellar range only reduces the size of gold nanoparticles without the appearance of any ordered morphology. The formation of ordered gold nanoparticles in the presence of SDS has been further attributed to the significant SDS-dendrimer interactions and an appropriate mechanism has been proposed to justify the results.
Keywords: Gold Nanoparticles, Ordered Morphologies, Ionic Surfactant, Poly(amidoamine) Dendrimers, Transmission Electron Microscopy.
Delivered by Ingenta to: 1. INTRODUCTION A controlled synthesis of size selected metal nanoparticles in a solution is one of the important subject in chemistry and physics of nanoscale materials.1–6 Nanoparticles have been widely studied because of their strong potential in the manufacture of biomedical products,7� 8 optical devices,9 and other industrial materials.10 Morphology control is expected to be one approach in the development of advanced materials. Recently, dendrimers, also known as starbust molecules, have attracted an increasing attention because of their unique structure and properties.11–13 Many interesting reactions using dendrimers have been reported because they can provide reaction sites including the interior or ∗
Author to whom correspondence should be addressed.
644
J. Nanosci. Nanotechnol. 2006, Vol. 6, No. 3
periphery of the dendrimers and are very useful as model systems.13 They also act as very effective protective agents for the preparation of gold nanoparticles as compared to conventional linear polymers.14 The preparation of dendrimer encapsulated gold nanoparticles includes the reduction of gold salt by using NaBH4 .15–17 Some studies18 have shown that ordered morphologies of gold nanoparticles can be achieved by the reduction of gold salt in the presence of surfactants. Apart from this, there are some reports where gold particles have been synthesized without using any reductant.19 Application of high temperature solution methods to obtain interesting shapes of semiconductor systems have also been applied.20� 21 The vapor deposition methods22 have resulted in the synthesis of hexagonal and pentagonal shapes of gold nanoparticles. Sau and Murphy18 have reported the synthesis of multiple shaped gold nanoparticles in aqueous solution at 1533-4880/2006/6/644/007
doi:10.1166/jnn.2006.123
Bakshi et al.
Morphologies of Gold Nanoparticles in the Presence of Poly(amidoamine) Dendrimers
2. EXPERIMENTAL DETAILS
CF3
N H
Freshly prepared HAuCl4 in aqueous solution (1 cm3 , 2 mmol dm−3 ) was added to 8.5 cm−3 of 2D in aqueous solution. The mixture was stirred for 30 minutes. The color of the reaction mixture was changed from golden yellow to dark brown. The final molar ratio of [dendrimer]/[Au3+ ] was 0.7 which seems to give better results. Here, the concentration of dendrimer was expressed as that of surface ester groups. The effect of surfactants on the formation of nanoparticles was estimated by varying surfactant J. Nanosci. Nanotechnol. 6, 644–650, 2006
a
N H CF3
2.1. Materials
2.2. Preparation of Gold-Dendrimer Nanoparticles
O CH 2CH 3
a
x
of Waterloo IP : 129.97.58.73 Fri, 03 Mar 2006 18:15:34
Poly(amidoamine) dendrimer of second generation (2G) was prepared by using ethylenediamine as an initiator core as described by Tomalia et al.26 Fluoroderivative of 2G (2D)25 was prepared by the reaction of 2G with ethyl4,4,4-trifluorocrotonate in anhydrous methanol. The purity of the sample was determined from 1 H NMR. The structures of 2G and 2D are shown in Scheme 1. DTAB, was synthesized as follows. 1-bromododecane was refluxed (80 � C) in the presence of 5–10% excess trimethylamine in dry ethanol for 48 h. The excess trimethylamine was used to ensure the completion of reaction. The surfactant, thus synthesized was recrystallised several times from acetone. The purity of the surfactant was checked by 1 H by Delivered 1 NMR using a Brucker AC 200E instrument. H NMR (CDCl3 ) �H : 3.60 (2H, t, –NCH2 –), 3.49 (9H, s, –NCH3 ), 1.43 (20H, m, –(CH2 )10 –), 0.90 (3H, t, –CH3 ). SDS 99%, from Aldrich, used as received. HAuCl4 was obtained from Acros. Water used was purified through double distillation.
O
RESEARCH ARTICLE
room temperature in the presence of surfactants. They have observed the structural architectures from rod-, rectangle-, hexagon-, cube-, triangle-, and star like gold nanoparticles in high yield. Nikoobakht and El Sayed23 mentioned that the formation of large particles of spherical dimensions could be overcome by the use of hexadecyltrimethyl ammonium bromide (HTAB). The nanorod formation can be controlled by appropriate control over surfactant concentration. Similarly, Mafune et al.24 demonstrated that smaller size gold particles can be obtained by increasing the concentration of sodium dodecylsulfate (SDS). In view of the above studies, we have in report the synthesis of gold nanoparticles by fluoroderivative of poly (amidoamine) dendrimers (2D),25 in the absence as well as in the presence of SDS and dodecyltrimethylammonium bromide (DTAB) without using any reductant. A relative comparison among the influence of SDS and DTAB has been discussed on the morphology and the size of gold nanoparticles. University
OCH3
O
y
2D
represents 2G with terminal H of NH2 substituted by ester groups 'x' and 'y' represents the ethyl ester and methyl ester groups, respectively. Scheme 1.
concentration from pre to post micellar regions in aqueous solution of 2D and HAuCl4 . For this purpose, several parallel reactions were carried out under identical conditions in which different amounts of surfactants were added so as to cover the pre- as well as post-micellar concenIngenta to: The color of the solution was dark purtration range. ple at low [SDS] = 2�2 to 17.6 mmol dm−3 , but fades at high [SDS] = 176 to 352 mmol dm−3 . In the case of DTAB, the color of solution was slightly purple at low [DTAB] = 31�6 mmol dm−3 and almost vanished at other higher concentrations. 2.3. Methods UV-visible spectra of solutions before and after the reduction of metal ions were measured by UV spectrophotometer (Perkin Elmer Lambda 25) in the wavelength range of 200–900 nm. The gold particles obtained were characterized by transmission electron microscopy (TEM). The samples were prepared by mounting a drop of solutions on a carbon coated Cu grid and allowing the drop to dry in air. They were observed with a Hitachi H-9000 NAR operating at 200 kV and with a direct magnification of 100000X. 645
Morphologies of Gold Nanoparticles in the Presence of Poly(amidoamine) Dendrimers
Bakshi et al.
3. RESULTS
Frequency /%
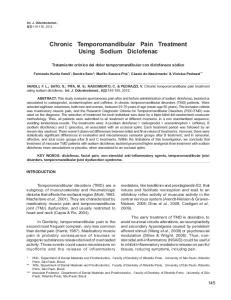
Figure 1 shows the UV-visible spectra of HAuCl4 + 2D in the absence as well as in the presence of varying amounts of SDS. The inset in Figure 1 demonstrates the presence of a very weak surface plasmon absorption band at � ≈ 520 nm corresponding to the gold nanoparticle formation in the absence of any surfactant which has already been observed by Esumi et al.19 The nanoparticles seen through TEM are shown in Figure 2a as TEM micrographs. Irregular shaped clusters made up of nanoparticles of variable sizes can be seen in this micrograph. Small nanoparticles of approximately 2–3 nm in each such cluster are quite visible and shown in Figure 2b. The nanoparticle formation has also been studied in different amounts of SDS covering pre to post micellar regions. Note the UV-visible spectrum of a solution con- of Waterloo University sisting of [SDS] = 2�2 mmol dm−3 (premicellar range) in IP : 129.97.58.73 Figure 1, where broad maximum at � ≈ 520 be 2006 18:15:34 Fri,nm03can Mar seen. The relative optical intensity of this broad maximum is much stronger as compare to blank experiment. The nanoparticles obtained in the presence of pre-micellar concentration of SDS have been shown in Figure 3a. This figure clearly shows different morphologies of nanoparticles such as triangular (�), rod shaped (�), and Fig. 2. (a) TEM micrograph of gold nanoparticles in the presence of hexagonal (�). The enlarge view of these morphologies 2D. (b) Enlarge view of small nanoparticles of 2D in a cluster. is clearly shown in Figure 3b. The average size distribution of these morphologies shows the average size is 50 Mean = 12.5 nm approximately 12.5 nm, while even much smaller and 40 few much bigger particles can also be seen. Further increase in the SDS concentration leading to post-micellar 30 region ([SDS] = 2 × cmc = 17�6 mmol dm−3 ) shows an
2D
Absorbance
20 10
Delivered by Ingenta to:
Absorbance
RESEARCH ARTICLE
3.1. Synthesis of Gold Nanoparticles in the Presence of SDS
0 0 5 10 15 20 25 30 35 40 45 50
Diameter (nm) (b)
Wavelength (nm)
[SDS] = 17.6 mmol dm–3 2D [SDS]= 176 mmol dm–3
Triangle
Rod
[SDS] = 2.2 mmol dm–3 [SDS] =352 mmol dm–3
Wavelength (nm)
Fig. 1. UV-visible spectra of HAuCl4 + 2D in the absence as well as in the presence of varying amount of SDS i.e., [SDS] = 2�2, 17.6, 176, 352 mmol dm−3 . The inset showed enlarge view of HAuCl4 + 2D in the absence of SDS.
646
Hexagonal
Fig. 3. (a) TEM micrograph and size distribution of gold nanoparticles of 2D at [SDS]= 2�2 mmol dm−3 . (b) Enlarge view of triangular (�), rod (�), and hexagonal (�) particles.
J. Nanosci. Nanotechnol. 6, 644–650, 2006
Bakshi et al.
Morphologies of Gold Nanoparticles in the Presence of Poly(amidoamine) Dendrimers
50 Mean = 22.5 nm
[DTAB] = 316 mmol dm–3
Absorbance
Frequency / %
40 30 20
[DTAB] = 632 mmol dm–3 2D [DTAB] = 6.0 mmol dm–3
10
[DTAB] = 31.6 mmol dm–3
0 0 5 10 15 20 25 30 35 40 45 50
Diameter (nm)
Wavelength (nm) Fig. 5. UV-visible spectra of HAuCl4 + 2D in the absence as well as in the presence of varying amount of DTAB i.e., [DTAB]= 6, 31.6, 336, 632 mmol dm.−3
3.2. Synthesis of Gold Nanoparticles in the Presence of DTAB The synthesis of gold nanoparticles has also been performed in the presence of DTAB. It is to be noted that this surfactant is having the hydrophobic tail of C12 carbon atoms, which is identical to that of SDS. Thus, this J. Nanosci. Nanotechnol. 6, 644–650, 2006
Fig. 6. (a) TEM micrograph of gold nanoparticles of 2D at [DTAB] = 6 mmol dm.−3 (b) (A) and (B) showed a small cluster of tiny nanoparticles and large cluster formed by the aggregation of small clusters.
647
RESEARCH ARTICLE
part deals with the synthesis of gold nanoparticles under the influence of only cationic head group effect. The UVvisible spectrum for the nanoparticle formation in the University of absence Waterloo and presence of DTAB is shown in Figure 5. Fig. 4. (a) TEM micrograph and size distribution of gold nanoparticles IP : 129.97.58.73 −3 In premicellar concentration of DTAB (i.e., DTAB = of 2D at [SDS] = 17�6 mmol dm . (b) Enlarge view of hexagonal parFri, 03 Mar 2006 18:15:34 ticles of 2D at [SDS] = 17�6 mmol dm.3 6 mmol dm−3 ), UV spectrum shows the formation of gold nanoparticle with relative broader maximum at � ≈ enhanced optical intensity of UV-visible spectrum in 520 nm which is though not very clearly seen in Figure 5. Figure 1. Corresponding TEM micrographs are presented Figure 6a clearly represents the formation of gold nanoparin Figure 4a. A comparison of nanoparticle of Figure 3a ticles, which mainly exist in the clusters of tiny nanoparand Figure 4a demonstrates an increase in SDS concenticles of average size 4–5 nm (Fig. 6b, A). At some tration from 2.2 to 17.6 mmol dm−3 , leads to a significant places these small clusters have merged with each other increase in the size, which is also depicted in the size and generate even larger clusters (see Fig. 6b, B). Further distribution profile (average size = 22�5 nm). An enlarged view (Fig. 4b) of this figure shows the presence of greater number of hexagonal particles in comparison to that of rod or triangular shaped. Interestingly, a large increase in SDS concentration (i.e., [SDS] = 20 × cmc = 176 mmol dm−3 ), reduces the optical intensity of UV-visible spectrum of this solution in Figure 1. This has been attributed to the clustering of nanoparticles (not shown), where each cluster is mainly made up of small particles. FurtherDelivered increase in by Ingenta to: the concentration of SDS i.e., [SDS] = 352 mmol dm−3 , significantly reduces the optical intensity of this solution at � ≈ 520 nm (Fig. 1). At the same time, the nanoparticle formation also drastically reduced with size distribution of the nanoparticles mainly remains equal to 6–7 nm (not shown), which might be due to the solubilization of 2D in the SDS micellar phase. A stronger micellar phase at (b) higher [SDS] would facilitate the partitioning of 2D at the micelle-solution interface, thereby reducing its probability to associate with gold nanoparticles.
Morphologies of Gold Nanoparticles in the Presence of Poly(amidoamine) Dendrimers
Bakshi et al.
the cluster formation and individual nanoparticle of size 2–3 nm can be seen in the TEM micrograph. A relative comparison among the size of gold nanoparticles of 2D in the presence of SDS and DTAB in pre and post micellar regions is clearly shown in Figure 8.
From the above results, one thing is clear that ordered morphologies of gold nanoparticles have been obtained in the presence of anionic surfactants, SDS, whereas no specific arrangement of the gold nanoparticles was visible in the presence of cationic surfactants, DTAB. It is therefore important to understand the mechanism of surfactant Fig. 7. TEM micrograph of gold nanoparticles of 2D at [DTAB] = participation in nanoparticle formation. We proposed the 31�6 mmmol dm.−3 following possible mechanism of reduction of gold salt by 2D dendritic macromolecules into Au(0). increase in the concentration of DTAB in the post micel−3 From literature, gold salts are reduced by ketones and lar region i.e., [DTAB] = 2 × cmc = 31�6 mmol dm as shown in following equation.27 leads to an increase in optical intensity of University UV-visible of acids Waterloo spectrum (Fig. 6) and the resulting nanoparticles IP :have 129.97.58.73 �AuX4 �− + RCOCH3 → �AuX2 �− + RCOCH2 X + HX been shown in Figure 7. Increase in DTAB concentraFri, 03 Mar 2006 18:15:34 tion from pre to post micellar region slightly increases In 2D (Scheme 1), both protons marked as ‘a’ are the size of nanoparticles (i.e., 7–8 nm) though they still expected to show such behavior. Subsequently, the presexist in the form of small clusters of tiny nanopartience of CF3 group would facilitate this due to its strong cles. Further increase in the concentration of DTAB at electron withdrawing capacity. The latter effect would help −3 ([DTAB] = 20 × cmc = 316 mmol dm ) leads to a sigin releasing the protons to convert Au(III) into Au(0) nificant reduction in the optical intensity of UV spectrum through Au(I). (Fig. 5) as well as reduces the size of the nanoparticles Regarding the ordered morphologies, recent studies23 (5–6 nm) (not shown). A much increase in DTAB conhave mentioned that surfactants generally act as soft temcentration ([DTAB] = 40 × cmc = 632 mmol dm−3 ) brings plates, the shape and size of template depend on the the UV spectrum almost close to the one in the absence surfactant concentration and ionic strength of the soluof DTAB (Fig. 5), and the TEM micrograph shows (not tion. Apart from this, the growth in nanoparticles has also shown), the formation of numerous tiny nanoparticles. been related to the concentration of gold ions, thus the These nanoparticles still mainly exist in clusters but withincrease in size of gold nanorods is practically related to out any sharp boundaries. It seems that increase in concenthe increase in concentration of gold ions.23 It is to be tration of DTAB up to 40 times cmc practically reduces mentioned here that in the present study the concentration Delivered by Ingenta to: and that of dendrimer remains same, while of gold ions 25 the concentration of the surfactant i.e., SDS and DTAB SDS has been varied from pre to post micellar regions to study DTAB cmcSDS = 8.8 mmol dm–3 the effect of surfactant concentration on the morpholo20 gies of gold nanoparticles. Our reference solution in the absence of surfactant clearly shows the formation of small 15 clusters of gold nanoparticles without any specific morphologies, however in the presence of pre-micellar concentration of SDS, clear hexagonal, and triangular shaped 10 nanoparticle formation takes place. That leads to the further self-aggregation of these particles into smaller clusters 5 in the post-micellar region. It seems that at low concentration of SDS, the triangular nanoparticles were formed cmcDTAB = 15.8 mmol dm–3 by the adsorption of dendrimer-surfactant complex on gold 0 0 100 200 300 400 500 600 700 nanoparticle surface (Scheme 2, e). However, at high con[surfactant] / mmol dm–3 centration of SDS, more efficient packed structural morphology was obtained. Thus, hexagonal nanoparticles were Fig. 8. Plot of size of 2D nanoparticles versus surfactant i.e., [SDS] = −3 observed with six molecules of dendrimer-surfactant com0, 2.2, 17.6, 176, 352 mmol dm , and [DTAB] = 0, 6, 31.6, 316, 632 plex adsorbed on the gold nanoparticles (Scheme 2, d). mmol dm,−3 respectively. size / nm
RESEARCH ARTICLE
4. DISCUSSION
648
J. Nanosci. Nanotechnol. 6, 644–650, 2006
Bakshi et al.
Morphologies of Gold Nanoparticles in the Presence of Poly(amidoamine) Dendrimers
+ 2D
SDS monomer
(a)
(b)
gold nanoparticle Scheme 2.
The proposed explanation regarding the appearance of ordered morphologies can be related to the fact that the size of gold nanoparticles with various ordered morphologies has already been found to be quite large i.e., in the range of 60–100 nm.18 It is to be mentioned that the size of dendritic ball of 2G PAMAM dendrimer in complex with the surfactant monomer as mentioned in Scheme 2, c is expected to be around 4–5 nm.28 It can be verified from the mathematical calculations according to which the surface area of gold nanoparticle morphology corresponds to hexagonal arrangement when six SDS-2D complexes (with by Delivered approximate size 5–10 nm) cover the surface area of gold hexagonal nanoparticle. Hence, we assume that each SDS2D complex is a soft matter solubilized in the aqueous phase and hence no void spaces are available. On the contrary, nanoparticles of no specific shapes have been observed in the pre-micellar region of DTAB except small clusters of tiny nanoparticles. The density of the nanoparticles in the solution decreases significantly in the post-micellar concentrations. However, recent studies18 have shown that use of HTAB resulted in the synthesis of very fine nanoparticles of specific shapes. Both DTAB and HTAB belong to the common category of alkyl ammonium cationic surfactants, therefore, same kind of morphologies of nanoparticles might be expected in the presence of both surfactants. However, the absence of any ordered morphology of gold nanoparticles in the presence of DTAB can be attributed to weak DTAB-dendrimer interactions.29–32 Hence, it seems that dendrimer-surfactant J. Nanosci. Nanotechnol. 6, 644–650, 2006
5. CONCLUSIONS The following conclusions can be made from this study 1. The present results clearly show the formation of gold nanoparticles by reducing Au(III) to Au(0) by fluoroderivative of 2G poly(amidoamine) dendrimer. 2. The presence of SDS leads to the ordered morphologies of gold nanoparticles, the origin of which is attributed to the favorable SDS-PAMAM interactions. The adsorption of SDS-2D complex on the surface of gold nanoparticles is expected to be responsible for ordered morphologies. 3. The presence of DTAB does not induce any ordered morphology, while on the contrary it reduces the size of Ingenta to: gold nanoparticles as well as their density in the aqueous phase. The increase in the concentration of DTAB makes this effect even more significant.
References and Notes 1. B. V. Enustun and J. J. Turkvich, J. Am. Chem. Soc. 85, 3317 (1963). 2. M. V. T. Kortennar, Z. I. Kolar, and F. D. Tichelaar, J. Phys. Chem. B 103, 2054 (1999). 3. C. Petit, P. Lixon, and M. P. Pileni, J. Phys. Chem. 97, 12974 (1993). 4. M. P. Pileni, Langmuir 13, 3266 (1997). 5. B. E. Baker, N. J. Kline, P. J. Treado, and M. J. Naten, J. Am. Chem. Soc. 118, 8721 (1996). 6. J. M. Petroski, Z. L.Wang, T. C. Green, and M. A. El-Sayed, J. Phys. Chem. B 102, 3316 (1998). 7. T. Akagi, M. Kawamura, M. Ueno, K. Hiraishi, M. Adachi, T. Serizawa, M. Akashi, and M. Baba, J. Med. Virol. 69, 163 (2003). 8. B. Rihova, Adv. Drug Delivery Rev. 54, 653 (2002). 9. R. C. Hayward, D. A. Saville, and I. A. Aksay, Nature (London) 404, 56 (2000). 10. T. Okubo, Prog. Polym. Sci. 18, 481 (1993).
649
RESEARCH ARTICLE
(d)
interactions significantly influence the nanoparticle formation with the result of which aggregated morphologies of nanoparticles are being influenced. Solution properties of dendrimer-surfactant interactions demonstrated that anionic surfactants like SDS has maximum interactions with the dendritic balls, followed by nonionic, and then by cationic.33 The origin of strong interactions between SDS 2D-SDS complex and dendritic ball seems to be based upon electrostatic (c) interactions operating between electronegative anionic surfactant head groups and protonated surface ester groups Au(0) Au(0) of 2D. Such interactions are not expected in the case of DTAB due to its cationic surfactant nature. Therefore, the formation of ordered morphologies in the presence of SDS can be attributed to the adsorption of larger 2DSDS complexes on the surface of gold nanoparticles. On the contrary, the weaker interactions between 2D-DTAB keep the dendrimer and monomeric/micellized surfactant mainly in the unassociated state without the formation of ordered morphology. Furthermore, bromide counteriUniversity of any Waterloo 3+ ons are IP : 129.97.58.73 expected to be associated with Au ions electro(e) statically, thus reducing further the probability of cluster Fri, 03 Mar 2006 18:15:34 formation.
RESEARCH ARTICLE
Morphologies of Gold Nanoparticles in the Presence of Poly(amidoamine) Dendrimers 11. J. F. G. A. Jansen, E. E. M. de-Brabander-van der Berg, and E. Meijer, W. Science 266, 1226 (1994). 12. A. I. Cooper, J. D. London, G. Wignall, J. B. McClain, E. T. Samulski, J. S. Lin, A. Dobrynin, M. Rubinstein, A. l. C. Burke, J. M. J. Frechet, and J. DeSimone, M. Nature 389, 368 (1997). 13. F. Zeng and S. C. Zimmerman, Chem. Rev. 97, 1681 (1997). 14. K. Esumi, A. Suzuki, C. M. Paleos, and D. Tsiourvas, Langmuir 14, 3157 (1997). 15. L. Balogh and D. A. Tomalia, J. Am. Chem. Soc. 120, 7355 (1998). 16. M. E. Garcia, L. A. Baker, and R. M. Crooks, Anal. Chem. 71, 256 (1999). 17. M. Zhao and R. M. Crooks, Adv. Mater. 11, 217 (1999). 18. T. K. Sau and C. J. Murphy, J. Am. Chem. Soc. 126, 8648 (2004). 19. K. Esumi, T. Hosoya, A. Suzuki, and K. Torigoe, Langmuir 16, 2978 (2004). 20. X. Peng, L. Manna, W. D. Yang, J. Wickham, E. Scher, A. Kadavanich, and A. P. Alivisatos, Nature 404, 59 (2000). 21. L. Manna, E. C. Scher, and A. P. Alivisatos, J. Am. Chem. Soc. 122, 12700 (2000). 22. A. Renou and M. Gillet, Surf. Sci. 106, 27 (1981). 23. B. Nikoobakht and A. M. El-Sayed, Chem. Mater. 15, 1957 (2003). University
Bakshi et al.
24. F. Mafune, J. Kohno, Y. Takeda, and T. Kondow, J. Phys. Chem. B 105, 5114 (2001). 25. S. W. Jeong, D. F. O’Brien, G. Oradd, and G. Lindblom, Langmuir 18, 1073 (2002). 26. D. A. Tomalia, H. Baker, J. R. Dewald, M. Hall, G. Kallos, S. Martin, J. Roeck, J. Ryder, and P. Smith, Polymer. J. 17, 117 (1985). 27. (a) G.-J. Lee, S.-I. Shin, Y.-C. Kim, and S.-G. Oh, Mater. Chem. Phys. 84, 197 (2004); (b) Abstracts for the XIIth World Congress of Psychiatric Genetics, Am. J. Medi. Genetics, 130, 1 (2004); (c) Griffth Chemistry, Synthesis of Cu, Ag, and Au complexes (Griffth University, Google, Healy Research htm.) 28. X. Li, T. Imae, D. Leisner, and M. Arturo Lopez-quintela, J. Phys. Chem. B 106, 12170 (2002). 29. M. S. Bakshi, A. Kaura, J. D. Miller, and V. K. Paruchuri, J. Coll. Interf. Sci. 278, 472 (2004). 30. M. S. Bakshi and A. Kaura, J. Coll. Interf. Sci. 284, 680 (2005). 31. M. S. Bakshi, A. Kaura, R. K. Mahajan, T. Yoshimura, and K. Esumi, Coll. Surf. A 246, 39 (2004). 32. M. S. Bakshi and A. Kaura, Coll. Surf. 244, 45 (2004). 33. S. M. Ghoreishi, Y. Li, F. J. Holzwarth, E. Khoshdel, J. Warr, D. M. Bloor, and E. Wyn-Jones, Langmuir 15, 1938 (1999). Waterloo
of IP : 129.97.58.73 Received: October 2005. Revised/Accepted: 5 December 2005. Fri, 03 Mar 2006 13 18:15:34
Delivered by Ingenta to:
650
J. Nanosci. Nanotechnol. 6, 644–650, 2006