3286
JOURNAL OF THE ATMOSPHERIC SCIENCES
VOLUME 56
Effects of Critical Levels on Two-Dimensional Back-Sheared Flow over an Isolated Mountain Ridge on an f Plane BO-WEN SHEN
AND
YUH-LANG LIN
Department of Marine, Earth, and Atmospheric Sciences, North Carolina State University at Raleigh, Raleigh, North Carolina (Manuscript received 2 February 1998, in final form 28 December 1998) ABSTRACT It is well known that there exist three singular points, U 2 c 5 6 f/k and U 5 c, where the corresponding levels will be called inertia critical levels (ICLs) and the classic critical level (CCL), in the equation governing a two-dimensional, rotating, continuously stratified, hydrostatic, back-sheared Boussinesq flow. Here U and c are basic wind and phase speed, respectively; f is the Coriolis force; and k is the wavenumber. The effects of these critical levels on flows over an isolated mountain ridge are investigated both analytically and numerically, based on a broad range of Rossby numbers (R o ) and Richardson numbers (R i ). Each wave mode generated from the isolated mountain with a continuous spectrum has its own ICL. To indicate the net effects of all ICLs, the authors define the effective ICL as the height above which the amplitude of the inertia-gravity wave mode is very small. The findings for linear flows are summarized as follows. Regime I is inertia-gravity waves. The flow behaves like unsheared inertia-gravity waves and the effective lower ICL plays a similar role as the CCL does in a nonrotating flow. Regime II is combined inertia-gravity waves and baroclinic lee waves. These waves behave like those in regime I below the lower effective ICL, and like baroclinic lee waves near the CCL. In this regime, the horizontal warm advection by the baroclinic lee wave plays an important role in the formation of the lee pressure trough. On the other hand, near the downslope of the mountain, both the warm advection by the inertia gravity and the adiabatic warming also contribute significantly to the lee trough. Therefore, Smith’s quasigeostrophic theory of lee cyclogenesis is extended to a nongeostrophic regime. Regime III is combined evanescent and baroclinic lee waves. These waves still behave like baroclinic lee waves near the CCL, but they are trapped near the surface. Regime IV is transient waves. Nongeostrophic baroclinic instability exists, as evidenced by the positive domain-averaged north–south heat flux. There exists no steady state. At earlier times, the flow behaves like trapped baroclinic lee waves. For a relatively large R i (e.g., R i . 25), the flow falls into regime I when R o is relatively large (e.g., R o $ 2). It then shifts to regime II, and finally to regime III as R o decreases. For a relatively small R i (e.g., R i , 25), the flow shifts from regime I to II, and then finally to regime IV when both R o and R i decrease.
1. Introduction In a nonrotating fluid system, a critical level, where the gravity wave phase speed is equal to the basic wind speed, may exist. Mathematically, a singularity is present in the governing equation at the critical level. Bretherton (1966) and Booker and Bretherton (1967) found that the local vertical wavenumber increases and wave absorption occurs when the wave approaches the critical level. In addition, for flows over an isolated mountain, Smith (1986) pointed out that when the Richardson number (R i ) is considerably greater than ¼, the flow behaves as it does in the unsheared problem as described in Queney (1948) and Smith (1979a). The nonlinear aspects of the critical-level problem in an adiabatic flow
Corresponding author address: Dr. Yuh-Lang Lin, Department of Marine, Earth, and Atmospheric Sciences, North Carolina State University at Raleigh, Box 8208, Raleigh, NC 27695-8208. E-mail:
[email protected]
q 1999 American Meteorological Society
have been studied by several authors in the last three decades [see Maslowe (1986) for a review]. The nonlinear effects become more and more important as one approaches the critical level, since the perturbation wind speed may easily exceed the basic wind speed. In studies of mountain waves, the nonlinear effect has been shown to play an important role in generating severe downslope windstorms in a wave-induced shear layer with a critical level (e.g., Clark and Peltier 1984; Smith 1985; Durran 1986). However, the singularities of a rotating fluid system differ from those of a nonrotating system. Jones (1967) was the first to try to solve this problem. He found that the vertical transport of angular momentum by inertia– gravity waves is independent of height, except at the critical levels at which the Doppler-shifted frequencies are equal to 6 f, where f is the Coriolis parameter. These levels were called Jones’s critical levels by Yamanaka and Tanaka (1984), inertial wave critical levels by Smith (1986), and Rossby singular levels by Wurtele et al. (1996). In our study, the three steady-state singular lev-
15 SEPTEMBER 1999
SHEN AND LIN
els will be referred to as the lower inertia critical level (ICL) at U 5 f/k, the classic critical level (CCL) at U 5 0, and the upper ICL at U 5 2 f/k. Yamanaka and Tanaka (1984) found that there exist two important characteristics associated with the critical levels in the inertia-gravity wave problem. One is the valve effect across the Jones’s critical level, and the other is the presence of a pair of turning levels between the Jones’s critical levels. Waves between the turning levels are nonpropagating. As R i → `, the turning level and Rossby singular level tend to merge. They investigated the behavior of waves that reach the Jones’s critical level from the lower layer, but did not discuss the effect of different wind shear with different R i . Wurtele et al. (1996) studied the wave propagation properties when an inertia-gravity wave propagates upward to all three singular levels. For an incident monochromatic wave, they pointed out that the Rossby singularities can absorb wave energy in linear simulations but tend to reflect wave energy in nonlinear simulations. However, they found that the flow patterns are different when the spectrum of the forcing is continuous. In this case, the problem is essentially linear, and Rossby singular levels for each component are no longer singular due to the cancellation among different wave components. The latter was first shown by Eliassen (1969). Also, Wurtele et al. showed that for sheared flows, the flow patterns still exhibit differences between nonrotating and rotating systems, although R o in the rotating system may be relatively large (e.g., R o 5 10 with a 5 10 km, f 5 1024 s21 , and U o 5 10 m s21 in their study). Near the CCL, where waves are nonpropagating, Grimshaw (1975) pointed out that the solution at that level is always regular if f is held constant. However, if f is not constant and varies with y, CCL is again a singular level (e.g., Miyahara 1981). The CCL for a neutral Eady mode is called a steering level (e.g., Gill 1982). This singular level for quasigeostrophic (QG) flow is called a Rossby wave critical level (e.g., Dickison 1970). In this study, we will assume a constant f. Because the wind speed is small near the CCL, the assumption of f/Uk k 1 is valid. Under this assumption, the governing equation is reduced to the QG Eady model, which excludes the lower and upper ICLs. The equivalent QG potential vorticity equation has been used to study lee cyclogenesis by Smith (1984, 1986). A cat’seye flow pattern was found near the wind reversal height (H) for a steady, small Rossby number, back-sheared flow. Smith called this mode a baroclinic lee wave, which can be regarded as an orographically forced neutral Eady wave with a resonant wavenumber k* 5 f/NH where N is the Brunt-Va¨isa¨la¨ frequency and H is the wind reversal level. He further proposed a theory of lee cyclogenesis that views lee cyclogenesis as the formation of the first trough of a standing baroclinic lee wave. When lee cyclogenesis occurs, the atmospheric environment baroclinically supports a free-standing baroclinic wave. Smith’s view that the lee cyclone is oro-
3287
graphically forced in its early stage, rather than a triggered instability, agrees with the numerical results of Tosi et al. (1983). For nongeostrophic (NG) systems, Smith (1986) pointed out that there exist two Rossby numbers, R o1 5 U/af and R o2 5 Uk*/ f, and conjectured that the lower ICL tends to prevent lee wave development. Bannon and Zehnder (1989) showed that nongeostrophic effects become important for a high mountain, even though their results are consistent with those in Smith (1984) for a low mountain. In solving a semigeostrophic initial-value problem with a critical level, they showed that the development of a baroclinic lee trough is stronger and narrower than that in a QG theory. Lin and Perkey (1989) extended Smith’s work using a nonlinear numerical model. They concluded that Smith’s theory is valid at least in the early stages of cyclogenesis. The flow-splitting effect due to higher mountains and boundary layer effects were also investigated in their study. Lin (1989) proposed a QG cyclogenesis theory for a back-sheard flow with a critical level over a diabatic heat source. He found that an analogy exists for a QG flow over a mountain and over a region of steady diabatic heating. A nonlinear QG calculation performed by Scha¨r (1990) suggests that Smith’s mechanism may produce an initial perturbation on the scale of a baroclinic lee wave within a relatively broad baroclinic frontal zone, as the latter is deformed and retarded by the mountain. Although these authors have proven that Smith’s theory can be applied to some realistic cases, however, it is questionable to apply the theory to the Alpine area where R o ; 0.5 (e.g., Bannon and Zehnder 1989). Thus, we believe that the theory deserves to be extended into the NG flow regime (i.e., R o $ 0.5). Although Wurtele et al. (1996) have investigated the effects of critical levels on flows with relatively large R o and R i for an isolated mountain, and Smith (1986) has solved the QG problem for small R o , the effects of these critical levels on flows characterized by moderate R o and small R i are still not well understood. Also, smaller-scale NG instability shown in Stone (1966, 1970) and Nakamura (1988) has not been found in the above-mentioned study. Our study will be based on relatively broad ranges of R o and R i and will only focus on linear responses. In section 2, a linear theory will be developed, and a comparison between semianalytical and analytical solutions will be made. The former can represent the NG flow solutions of different length scales, while the latter have been solved by other authors under certain conditions. These solutions show the local behavior of the flow near three critical levels. To understand the global behavior, we perform a number of idealized two-dimensional numerical simulations. Section 3 describes the numerical model, and section 4 discusses the results. Based on the numerical simulations, four wave regimes will be proposed. Concluding remarks can be found in section 5.
3288
JOURNAL OF THE ATMOSPHERIC SCIENCES
2. Semianalytical solutions For a two-dimensional, inviscid, Boussinesq flow on an f plane, the linearized equation governing the vertical velocity perturbation (w) can be written (e.g., see Lin 1994)
1
2
D D2 2 D ¹ w 1 f 2 wzz 2 Uzz wx 1 N 2 wxx 2 2f 2 Uz wxz 2 Dt Dt Dt 5 0,
(1)
where D/Dt 5 ]/]t 1 U(z)]/]x. The energy equation with the horizontal and vertical integrations over a certain domain may also be derived (see Lin 1994): ]E T 52 ]t
E E E L/2
2L/2
0
zT
[
U
]
]E T ] 1 ( pu) dz dx ]x ]x
zT
2 ro
uwUz dz 1
0
1
ro gf N 2Q
2E
yu Uz dz
1
2
2
1
(4)
and can be explained as the vertical divergence of energy flux (]pw/]z), which consists of both momentum and heat fluxes. After a straightforward derivation for a single Fourier mode (e.g., Smith 1979b), we obtain (5)
Substituting (5) into Eq. (4) yields
Here, E T 5 (r o /2)[u 1 y 1 (gu /NQ) ] is the domainintegrated total perturbation energy; L and z T the width and height of the domain, respectively; and u, y , and u the zonal and meridional perturbation winds, and the perturbation potential temperature, respectively. The overbar indicates the average of a variable in the x direction. The term on the left-hand side of the above equation represents the local time rate of change in the total perturbation energy contained in the system. The first term on the right-hand side represents the sum of the advection of total energy and the horizontal energy flux. The second term on the right-hand side represents the energy production due to vertical momentum flux transfer associated with the basic wind shear, and the third term represents the north–south heat flux transfer between the basic state and the perturbation. The fourth term is the forcing exerted by the top boundary, which is negative if a radiation upper boundary condition is applied. The last term represents the forcing exerted by the lower boundary. We will use this equation to analyze the transient results of section 4. If the flow is steady, then the Fourier transform of Eq. (1) in the x direction becomes
2
f2 2f 2 U 2N 2 Uzz 21 w ˆ zz 2 2 3z w ˆz 1 1 w ˆ 5 0. 2 k U k U U2 U 2
] gf pw 5 2ro Uz uw 1 ro Uz 2 yu ]z N uo
0
(2)
2
soscale waves, which are in between long and short waves, the ICLs are distinct from the CCL. For example, if f 5 1024 s21 and U z 5 0.004 s21 , which are used in Smith’s (1986) theory near the Alps, the height differences between the ICLs and CCL are 398 and 1990 m for l 5 100 and 500 km, respectively. The steady-state form of the energy equation [Eq. (2) without vertical integration] is
gf f2 yu 5 2 2 uw. 2 N uo U k
zT
2 pw(z T ) 1 pw(0). 2
VOLUME 56
(3)
It can be seen from the above equation that three singular points, that is, U 5 0 and U 5 6 f/k. In the following, we will use the lower and upper ICLs to identify the levels at which U 5 f/k and U 5 2 f/k, respectively. The critical level corresponding to U 5 0 will be called the CCL. For long waves, these ICLs are far from the CCL, while for short waves, these ICLs are located very close to the CCL. However, for me-
1
2
] f2 pw 5 2ro Uz 1 2 2 2 uw. ]z U k
(6)
Thus, the term f 2 /U 2 k 2 can be regarded as the ratio of heat flux to momentum flux. The heat flux is greater or less than the momentum flux when f 2 / U 2 k 2 . 1 or f 2 /U 2 k 2 , 1, respectively. When U and f are fixed, the heat flux becomes dominant if k is smaller; that is, the heat flux is more important for long waves. Similarly, from the equation of motion in the x direction, the vertical energy flux (pw) may be written as
1
pw 5 2ro U 1 2
2
f2 uw. U 2k2
(7)
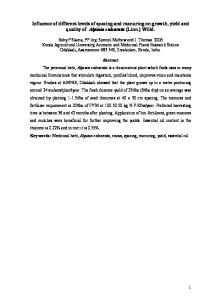
This is a generalized form of Eliassen and Palm’s (1960) theorem (e.g., Andrew and McIntyre 1976). Equation (7) provides the basis to apply an upper radiation condition and will be used in section 2b. In all cases presented in this study, we assume the basic wind to be U 5 (U o /H)(H 2 z), where U o is the surface wind and H is the height of wind reversal, as shown in Fig. 1. Notice that this basic wind has a constant linear shear, 2U o /H. a. Discussion of existing analytical solutions In this section, we discuss analytical solutions for nonrotating and QG flows. These solutions have been obtained by others for nonrotating flows. However, for QG flows we use a different mathematical approach to obtain solutions and discuss how for small R i the solutions are still valid. These analytical solutions can help verify our semianalytical solutions, which can be solved for flows with a wide range of R i and R o and will be discussed in the next section. ‘‘Semianalytical’’ means that analytical solutions in Fourier space are transformed back to physical space numerically.
15 SEPTEMBER 1999
3289
SHEN AND LIN
theory by using a different approach, as well as verify his solutions for a moderate R i . For flows near the CCL, where Uk/ f K 1, Eq. (3) becomes w ˆ zz 2
FIG. 1. Basic wind profile. Here H is the height of wind reversal and U o is the surface wind.
1) NONROTATING
FLOWS
If the Coriolis force is neglected, Eq. (3) becomes w ˆ zz 1
Ri w ˆ 5 0. (H 2 z) 2
(8)
Following the procedure described in Smith (1986), and using the Frobenius series method (e.g., Kreyszig 1988), the steady-state solutions can be obtained: w5
ahÏz 1 Uo e2pm
for z . H, 2ahÏz 2 Uo (a 1 x ) 2
2 2
3 [(a 2 2 x 2 ) sin(m lnz 2 ) 2 2ax cos(m lnz 2 )] for 0 # z # H,
(10)
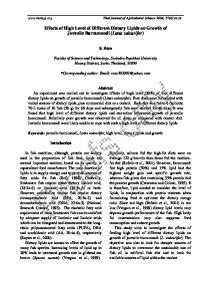
where z1 5 (z 2 H)/H, z2 5 (H 2 z)/H and m 2 5 R i 2 ¼. Figures 2a and 2b show the perturbation vertical and horizontal velocities with R i 5 6.25. The solutions indicate that waves cannot penetrate through the CCL, which is the height of wind reversal for steady-state flow, and the streamlines exhibit (not shown) an overturning region near the critical level, as shown in Smith (1986). 2) QUASIGEOSTROPHIC
w(x, z) 5 4phˆ (k*)
Uo Nk*3 2z /H* ze cos(k*x), f
1
FLOWS
Smith’s (1984, 1986) theory for lee cyclogenesis is based on the QG assumption which is valid for small Rossby number, and large Richardson number only (e.g., Nakamura 1988). However, the wind shear in Smith’s study has a moderate R i (i.e., 6.25 corresponding to U z 5 0.004 s21 ). In this section, we solve Smith’s
u 5 4phˆ
(12)
2
Uo Nk*2 z 2z /H* 12 e f H
3 sin(k*x), (9)
(11)
From the above equation, it is obvious that inertia critical levels have been analytically eliminated, and the solutions exhibit evanescent modes1 for all wavenumbers. Equation (11) can be derived starting with either a linear QG system or a weakly NG system that includes wU z but neglects Du a /Dt in the equation of motion (see appendix A for details). That is, the equations governing the vertical velocity for both the linear QG system and weakly NG system are identical, although equations governing other fields for these two systems may not be the same. Therefore, we can easily obtain the solution of the vertical velocity for the weakly NG system if we know the solutions for the QG system. Afterward, we can investigate the effect of wU z on other fields when the R i is small or moderate, which is associated with strong wind shear. Following Smith’s (1984) procedure, we can obtain the solutions for each variable:
u(x, z) 5 24phˆ (k*)
(a 2 1 x 2 ) 2 3 [(x 2 2 a 2 ) cos(m lnz 1 ) 2 2ax sin(m lnz 1 )]
w5
2Uz k2 N 2 w ˆz 2 w ˆ 5 0. U f2
(13)
1
2
uo Nf 1 2 z /H 2z /H* 11g e gH Ri
3 sin(k*x),
1
p 5 24phˆ rNf 1 2 g
(14)
2
z /H 2z /H* e sin(k*x). Ri
(15)
With g 5 0, which excludes wU z , the above solutions are called a baroclinic lee wave with a resonant wavenumber k* 5 f/NH by Smith (1984, 1986). For the lee wave, the condition of Uk/ f K 1 leads to NH/U k 1 because of k 5 f/NH. The latter is equivalent to R i k 1 in our system. Therefore, the above solutions are valid only when R o K 1 and R i k 1.2 Thus, the question is, can we determine the criterion for R i to satisfy the assumption of R o K 1? In Eqs. (14) and (15), only small R i corresponding to larger wU z can affect the magnitude of mass fields ( p and u). With a choice of O(z/H) # 1 for Uk/ f K 1, the effect of wU z can be neglected when
1 ˆ zz 2 (2U 2 /U 2 1 N 2 k 2 / f 2 )W ˆ 5 Equation (11) can be written as W ˆ exp(# U z /U dz). 0, where wˆ 5 W 2 If we define R o 5 U o k/ f, R o K 1 leads to Ï R i k 1 for lee waves.
3290
JOURNAL OF THE ATMOSPHERIC SCIENCES
VOLUME 56
FIG. 2. Analytical solutions for nonrotating flow with a critical level: (a) vertical velocity and (b) horizontal velocity perturbation. The basic-state flow parameters are U o 5 20 m s21 , H 5 5000 m, N 5 0.01 s21 , h m 5 500 m, and a 5 100 km (R o 5 `, R i 5 6.25). The symbol ‘‘int’’ means contour interval and unit is m s21 . [Replotted from Smith (1986)].
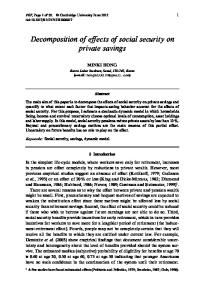
R i . 10. We may therefore conclude that the local behavior for flows with R i . 10 near the CCL, where Uk/ f K 1, is governed by the linear QG dynamics. Thus, the choice of R i 5 6.25 in a QG model by Smith (1986) still seems reasonable. Figure 3 shows the results of u and w [Eqs. (12) and (13)] with R o 5 0.2 and R i 5 25. It can be seen that the w maximum occurs at the height of wind reversal (z 5 H). The streamline field of total wind (not shown) contains a cat’s-eye near the level of wind reversal, as found by Smith (1986).
For an NG flow, it is very difficult to solve Eq. (3) analytically. Recently, Wurtele et al. (1996) solved this type of problem analytically. However, they did not discuss flow responses for small R i and moderate R o . In this section, we will try to solve Eq. (3) semianalytically for wider ranges of R i and R o . Equation (3) may be transformed into an alternative form by letting h 5 (kU/ f ) 2 :
h(1 2 h)w ˆ hh
(16)
This is a hypergeometric equation that has regular singularities at h 5 0, 1, and ` (e.g., Mathews and Walker 1970). Miles (1964), Yamanaka and Tanaka (1984), and Wurtele et al. (1996) recognized the Gauss hypergeometric function to be the eigenfunction of the above equation. The hypergeometric function is defined as ab F(a, b, c; h) 5 1 1 h c31 1
a(a 1 1)b(b 1 1) 2 h 1 · · ·. c(c 1 1) 3 1 3 2
for |h | . 1, w ˆ 1 5 h (1/4)2(i/2)m F
1 4 1 2 m, 4 1 2 m, im 1 1; h 2 , 21
i
5
i
21
w ˆ 2 5 h (1/4)1(i/2)m 3F
1 4 2 2 m, 4 2 2 m, 2im 1 1; h 2 ; 21
i
5
i
21
(18)
for |h | . 1,
b. Semianalytical solutions
1 R 2 (1 1 h)w ˆ h 2 iw ˆ 5 0. 2 4
Two linearly independent solutions in the neighborhood of these singularities are, respectively, given by
(17)
1 4 1 2 m, 4 1 2 m, 1; 1 2 h 2 , 21 i 3 i F1 2 m, 2 m, 1; 1 2 h 2 ; 4 2 4 2 21
w ˆ 3 5 h (1/4)2(i/2)m F w ˆ 4 5 h (1/4)1(i/2)m
i
5
i
21
21
(19) for |h | . 0, w ˆ5 5 F
14
21
2
i 21 i 21 1 m, 2 m, ;h , 2 4 2 2
w ˆ 6 5 h 3/2 (1 2 h) (25/4)2(i/2)m 3F
14 1 2 m, 4 1 2 m, 2 ; (1 2 h)2 . 5
i
5
i
5
h
(20)
In the following, we will apply a fast Fourier transform (FFT) algorithm and the path integration (e.g., Press et al. 1990) to calculate these solutions, which will be referred to as the semianalytical solutions. For h . 1 (outside the ICLs), we choose wˆ1 if k . 0 and wˆ 2 if k , 0:
15 SEPTEMBER 1999
SHEN AND LIN
3291
FIG. 3. Analytical solutions for quasigeostrophic back-sheared flow. Parameters are the same as Fig. 2 except for f 5 1023 s21 and N 5 0.02 s21 (R o 5 0.2, R i 5 25): (a) vertical velocity perturbation and (b) horizontal velocity perturbation. [Replotted from Smith (1984)].
w5
E
2`
E
`
0
w ˆ 2 e ikx dk 1
w ˆ 1 e ikx dk.
(21)
0
Wurtele et al. (1996) mentioned that this choice can satisfy the upper radiation condition (i.e., pw . 0 as z → `). This is true if the hypergeometric function is a real function under certain conditions. However, in general, the hypergeometric function is a complex function. By using the subroutine ‘‘HYPGEO’’ described in Press et al. (1990), we calculate wˆ1 and wˆ 2 in (k, z) domain for h . 1. Afterward, we obtain w in the physical space. Moreover, based on the two-dimensional Fourier analysis (see appendix B for details), we will examine whether this condition really allows energy to propagate upward or not. For an isolated mountain forcing, a continuous spectrum of wave modes are generated. This indicates that individual wave modes have their own ICLs at different heights. To compare the responses between nonrotating and rotating flows over an isolated mountain, we define the effective ICL as the height above which the summation of the amplitudes for the inertia-gravity wave modes are very small. First, we will verify the above numerical method by calculating the semianalytic solutions using a very small Coriolis parameter (10210 s21 ) and compare them with the analytical solutions for a nonrotating fluid. Figure 4a shows that the semianalytical solution is in very good agreement with the analytic solution (Fig. 2a). The role of the lower effective ICL at z 5 5 km in a rotating flow is similar to that of CCL for a nonrotating flow. The semianalytical vertical velocity field [Eq. (18)] below the lower effective ICL for a steady flow with R o 5 4 and R i 5 6.25 is shown in Fig. 4b. The flow response behaves like unsheared inertia-gravity waves with energy dispersion in the x direction (e.g., Queney 1948; Eliassen and Thorsteinsson 1984; Trub and Da-
vies 1995). Although the lower effective ICL acts to inhibit upward wave propagation, the perturbation wave energy can propagate downstream as the Coriolis force increases (Fig. 4c). From Figs. 4a–c, we can easily see that the height of the lower effective ICL decreases as R o increases. One may also find the phase lines below the lower effective ICL to the left of the mountain tilt upshear (to the right with height) in Figs. 4b and 4c. These features may not satisfy the upper radiation condition. Applying the ‘‘radiation condition’’ based on a two-dimensional Fourier transform, we can eliminate the upshear phase tilt, as shown in Fig. 4d, in which we use the same parameters as those in Fig. 4c. From these two figures, we can see that the unreasonable negative vertical velocity in the layer below the lower effective ICL upstream can be avoided. Moreover, the height of the lower effective ICL in Fig. 4d is higher than that in Fig. 4c. Numerical simulations (section 4) will show that Fig. 4d is more accurate than Fig. 4c. The choice of the solution to satisfy the upper boundary condition in Fig. 4c is the same as that used by Wurtele et al. (1996). Thus, we may conclude that the upper boundary condition used by Wurtele et al. (1996) is not suitable for flow with a small R i (say R i # 6.25). More discussions for different R i and R o will be given in section 4. For QG flows, the semianalytical (Fig. 4e) and analytical solutions (Fig. 3a) with R o 5 0.2 and R i 5 25 are very similar, except for the slight phase shift. Near the topography, the semianalytic solution is more accurate than the analytic solution, since the latter can only be applied far downstream due to the limitation of lee-wave theory (e.g., Scorer 1949). Wurtele et al. (1996) have not solved this problem. Moreover, the response of a weakly rotating system (R o 5 0.8 and R i 5 6.25) near the CCL (not shown) is still similar to trapped baroclinic lee waves.
3292
JOURNAL OF THE ATMOSPHERIC SCIENCES
VOLUME 56
FIG. 4. Semianalytical solutions for the perturbation vertical velocity w for (a) nearly nonrotating flows (parameters are the same as those in Fig. 2 except f 5 10210 s21 ); (b) rotating flows with f 5 0.000 05 s21 corresponding to R o 5 4 and R i 5 6.25; (c) rotating flows with f 5 0.0002 s21 corresponding to R o 5 1 and R i 5 6.25; (d) same as (c) except with different upper radiation boundary condition; and (e) a quasigeostrophic flow (parameters are same as Fig. 3).
In this section, we have presented semianalytical solutions that indicate the flow response near the lower effective ICL and CCL. However, it is difficult to mathematically apply the continuation condition to study the global behavior, so we will use a numerical model to obtain more general solutions based on relatively wider ranges of control parameters. The semianalytical solutions will help verify the numerical results.
3. The numerical model This two-dimensional version of the North Carolina State University Geophysical Fluid Dynamics Model is based on the nonlinear primitive equations governing orographically forced, finite-amplitude, hydrostatic perturbations in a rotating, continuously stratified, Boussinesq flow in the terrain-following coordinate s 5 z t (z
15 SEPTEMBER 1999
2 z s )/(z t 2 z s ), where z s (x) is the mountain geometry and z t is the top of the computational domain. The horizontal momentum equations, hydrostatic equation, incompressible continuity equation, and thermodynamic energy equation are ]u ]u ]u ]U 1 (U 1 u) 1 s˙ 1 s˙ 2 fy ]t ]x ]s ]s
1
2
1 ]p ]p 1G 1 nu 5 Du , ro ]x ]s
(22)
]y ]y ]y 1 (U 1 u) 1 s˙ 1 fu 1 ny 5 Dy , ]t ]x ]s
(23)
1
1 ]p gu 5 , r o ]s HQ
1 2 1 2
] zt u ] z ts˙ 1 5 0, ]x H s H
(24)
(25)
]u ]u ]Q ] 1 (U 1 u) 1 y 1 s˙ (Q 1 u ) 1 ny ]t ]x ]y ]s 5 Du ,
(26)
where G5
1 ]x 2 5 z 2 z ]z ; ]s
s 2 z t ]z s
z
t
3293
SHEN AND LIN
s
H5
]s zt 5 . ]z z t 2 z s
(27)
The details of the numerical model can be found in Weglarz (1994) and Lin and Wang (1996). The number of the horizontal and vertical grid points for the physical domain are 128 and 161, respectively. The grid interval Dx is chosen to allow L/a 5 12.8 for all cases, where L is the length of half domain. The grid interval Dz is 62.5 or 125 m. This fine vertical resolution is used to simulate the behavior near the critical levels. For some cases, larger Dz is chosen to investigate the effect of the upper effective ICL. The basic wind profile is taken to be U 5 U o (H 2 z)/H, as mentioned in the previous section. An idealized bell-shaped mountain ridge is adopted throughout this study, h(x) 5
hm a 2 , x2 1 a2
(28)
where a and h m are the mountain half-width and height, respectively. 4. Numerical results In this section, we will show a number of cases with relatively wider ranges of R o and R i . To achieve this, we fix U o , f, and h m , but vary N and a to allow variations in both R i and R o . We assume U o 5 20 m s21 , f 5 1024 s21 , and h m 5 250 m. Here N varies from 0.004 to 0.04 s21 , while a varies from 50 to 1000 km. Stone (1966) pointed out that baroclinic instabilities dominate if R i $ 0.95; symmetric instabilities dominate if 0.25 , R i
TABLE 1. Parameters for numerical simulations. Here h 5 hm a 2/ (a 2 1 x 2), hm 5 250 m, Uo 5 20 m s21, f 5 0.0001 s21, T is total integration time, and L is domain half-width. a (km) T (h) D x (km) UoT/a L /a Ro(Uo /af )
50 13.9 10 20 12.8 4
100 200 250 334 500 1000 27.8 55.6 55.6 556 55.6 111.1 20 40 50 66.8 100 200 20 20 16 12 8 8 12.8 12.8 12.8 12.8 12.8 12.8 2 1 0.8 0.6 0.4 0.2
, 0.95; and Kelvin–Helmholtz (K–H) instabilities dominate if R i , 0.25. Our choice of ]/]y 5 0 and R i $ 1 will eliminate both symmetric and K–H instabilities. Table 1 summarizes the flow parameters for our simulations. In the following, ‘‘stationary state’’ means that flow patterns do not change with time, but the magnitudes may vary slightly with time. For large-scale mountains, it takes a longer time to reach a stationary state. We will discuss how to efficiently determine the total integration time for all cases at the end of this section. To compare the absolute magnitudes, we fix the total integration time for some cases. Figures 5 and 6 show the horizontal and vertical velocity perturbation fields, respectively. The Richardson number varies from 1 to 6.25 to 25 to 100 from the first to fourth columns, while the Rossby number varies from 4 to 1 to 0.6 to 0.2 for the first to fourth rows. These panels will be labeled from a–p. For unstable flows, shown in panels e, i, and m, we double Dz to enlarge the physical domain in order to study the effects of the upper effective ICLs. In the first rows of Figs. 5 and 6, the disturbances produced by the mountain are confined below the lower effective ICL when R o 5 4 and R i 5 1 (Figs. 5a, 6a). The flow pattern below the lower effective ICL is similar to that in the nonrotating flow case and the vertical wavelength of the disturbance decreases as R i increases. However, dispersive waves exist in the x direction, which are caused by the Coriolis force (Queney 1948; Eliassen and Thorsteinsson 1984). On the downstream (right) side, the horizontal wavelength of surface u (horizontal velocity perturbation) with R i 5 25 and R i 5 100 can be roughly estimated by 2pU/ f, which was derived by Smith (1982) for uniform flow on an f plane. It gives a value of 1256 km near the surface, as shown in Figs. 5c and 5d. Both the horizontal scale and the vertical wavelength become shorter as the disturbance propagates upward. Near the lee slope, the horizontal velocities become stronger and the vertical velocities become weaker as R i increases. In order to understand the stability of the individual flow regimes, we perform an energy budget analysis (Fig. 7). The total integration times for all cases shown in Fig. 7 are equal or larger than those of the corresponding cases with the same R o and R i shown in Figs. 5 and 6. In the following, we will discuss the flow fields (Figs. 5, 6) and energy budget (Fig. 7) simultaneously. The energy budget has been normalized by the numerical domain area. The energy budgets between the nonrotating case (Fig. 7a) and the
3294
JOURNAL OF THE ATMOSPHERIC SCIENCES
VOLUME 56
FIG. 5. Numerical results of horizontal perturbation velocity (u) for a rotating flow with critical levels. Parameter are shown in Table 1. Contour intervals are denoted on top of each panel. Here N ranges from 0.04 to 0.004 s21 , and f ranges from 0.000 05 to 0.001 s21 . The Richardson number varies from 1 to 6.25 to 25 to 100 from the first to the fourth column, while the Rossby number varies from 4 to 1 to 0.6 to 0.2 for the first to the fourth row. All plates show either the steady-state response or the early stage of instabilities. The physical domain height is 10 km, except for (e), (i), (m), and (n), where height is 20 km.
weakly rotating case (say, R o 5 4; Fig. 7b) appear to be in good agreement. In the first hour of simulation, there is an abrupt increase of the surface drag for these cases. This can be explained by the start-up adjustment of the flow field to the mountain terrain in the numerical
model because the mountain is introduced abruptly at the first time step. Both results indicate that the surface drags and momentum flux are in balance. However, by including the Coriolis force, the negative contribution from the advection term (label ‘‘resi’’ in the figure) is
15 SEPTEMBER 1999
SHEN AND LIN
3295
FIG. 6. Same as Fig. 5 except for the vertical velocity.
slightly stronger. The small positive heat flux is due to the reflection by the lateral boundary. It will be zero if we choose a larger domain. For all R i , the lower effective ICL of R o 5 1 appears to be lower than that of R o 5 4 (e.g., Figs. 5b,f). The agreement of vertical velocity for R o 5 1 and R i 5 6.25 between semianalytic solutions (Figs. 4c or 4d) and numerical results (Fig. 6f) is reasonably good. The vertical
velocity field for R o 5 1 and R i 5 100 (Fig. 6h) is similar to that of Wurtele et al. (1996), even though their dimensional mountain width, basic-state stratification, and wind shear are different. The semianalytical solutions for R o 5 1, R i 5 6.25, with a suitable upper condition in Fig. 4d agree better with the numerical results (Fig. 6f) than those shown in Fig. 4c. Thus, we may conclude that the upper radiation condition based
3296
JOURNAL OF THE ATMOSPHERIC SCIENCES
VOLUME 56
FIG. 7. Energy budget. Here ‘‘pw0’’ indicates bottom surface drag, pw (0); ‘‘vquz’’ indicates the heat flux transfer, (r o gf/N 2Q) # 0T yu U z z dz; ‘‘uwuz’’ indicates the momentum flux, 2r o # 0T uw U z dz; ‘‘pw’’ indicates top boundary forcing, 2pw (z T ); and ‘‘resi’’ indicates L/2 zT 2#2L/2 # 0 (U]E T /]u 1 ](pu)/]x) dz dx. All terms are normalized by the physical domain area. The scales are (a), (b) 5 3 1026 ; (c) 5 3 1025 ; and (d) 1 3 1026 . The physical domain height is (a), (b), (c) 10 km; and (d) 20 km. (a) R i 5 25 and R o 5 `; (b) R i 5 25 and R o 5 4; (c) R i 5 25 and R o 5 0.4; (d) R i 5 1 and R o 5 0.2. z
on the two-dimensional Fourier analysis is better than that used by Wurtele et al. For R o 5 1 and R i 5 25 (Figs. 5g, 6g), the energy budget analysis is similar to that shown in Fig. 7b. The horizontal wavelengths of the flow with R i 5 25 and 100 (Figs. 5g,h) are still approximately 2pU/ f, similar to the unsheared flow. For R i 5 1 or 6.25 (Figs. 6e,f), the flow below the lower effective ICL still behaves like inertia-gravity waves in an unsheared flow but becomes trapped near the CCL downstream. The trapped baroclinic lee wave near the CCL provides evidence that wave energy from the topography can propagate upward to the CCL, because its lower ICL exists below the surface and cannot absorb the upward wave energy. The horizontal wavelengths for these baroclinic lee waves are about 1800 km for R i 5 1 and 3200 km for R i 5 6.25. The latter is close to the theoretical value of l 5 2p /k* 5 2pNH/ f predicted by the QG theory (Smith 1986). However, the former
is greater than the QG theoretical value. This may indicate the importance of ageostrophic effects for small R i (e.g., Nakamura 19883). We will further discuss results for R i 5 1 but different R o later. For a large R i (25 or 100), there also exist the baroclinic lee-wave modes. However, these baroclinic modes with small amplitudes but long wavelengths due to high N, according to Eqs. (12) and (13), may not appear in the chosen domain, where inertial-gravity modes dominate. Basically, the dynamics of lee-wave modes is similar to those for moderate and small R i . When R o decreases, the constant phase lines of the waves are oriented more vertically (as shown for cases
3 He pointed out that small R i can increase the Rossby radius of deformation.
15 SEPTEMBER 1999
3297
SHEN AND LIN
with R o 5 0.6). For a larger R i , such as R i 5 25 (R o 5 0.6) and R i 5 25, 100 (R o 5 0.2), there also exist baroclinic lee waves (e.g., Figs. 6n,o). In addition, the numerical results can be interpreted in two ways: one is similar to the semianalytical solutions below the lower effective ICL (Fig. 4d), the other is similar to the semianalytical solution near the CCL (Fig. 4e). We may conclude that the semianalytical solutions can give a qualitatively correct description, although the quantitative description may be less satisfactory if we do not apply the continuation condition at the critical levels. The energy budgets with R o 5 0.4 and R i 5 25 (Fig. 7c) indicate that the surface drag reaches a constant value after U o t/a 5 20. This increase of total energy due to the mountain (surface drag) at the earlier stage has been identified as orographic instability by Tosi et al. (1983) and orographic growth by Smith (1986). Compared to the surface drag, the heat flux transfer (denoted as vquz in Fig. 7c) is nearly zero before U o t/ a 5 10 and then becomes negative. The zero value of the domain-averaged heat flux indicates that positive and negative heat fluxes mainly due to the baroclinic lee waves cancel each other at the early stage. During this period, the waves are becoming stationary. When the train of baroclinic lee waves extends downstream from the mountain, the domain-averaged heat flux becomes negative. Now, we will discuss the results for flow with R i 5 1 and R o 5 1 2 0.2. At the early stage, these wave patterns (e.g., Figs. 5e, 6e) still behave like stationary inertia–gravity waves or baroclinic lee waves. For R o 5 1, the horizontal perturbation velocity shows that there exist extrema at 12 km, which can be defined as an upper effective ICL. Nakamura (1988) pointed out this is due to the ‘‘absorbing’’ nature of the ICL. The height of the upper effective ICL is estimated by U 5 2 f/k*, where k* is the wavenumber of the trapped lee wave. As R o decreases (R o 5 0.6), the height of the upper effective ICL shown in Fig. 5i is higher than that with R o 5 1 shown in Fig. 5e. As the R o reduces to 0.2, the energy budget analysis of this case (Fig. 7d) shows that flow becomes weakly unstable at the earlier stage corresponding to the positive north–south heat flux that oscillates with time. The heat flux becomes a major source term after about Ut/a 5 12, and the flow becomes strongly unstable. These results show that there might exist ‘‘baroclinic’’ instability. When the flow is at the weakly unstable stage, say Ut/a 5 4, the flow patterns of u and w are similar to those with R o 5 1 and R o 5 0.6. The height of the vertical velocity maximum occurs at the height of the wind reversal, and the upper effective ICL appears in the physical domain. After the flow becomes more unstable (e.g., Ut/a 5 8 as shown in Figs. 5m, 6m), the perturbation propagates upstream. The vertical velocity indicates that the height of the maximum value extends to 20 km. The energy budget analysis for R o 5 0.6 and R o 5 1 is similar to that of Fig. 7d. The heat flux oscillates with time at the earlier stage and
becomes a major source term after Ut/a 5 25 and Ut/a 5 30, respectively (not shown). As R i increases (e.g., R i 5 100) and R o 5 0.2 (Figs. 5p, 6p), the wave becomes evanescent in the lower levels, similar to orographically forced QG flow (e.g., Smith 1979a; Trub and Davies 1995). Near the CCL, the response still behaves like a trapped baroclinic lee wave. In Smith’s theory, the mechanism of lee cyclogenesis is the horizontal warm advection by the baroclinic lee wave. However, for R o ; 1, adiabatic warming and the horizontal warm advection by an inertia-gravity wave at the lee slope may also be important. Figure 8 shows the perturbation pressure ( p) and potential temperature (u) for R o 5 1 (a 5 200 km) and R o 5 0.6 (a 5 334 km). For pressure fields, both cases show that there exist lee troughs located at about 1000 km on the lee side. It is interesting that the patterns of the pressure fields for both cases behave like a QG baroclinic lee wave, although the R os are not small. This will be explained later. These pressure troughs result hydrostatically from the warm air over the lee side. For R o 5 0.6, the pattern of u (Fig. 8d) is similar to a baroclinic lee wave. However, the inertia–gravity wave mode becomes important for R o 5 1 (Fig. 8b). In the following, we will investigate the relative importance of the adiabatic warming and warm advection by the inertia–gravity wave and the warm advection by the baroclinic wave to the development of the lee trough for moderate R o (51). With the use of the thermal wind relation, the thermodynamic equation relation may be written as ]u ]u u 1 U 5 o ( fUzy 2 N 2 w). ]t ]x g
(29)
The first and second terms on the right-hand side are the horizontal temperature advection and adiabatic warming or cooling, respectively. Figure 9b, which shows the meridional velocity, can be compared with Figs. 6f and 9a with an appropriate choice of the contour interval of 0.5 m s21 . From Fig. 9a, the net effects of fU z y 2 N 2 w produce high temperature (Fig. 8b) on the lee side near the surface ranging from x 5 1.5a to x 5 7.5a. Near the downslope of the mountain (x from 0 to 2.5a), both the warm advection (Fig. 9b) and the adiabatic warming (Fig. 6f) have made positive contributions to the trough development. However, a comparison among Figs. 6f, 9a, and 9b shows that horizontal temperature advection dominates when x $ 3a. This indicates that the adiabatic cooling associated with upward motion (w . 0 in Fig. 6f), which occurs near x 5 3a, is compensated by the strong warm advection (y U z . 0) associated with strong northerly wind (y , 0 in Fig. 9b). By using a Fourier transform, we can decompose the meridional velocity into an inertia-gravity wave mode (Fig. 9c) and a baroclinic lee-wave mode (Fig. 9d).
3298
JOURNAL OF THE ATMOSPHERIC SCIENCES
VOLUME 56
FIG. 8. (a), (c) Perturbation pressure; and (b), (d) perturbation potential temperature. (a), (b) R o 5 1 and R i 5 6.25; (c), (d) R o 5 0.6 and R i 5 6.25.
Again, the inertia-gravity wave mode shows a dispersive property, and there appear negative and positive meridional velocities on the downstream side, which can contribute to warm and cold advection, respectively. Since the dominant wavelength of baroclinic lee waves, which is roughly equal to 2pNH/ f, is independent of the mountain half-width, it is not surprising to find that there exist baroclinic lee waves for a 5 200 km only if the spectrum of mountain wavenumbers is broad enough. Comparing Figs. 9c and 9d suggests that the component of the meridional velocity associated with the baroclinic lee-wave mode is two times larger than that for the inertia-gravity wave mode. According to Eq. (29) and the hydrostatic equation, the magnitudes of u and p are proportional to # y dx and ## y dx dz, respectively. Thus, the contribution to the u and p by the inertia–gravity wave mode is relatively small because of its periodic property in both the x and z directions. This is the reason why the pressure field (Fig. 8a) behaves like a QG baroclinic lee wave. Therefore, we may conclude that the lee trough for a moderate R o (51) is still mainly caused by horizontal warm advection, and this warm advection is dominated by a baroclinic lee-wave mode. The inertia-gravity wave confined by the lower effective ICL appears to play a minor role in the formation of the
trough. However, near the downslope of the mountain, both the warm advection by the inertia-gravity mode and the adiabatic warming also have made positive contributions to the trough development. Note that Smith’s QG theory did not consider the last two mechanisms that become more important when R o becomes larger. For linear flows, the dynamics for the same R o , but with different combinations of f and a, should be the same. In Fig. 10, we keep R o , R i , and the total nondimensional integration time constant (R o 5 0.4, R i 5 1, and U o t/a 5 8), but vary f and a. Figures 10a and 10c are the horizontal u velocities and energy budget analysis for a case with a 5 500 km and f 5 1024 s21 . The same fields for a 5 100 km and f 5 5 3 1024 s21 are shown in Figs. 10b and 10d. Both cases show that the flows behave like baroclinic lee waves, and more wave energy is trapped near the upper effective ICL when an instability occurs. Moreover, the unstable waves appear to propagate upstream. From the energy budget analysis shown in Figs. 10c and 10d, the time evolutions of the energy budgets are almost identical. Therefore, we may conclude that the use of an artificially high Coriolis parameter gives us an efficient way to obtain steadystate solutions if simulations require a wide range of R o . Also, this method provides guidance for choosing
15 SEPTEMBER 1999
SHEN AND LIN
3299
FIG. 9. Numerical results for R o 5 1 and R i 5 6.25. (a) Source term of Du /Dt in Eq. (32), fU z y 2 N 2 w. The real contour interval is 2 3 1027 m s23 , (b) meridional velocity (y ). The contour interval is 0.5 m s21 , (c) inertia wave modes of y , and (d) lee-wave mode of y .
the total integration time for all cases listed in Table 1. Shutts and Gray (1994) used the same idea to study the geostrophic adjustment process following deep convection. 5. Concluding remarks In order to investigate the effects of critical levels on two-dimensional, rotating, backsheared, hydrostatic flow over an isolated mountain ridge, we have obtained ‘‘semianalytical’’ solutions and performed a large number of numerical experiments. Semianalytical means that we obtain solutions analytically in terms of hypergeometric functions in Fourier space and then transform them back to physical space numerically using an FFT algorithm. For a nonrotating system, comparison between our semianalytical solutions and the analytical solutions of Smith (1986) is fairly good. Moreover, the semianalytical solutions help in understanding the dynamics of orographically forced NG flows. The solutions show that the lower effective ICL plays a similar role as the CCL does in a nonrotating flow, and that its height decreases as R o decreases.
Between the upper and lower effective ICLs, the dominant wave mode is nonpropagating (evanescent). Our semianalytical solutions show that the flow with moderate and small R o near the CCL behaves like a trapped baroclinic lee wave, which was not emphasized by Wurtele et al. (1996). The baroclinic lee wave can be identified as an orographically forced neutral Eady wave with a resonant wavenumber k* 5 f/NH. By including the vertical advection of the basic wind (wU z ) in the QG model, we can analytically show that the baroclinic lee-wave solutions are still valid for moderate R i , say R i 5 10. The resonant wavenumber of the baroclinic lee waves indicated by the semianalytical solutions is approximately equal to f/NH. Also, the behavior of the baroclinic lee waves near the mountain in our solutions is more accurate than the analytical solutions for the QG flow, which are based on the lee-wave theory and can be only applied far downstream. Although the semianalytical solutions reveal the local behavior near the critical levels, the continuation conditions across the critical levels cannot be applied easily. Therefore, we use a simple numerical model to study and document the flow regimes. From the numerical simulations discussed in section 4, four flow regimes
3300
JOURNAL OF THE ATMOSPHERIC SCIENCES
VOLUME 56
FIG. 10. (a), (b) Horizontal perturbation velocity; and (c), (d) energy budgets with same R o 5 0.4, R i 5 1, and U o t/ a 5 8; but with different Coriolis parameter and mountain half-width. Physical domain height is 20 km for both cases. (a), (b) a 5 500 km and f 5 1024 s21 ; (c), (d) a 5 100 km and f 5 5 3 1024 s21 . The scales are (a), (b) 1027 ; and (c), (d) 5 3 1027 .
TABLE 2. Regime diagram. For two-dimensional back-sheared flow over an isolated mountain ridge on an f plane, four wave regimes are identified: (I) inertia-gravity waves (IG); (II) combined inertia-gravity waves and baroclinic lee waves (IG&BL); (III) combined evanescent and baroclinic lee waves (E&BL); and (IV) transient waves (U); where E is evanescent mode, IG is propagating inertia-gravity mode, BL is baroclinic lee-wave mode, and U is unstable mode.
Ro Ro Ro Ro Ro Ro Ro
5 5 5 5 5 5 5
4 2 1 0.8 0.6 0.4 0.2
Ri 5 1
Ri 5 6.25
Ri 5 25
Ri 5 100
IG IG U U U U U
IG IG IG&BL IG&BL IG&BL IG&BL E&BL*
IG IG IG IG&BL IG&BL IG&BL E&BL
IG IG IG IG IG IG&BL E&BL
* Although we identify this as a stable case, the positive surface drag oscillates with time.
are identified and listed in Table 2 for basic flows with different R o and R i : (a) regime I for inertia-gravity waves, (b) regime II for inertia-gravity waves and trapped baroclinic lee waves, (c) regime III for evanescent waves and trapped baroclinic lee waves, and (d) regime IV for transient waves. For a relatively large R o ($2), the wave pattern belongs to regime I. The flow behaves like unsheared inertia-gravity waves below the lower effective ICL, and the dispersion of wave energy in the x direction can be found because of the presence of the Coriolis force. As R i increases (i.e., as N increases), the wavenumber below the lower effective ICL increases, too. Most of the wave energy is absorbed below the lower effective ICL. From an energy budget analysis, it is found that the surface drag and the momentum flux make positive and negative contributions, respectively, to the time variation of total perturbation energy. When these two terms
15 SEPTEMBER 1999
3301
SHEN AND LIN
cancel each other, a steady state can be reached. This wave regime has been discussed by Wurtele et al. (1996). For moderate R o (;2–0.8) and large R i (;25–100), flow patterns are similar to regime I. For moderate R o and moderate R i (;6.25), or small R o (;0.8–0.4) and moderate (large) R i ($25), the flow patterns are classified as regime II. The wave behaves like wave regime I below the lower effective ICL. There exists a baroclinic lee-wave mode near the CCL. The wave energy of the lee waves appears to be able to propagate through the lower effective ICL. However, in fact, this is because the lower ICL of the lee wave is below the surface. There exists no lower ICL in the domain to absorb the wave energy of the lee waves. This feature is quite different from that of a nonrotating flow and is characterized by the QG dynamics. The CCL for the lee waves can be regarded as a steering level. Roughly speaking, in this regime, the flow patterns look like a combination of inertia–gravity waves and baroclinic lee waves, which occur below the lower effective ICL and near the CCL, respectively. Wurtele et al. (1996) did not investigate this wave regime in their study. Although the surface drag still makes a positive contribution, the north–south heat flux does make a negative contribution. The existence of baroclinic lee waves for moderate R o may indicate that Smith’s theory of lee cyclogenesis based on a QG model may still be applied for flow with moderate R o . Our analysis for R o 5 1 shows that near the downslope of the mountain, both the warm advection by the inertia-gravity wave mode and the adiabatic warming also have made positive contribution to the lee pressure trough, although the trough is still mainly caused by horizontal warm advection of the baroclinic lee-wave mode. Regime III occurs for flows with very small R o (#0.2) and large R i ($25). In these cases, very broad mountains will damp out all but the QG wave modes. In the lower level, the wave appears to be evanescent, which is similar to the wave behavior for orographically forced QG uniform flow. The wave behaves like a baroclinic lee wave near the CCL, and the lee waves are nonpropagating with its lower ICL below the surface. Surface drag and heat flux transfer are the major source and sink terms. For small and moderate R o (#1) and small R i (#1), there exists no steady state. These flows are classified as regime IV. The energy budget analysis shows that a NG baroclinic instability may exist in this regime, because the north–south heat flux transfer has a positive contribution for flows with small R i where the QG theory is invalid. As R o decreases, the onset of this instability occurs sooner. In a subsequent paper, we will discuss this instability in detail and will show that this instability can be identified as the the inertia criticallayer instability found by Nakamura (1988). Acknowledgments. Discussions with Drs. G. S. Janowitz and R. P. Weglarz are highly appreciated. Thanks
are also extended to Drs. M. L. Kaplan and S. E. Koch for their comments and to anonymous reviewers whose comments on the original manuscript have improved the quality of this paper significantly. This work is supported by NSF Grant ATM-9224595. Part of the computations were performed on the workstation clusters at the North Carolina Supercomputing Center. APPENDIX A Governing Equations for Weakly NG Flows The QG equation set with vertical advection included in the x direction is w
]U 1 ]p 5 fy 2 , ]z ro ]x
(A1)
]y 5 2fu, ]x
(A2)
U
]u ]w 1 5 0, ]x ]z
(A3)
1 ]p u 5g , ro ]z uo U
(A4)
]u fu N 2uo 1 o (2Uzy ) 1 w 5 0. ]x g g
(A5)
The above equation set is reduced to the semigeostrophic system if we replace y by y g in Eq. (A2), and is further reduced to the QG system if we neglected U z w in Eq. (A1). After a straightforward manipulation and taking the Fourier transform, we may obtain f 2w ˆ zz 2
Uz 2 ( f 2 U 2 k 2 )w ˆ z 2 (k 2 N 2 )w ˆ 5 0. U
By assuming f 2 k U 2 k 2 , the above equation reduces to Eq. (11) in the text. APPENDIX B Radiation Condition for a Rotating Flow Following Eliassen and Palm (1960), we can show that the vertical energy flux [Eq. (7)] can be expressed as pw 5
1
2 1
2
ro U f2 ]w ˆ 1 2 2 2 Im w ˆ* . 2k U k ]z
(B1)
Below the lower ICL (viz., f 2 /U 2 k 2 , 1), we may assume a wavelike solution, wˆ 5 Ae imz 1 Be2imz . Substituting into (B1) yields
1
2
1 f2 m pw 5 ro U 1 2 2 2 (|A| 2 2 |B| 2 ). 2 U k k If both k and U are positive, the exp(imz) mode, which
3302
JOURNAL OF THE ATMOSPHERIC SCIENCES
represents a wave with lines of constant phase tilted upstream, transports energy upward, whereas a solution of the form exp(2imz), which represents a wave with phase lines titled downstream, transports wave energy downward. However, if k is negative, the solutions exp(imz) and exp(2imz) transport wave energy downward and upward, respectively. Since U . 0 below the lower ICL, we choose the modes whose horizontal and vertical wavenumbers have the same sign to allow the energy to propagate upward. Thus the radiation condition can be applied in a two-dimensional Fourier space. REFERENCES Andrews, D. G., and M. W. McIntyre, 1976: Planetary waves in horizontal and vertical shear: The generalized Eliassen–Palm relation and the mean zonal acceleration. J. Atmos. Sci., 33, 2031–2048. Bannon, P. R., and J. A. Zehnder, 1989: Baroclinic flow over a mountain ridge. J. Atmos. Sci., 46, 703–714. Booker, J. R., and F. P. Bretherton, 1967: The critical layer for internal gravity waves in shear flow. J. Fluid Mech., 27, 513–539. Bretherton, F. P., 1966: The propagation of groups of internal gravity waves in a shear flow. Quart. J. Roy. Meteor. Soc., 92, 466– 480. Clark, T. L., and W. R. Peltier, 1984: Critical level reflection and resonant growth of nonlinear mountain waves. J. Atmos. Sci., 41, 3122–3134. Dickinson, R. E., 1970: Development of a Rossby wave critical level. J. Atmos. Sci., 27, 628–633. Durran, D. R., 1986: Another look at downslope windstorms. Part I: On the development of analogs to supercritical flow in an infinitely deep, continuously stratified fluid. J. Atmos. Sci., 43, 2527–2543. Eliassen, A., 1969: On mesoscale mountain waves on the rotating earth. Geofys. Publ., 27, 1–15. , and E. Palm, 1960: On the transfer of energy in stationary mountain waves. Geofys. Publ., 22 (3), 1–23. , and S. Thorsteinsson, 1984: Numerical studies of stratified air flow over a mountain ridge on the rotating earth. Tellus, 36A, 172–186. Gill, A. E., 1982: Atmosphere–Ocean Dynamics. Academic Press, 662 pp. Grimshaw, R., 1975: Internal gravity waves: Critical layer absorption in a rotating fluid. J. Fluid Mech., 70, 287–304. Jones, W. L., 1967: Propagation of internal gravity wave in fluids with shear and rotation. J. Fluid Mech., 30, 439–448. Kreyszig, E., 1988: Advanced Engineering Mathematics. 6th ed. John Wiley and Sons, 1294 pp. Lin, Y.-L., 1989: A theory of cyclogenesis forced by diabatic heating. Part I: A quasi-geostrophic approach. J. Atmos. Sci., 46, 3015– 3036. , 1994: Airflow over mesoscale heat source, Part I: Responses in a uniform flow. Proc. Nat. Sci. Counc., 18, 1–32.
VOLUME 56
, and D. J. Perkey, 1989: Numerical modeling studies of a process of lee cyclogenesis. J. Atmos. Sci., 46, 3685–3697. , and T.-A. Wang, 1996: Flow regimes and transient dynamics of two-dimensional stratified flow over an isolated mountain ridge. J. Atmos. Sci., 53, 139–158. Maslowe, S. A., 1986: Critical layers in shear flows. Annu. Rev. Fluid Mech., 18, 405–432. Mathews, J., and R. L. Walker, 1970: Mathematical Methods of Physics. 2d ed. Addison-Wesley, 501 pp. Miles, J. W., 1964: Baroclinic instability of the zonal wind: Part III. J. Atmos. Sci., 21, 603–609. Miyahara, S., 1981: A note on the behavior of waves around the inertio-frequency. J. Meteor. Soc. Japan, 59, 902–905. Nakamura, N., 1988: Scale selection of baroclinic instability—Effects of stratification and nongeostrophy. J. Atmos. Sci., 45, 3253– 3267. Press, W. H., B. P. Flannery, S. A. Teukolsky, and W. T. Vetterling, 1990: Numerical Recipes. Cambridge University Press, 702 pp. Queney, P., 1948: The problem of airflow over mountains: A summary of theoretical studies. Bull. Amer. Meteor. Soc., 29, 16–26. Scha¨r, C., 1990: Quasi-geostrophic lee cyclogenesis. J. Atmos. Sci., 47, 3044–3066. Scorer, R. S., 1949: Theory of waves in the lees of mountain. Quart. J. Roy. Meteor. Soc., 75, 41–56. Shutts, G. J., and M. E. B. Gray, 1994: A numerical modeling study of the geostrophic adjustment process following deep convection. Quart. J. Roy. Meteor. Soc., 120, 1145–1178. Smith, R. B., 1979a: The influence of mountains on the atmosphere. Advances in Geophysics, Vol 21, Academic Press, 87–230. , 1979b: The influence of the earth’s rotation of mountain wave drag. J. Atmos. Sci., 36, 177–180. , 1982: Synoptic observations and theory of orographically disturbed wind and pressure. J. Atmos. Sci., 39, 60–70. , 1984: A theory of lee cyclogenesis. J. Atmos. Sci., 41, 1159– 1168. , 1985: On severe downslope winds. J. Atmos. Sci., 42, 2597– 2603. , 1986: Further development of a theory of lee cyclogenesis. J. Atmos. Sci., 43, 1582–1602. Stone, P. H., 1966: On non-geostrophic baroclinic stability. J. Atmos. Sci., 23, 390–400. , 1970: On non-geostrophic baroclinic stability: Part II. J. Atmos. Sci., 27, 721–726. Tosi, E., M. Faniti, and A. Trevisan, 1983: Numerical experiments on orographic cyclogenesis: Relationship between the development of the lee cyclone and the basic flow characteristics. Mon. Wea. Rev., 111, 799–814. Trub, J., and H. C. Davies, 1995: Flow over a mesoscale ridge: Pathways to regime transition. Tellus, 47A, 502–524. Weglarz, R. P., 1994: Three-dimensional geostrophic adjustment of homogeneous and continuously stratified atmosphere with application to the dynamics of midlatitude jet streaks. Ph.D. dissertation, North Carolina State University at Raleigh, 414 pp. Wurtele, M. G., A. Data, and R. D. Sharman, 1996: The propagation of gravity-inertia waves and lee waves under a critical level. J. Atmos. Sci., 53, 1505–1523. Yamanaka, M. D., and H. Tanaka, 1984: Propagation and breakdown of internal inertia-gravity waves near critical levels in the middle atmosphere. J. Meteor. Soc. Japan, 62(1), 1–16.